

Altered Sodium and Potassium, but not Calcium Currents in Cerebellar Granule Cells in an In Vitro Model of Neuronal Injury
- PMID: 27517720
- PMCID: PMC11482125
- DOI: 10.1007/s10571-016-0416-6
Altered Sodium and Potassium, but not Calcium Currents in Cerebellar Granule Cells in an In Vitro Model of Neuronal Injury
Abstract
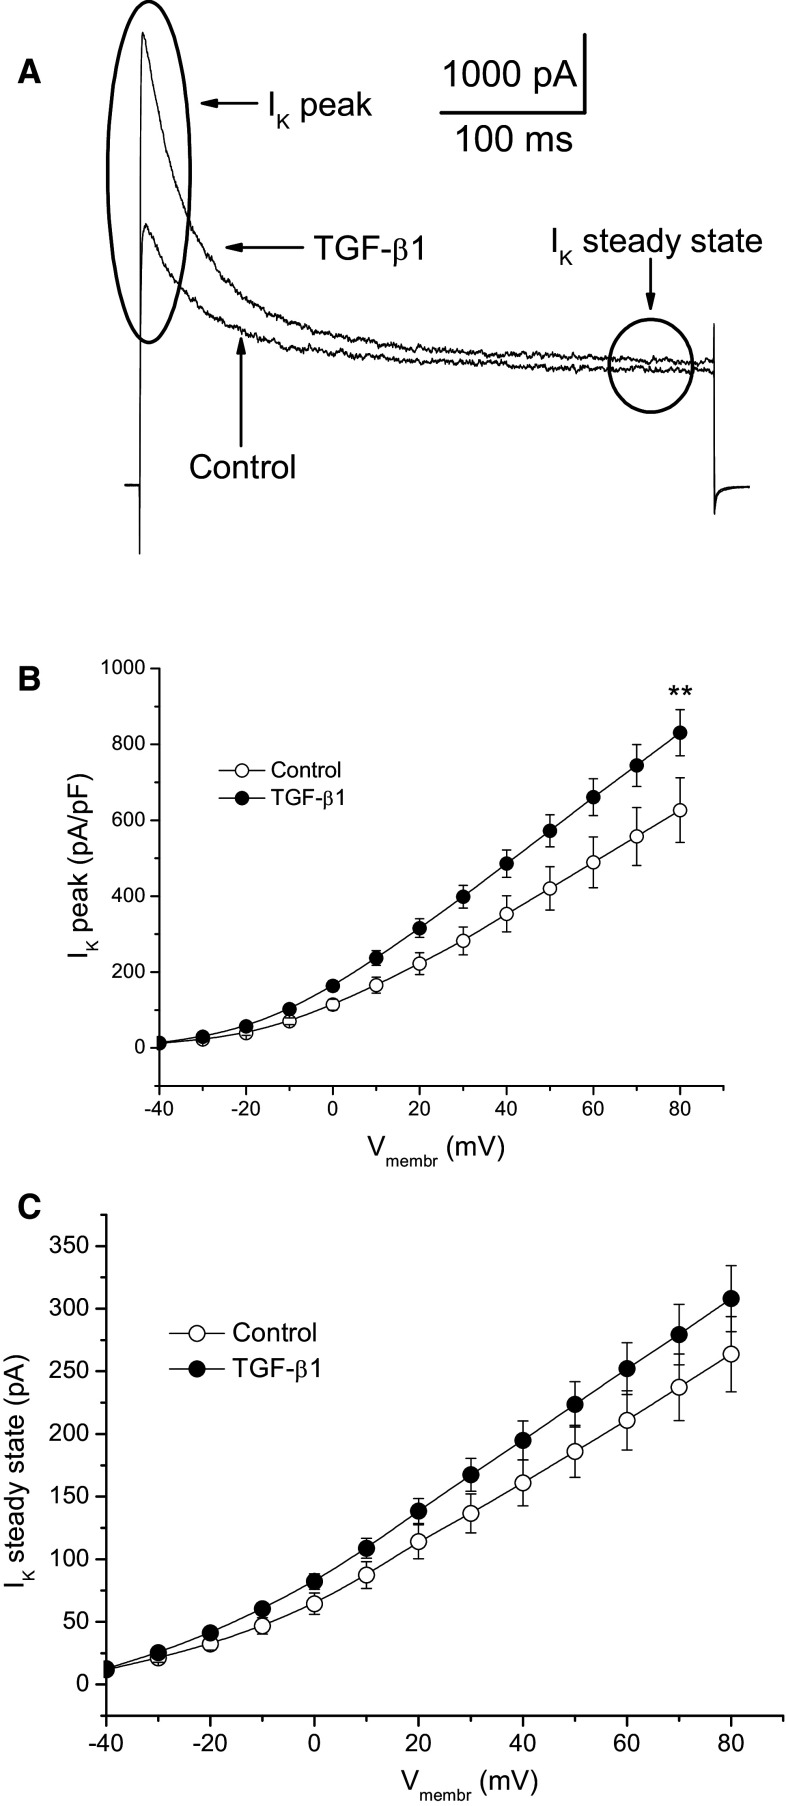
Acute injury of central nervous system (CNS) starts a cascade of morphological, molecular, and functional changes including formation of a fibrotic scar, expression of transforming growth factor beta 1 (TGF-β1), and expression of extracellular matrix proteins leading to arrested neurite outgrowth and failed regeneration. We assessed alteration of electrophysiological properties of cerebellar granule cells (CGCs) in two in vitro models of neuronal injury: (i) model of fibrotic scar created from coculture of meningeal fibroblasts and cerebral astrocytes with addition of TGF-β1; (ii) a simplified model based on administration of TGF-β1 to CGCs culture. Both models reproduced suppression of neurite outgrowth caused by neuronal injury, which was equally restored by chondroitinase ABC (ChABC), a key disruptor of fibrotic scar formation. Voltage-dependent calcium current was not affected in either injury model. However, intracellular calcium concentration could be altered as an expression of inositol trisphosphate receptor type 1 was suppressed by TGF-β1 and restored by ChABC. Voltage-dependent sodium current was significantly suppressed in CGCs cultured on a model of fibrotic scar and was only partly restored by ChABC. Administration of TGF-β1 significantly shifted current-voltage relation of sodium current toward more positive membrane potential without change to maximal current amplitude. Both transient and sustained potassium currents were significantly suppressed on a fibrotic scar and restored by ChABC to their control amplitudes. In contrast, TGF-β1 itself significantly upregulated transient and did not change sustained potassium current. Observed changes of voltage-dependent ion currents may contribute to known morphological and functional changes in injured CNS.
Keywords: Calcium current; Cerebellar granule cells; Chondroitinase ABC; Fibrotic scar; Potassium current; Sodium current; TGF-β1.
Conflict of interest statement
Authors declare no conflict of interest and no financial interest in the publication of this manuscript
Figures


Similar articles
-
Fibrotic scar model and TGF-β1 differently modulate action potential firing and voltage-dependent ion currents in hippocampal neurons in primary culture.Eur J Neurosci. 2017 Sep;46(6):2161-2176. doi: 10.1111/ejn.13663. Epub 2017 Sep 4. Eur J Neurosci. 2017. PMID: 28833693
-
TGFβ1 downregulates neurite outgrowth, expression of Ca2+ transporters, and mitochondrial dynamics of in vitro cerebellar granule cells.Neuroreport. 2014 Mar 26;25(5):340-6. doi: 10.1097/WNR.0000000000000106. Neuroreport. 2014. PMID: 24535220
-
An in vitro model of the inhibition of axon growth in the lesion scar formed after central nervous system injury.Mol Cell Neurosci. 2010 Feb;43(2):177-87. doi: 10.1016/j.mcn.2009.10.008. Epub 2009 Nov 6. Mol Cell Neurosci. 2010. PMID: 19897043
-
Effects of extracellular pH on voltage-gated Na+, K+ and Ca2+ currents in isolated rat CA1 neurons.J Physiol. 1996 Jun 15;493 ( Pt 3)(Pt 3):719-32. doi: 10.1113/jphysiol.1996.sp021417. J Physiol. 1996. PMID: 8799894 Free PMC article.
-
Roles of chondroitin sulfate and dermatan sulfate in the formation of a lesion scar and axonal regeneration after traumatic injury of the mouse brain.J Neurotrauma. 2013 Mar 1;30(5):413-25. doi: 10.1089/neu.2012.2513. Epub 2013 Feb 25. J Neurotrauma. 2013. PMID: 23438307 Free PMC article.
Cited by
-
Building better brains: the pleiotropic function of neurotrophic factors in postnatal cerebellar development.Front Mol Neurosci. 2023 May 12;16:1181397. doi: 10.3389/fnmol.2023.1181397. eCollection 2023. Front Mol Neurosci. 2023. PMID: 37251644 Free PMC article. Review.
References
-
- Berry M, Maxwell WL, Logan A, Mathewson A, McConnell P, Ashhurst DE, Thomas GH (1983) Deposition of scar tissue in the central nervous system. Acta Neurochir Suppl (Wien) 32:31–53 - PubMed
-
- Brackenbury WJ, Calhoun JD, Chen C, Miyazaki H, Nukina N, Oyama F, Ranscht B, Isom LL (2010) Functional reciprocity between Na+ channel Nav1.6 and beta1 subunits in the coordinated regulation of excitability and neurite outgrowth. Proc Natl Acad Sci USA 107(5):2283–2288. doi:10.1073/pnas.0909434107 - PMC - PubMed
MeSH terms
Substances
LinkOut - more resources
Full Text Sources
Other Literature Sources
