. 2016 Nov;132(5):721-738.
doi: 10.1007/s00401-016-1603-8. Epub 2016 Aug 12.

Co-regulation of mRNA translation by TDP-43 and Fragile X Syndrome protein FMRP

Affiliations

Co-regulation of mRNA translation by TDP-43 and Fragile X Syndrome protein FMRP

Pritha Majumder et al. Acta Neuropathol. 2016 Nov.

Abstract

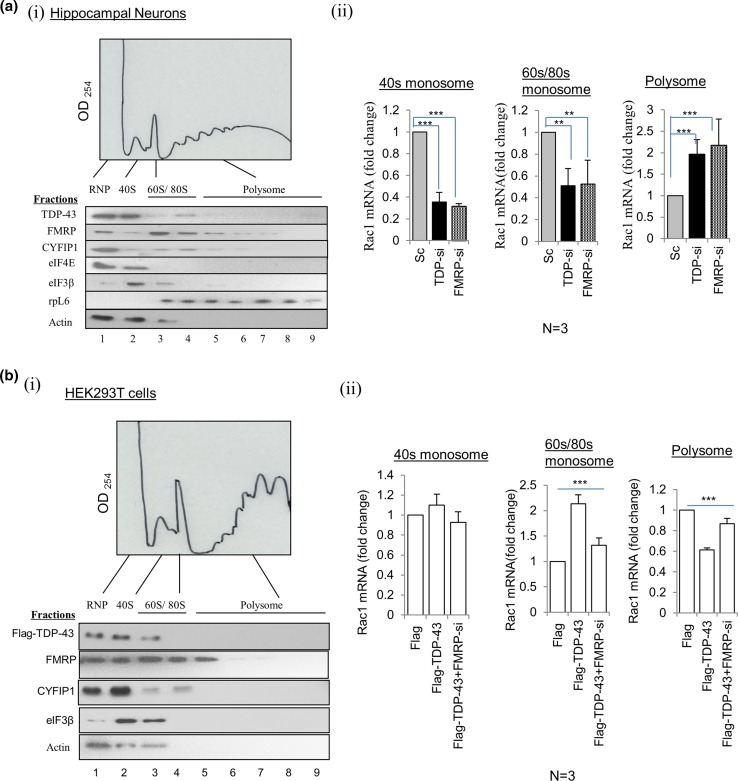
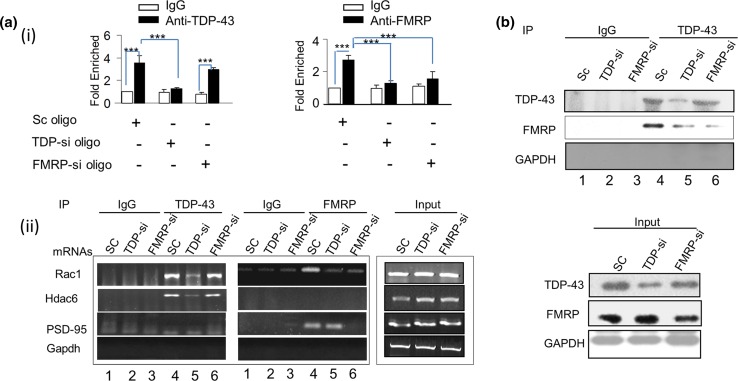
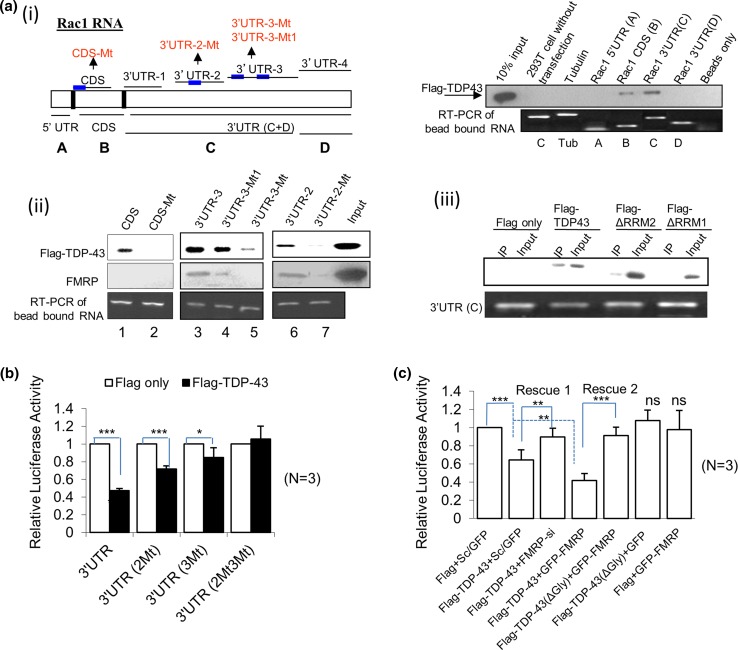
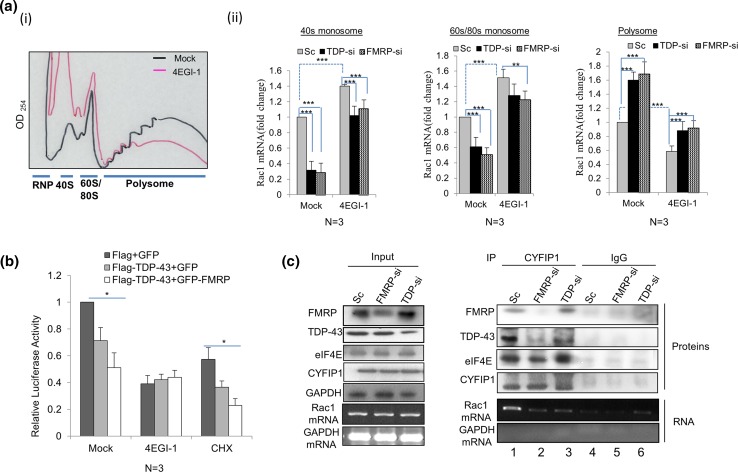
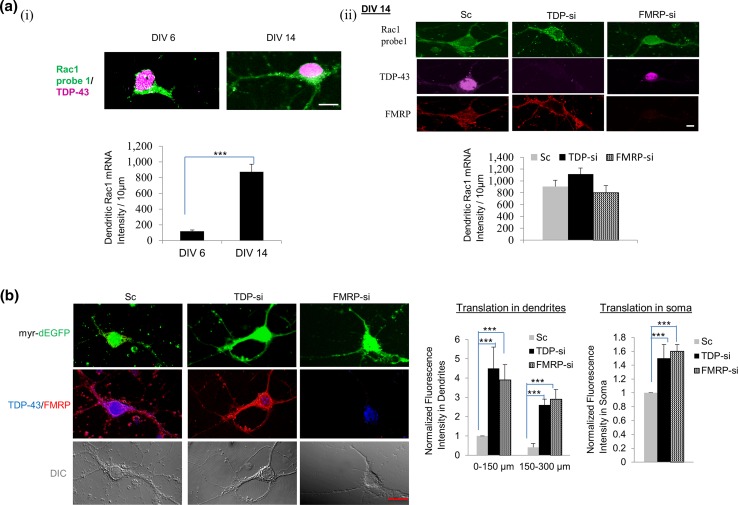
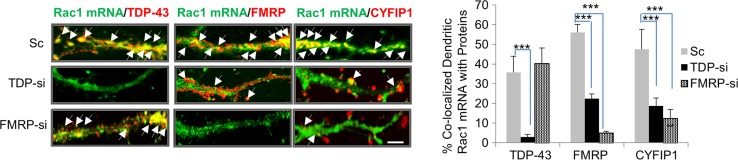
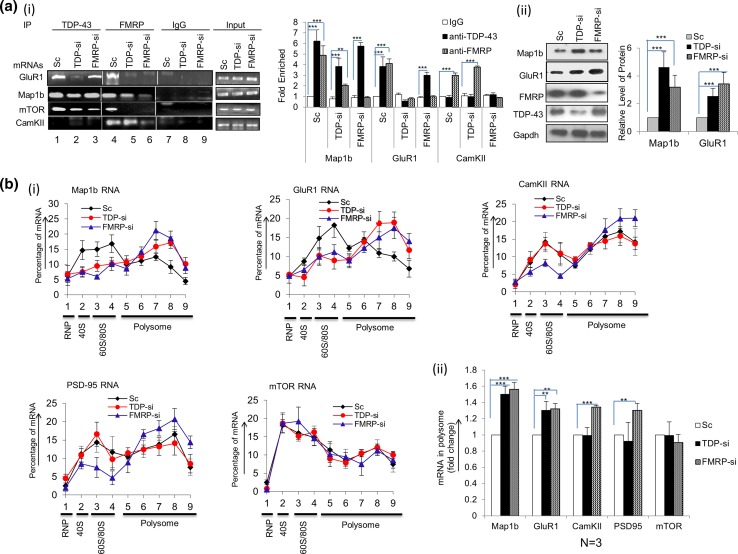
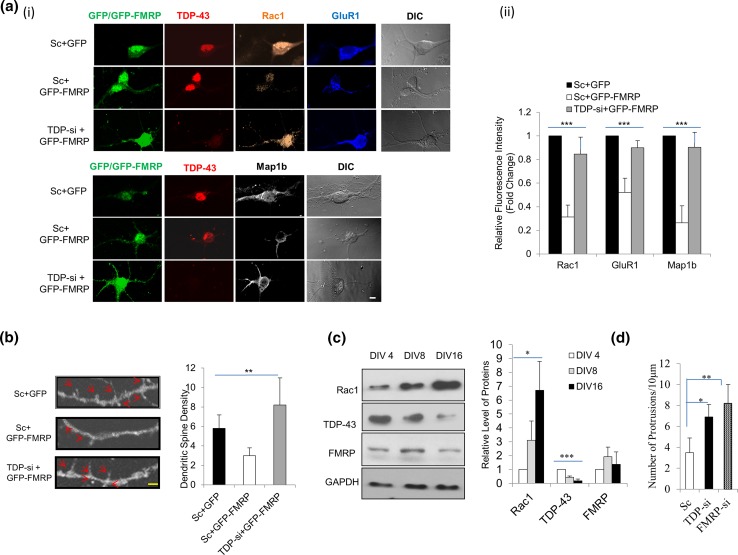
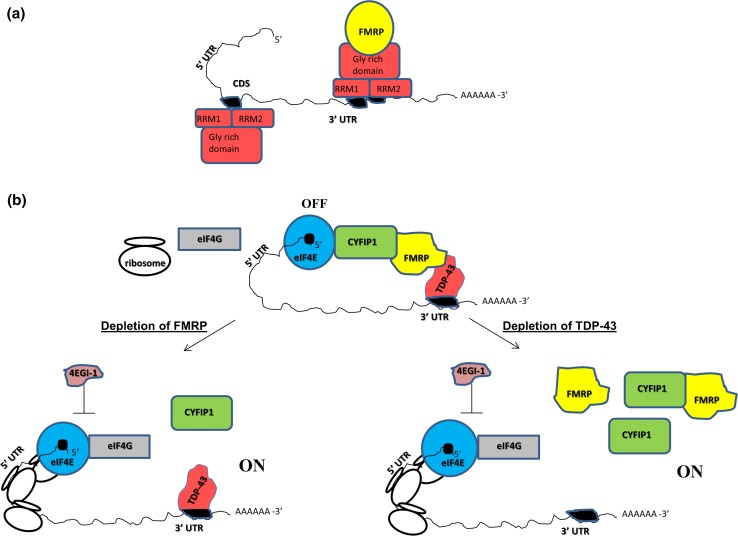
For proper mammalian brain development and functioning, the translation of many neuronal mRNAs needs to be repressed without neuronal activity stimulations. We have discovered that the expression of a subclass of neuronal proteins essential for neurodevelopment and neuron plasticity is co-regulated at the translational level by TDP-43 and the Fragile X Syndrome protein FMRP. Using molecular, cellular and imaging approaches, we show that these two RNA-binding proteins (RBP) co-repress the translation initiation of Rac1, Map1b and GluR1 mRNAs, and consequently the hippocampal spinogenesis. The co-repression occurs through binding of TDP-43 to mRNA(s) at specific UG/GU sequences and recruitment of the inhibitory CYFIP1-FMRP complex by its glycine-rich domain. This novel regulatory scenario could be utilized to silence a significant portion of around 160 common target mRNAs of the two RBPs. The study establishes a functional/physical partnership between FMRP and TDP-43 that mechanistically links several neurodevelopmental disorders and neurodegenerative diseases.

Keywords: CYFIP1; FISH; FMRP; Immunofluorescence staining; Live cell imaging; Polysome profile; RNA-IP; TDP-43; Translation initiation.


Figures

Fig. 1
Fig. 1
Effects of depletion of TDP-43/FMRP or over-expression of TDP-43 on the polysomal distribution of Rac1 mRNA. a Polysomal distribution of different proteins (i) and mRNAs (ii) in mouse primary hippocampal neurons. Cytoplasmic extracts, from cultured DIV 6 neurons transfected with different siRNA oligos, were separated by sucrose gradient sedimentation. i Top, representative polysome profile of DIV 6 primary hippocampal neurons. Bottom, different fractions of the sucrose gradient loaded with extract from Sc oligo-transfected hippocampal neurons were analyzed by Western blotting using different antibodies. ii Quantitative RT-PCR analysis of Rac1 mRNA in 40S monosome (left histogram), 60S/80S monosomes (middle histogram), and polysome (right histogram) fractions of DIV 6 primary hippocampal neurons transfected with Sc, TDP-si and FMRP-si oligos. The experiments were repeated 3 times for each of three different preparations of neuron culture (N = 3). Statistical significance between control Sc oligo and TDP-si or FMRP-si oligo transfected neurons was determined by Student’s t test: ***p < 0.0001 and **p < 0.001. Inputs were similar (data not shown). The graphs of polysomal distribution from use of one of the three biological samples are exemplified in Fig S1b. b Polysomal distributions of Rac1 mRNAs in HEK293T cells with ectopic expression of TDP-43 and/or depletion of FMRP by FMRP-si oligo. i Top, Representative polysomal profile of HEK293T cells. Bottom, Western blot analysis of the distribution patterns of different proteins in the polysomal fractions of HEK293T cells over-expressing pFlag-TDP-43. ii Quantitative RT-PCR analysis of Rac1 mRNA in 40S monosome (left histogram), 60S/80S monosomes (middle histogram), and polysome (right histogram) fractions of HEK293T cells transfected with pFlag, pFlag-TDP-43 ± FMRP-si oligo. The experiments were repeated 3 times for each of three different sets of extract preparation (N = 3). Significant differences among the three groups were determined by one way ANOVA, ***p < 0.0001. Inputs were similar (data not shown). The graphs of polysomal distribution from use of one of the three biological samples are exemplified in Fig S1d
Fig. 2
Fig. 2
TDP-43 associated recruitment of FMRP in mRNP complex containing Rac1 mRNA in vivo. a RNA-IP. Total cellular extracts of cultured hippocampal neurons transfected with Sc, TDP-si or FMRP-si were immunoprecipitated with different antibodies, and the immunoprecipitated RNAs were analyzed (N = 3) by quantitative (i), presented as fold enrichment normalized to Sc-IgG, or semi-quantitative (ii) RT-PCR using primers specific for Rac1 mRNA. Hdac6 and PSD-95(Dlg4) mRNAs were also analyzed as positive controls and Gapdh mRNA as the negative control. Inputs were similar. Data in (i) are presented as mean ± SD, from three independent experiments. Significant changes in enrichment of Rac1 mRNA between IgG pulled down and anti-TDP-43 or anti-FMRP pulled down samples as well as between control Sc oligo and TDP-si or FMRP-si oligo transfected neurons are represented by ***p < 0.0001 (Student’s t test). b Identification of proteins associated with Rac1 mRNA. Proteins isolated from RNA-IP complexes were analyzed by Western blotting using anti-TDP-43 and anti-FMRP. The experiment was repeated several times
Fig. 3
Fig. 3
Binding and translational repression of Rac1 mRNA by TDP-43 and FMRP. a In vitro binding assay of TDP-43 to wild type and mutated Rac1 mRNA fragments. Biotinylated RNA probes corresponding to different parts of Rac1 mRNA, with or without base substitutions disrupting the putative TDP-43-binding UG/GU sequences (left map in i), were incubated with total cell extracts from HEK293T cells over-expressing Flag-TDP-43 (i, ii) and/or different deletion mutants of Flag-TDP-43 (iii). Affinity-purified elutes were separated on SDS-PAGE and immunoblotted with anti-Flag) top panels in i, ii, iii) or anti-FMRP (middle panel in ii). As the loading control, RNAs immunoprecipitated by anti-FLAG were also analyzed by semi-quantitative RT-PCR using primer set(s) specific for each of the corresponding RNA probes (bottom panels in i, ii, iii). All the experiments were repeated at least three times. b Luciferase reporter assay of HEK293T cells co-transfected with pFlag-TDP-43 and the psicheck2 reporter carrying full length wild type/mutant 3′UTR sequences of Rac1. Luciferase protein levels in cell extracts prepared at 48 h post-transfection were determined and presented as fold changes (N = 3), comparing cells co-expressing Flag-TDP-43 relative to cells co-expressing Flag. Significant differences in luciferase activity between Flag and Flag-TDP-43 transfected cells are represented by ***p < 0.0001 and *p < 0.01 (Student’s t test). c Luciferase activity assay of HEK293T cells co-transfected with the reporter containing Rac1 3′UTR, Sc oligo or FMRP-si oligo, and one or more of the following expression plasmids: pFlag, pGFP, pFlag-TDP-43 pGFP-FMRP, pFlag-TDP-43(ΔGly). Luciferase activities (N = 3) are represented as the fold change compared to cells transfected with Sc oligo, pFlag and pGFP. Rescue1 and Rescue 2 represent significant recovery of Rac1-3′UTR-mediated luciferase reporter translation. Significant changes are represented by ***p < 0.0001 and **p < 0.001 (Student’s t test). The amounts of RNA transcripts from different expression plasmids were similar in b and c (data not shown)
Fig. 4
Fig. 4
Translational co-repression of Rac1 mRNA by TDP-43 and FMRP at the initiation stage. a Effects of 4EGI-1, TDP-si oligo and FMRP-si oligo on polysomal distributions of Rac1 mRNA. i Representative polysome profiles of cultured DIV 6 hippocampal neurons with or without treatment of 25 µM 4EGI-1 for 30 min. ii Quantitative RT-PCR analysis of Rac1 mRNA in 40S monosome (left histogram), 60S/80S monosomes (middle histogram), and polysome (right histogram) fractions of DIV 6 primary hippocampal neurons transfected with Sc, TDP-si or FMRP-si oligo and with (represented as ‘4EGI-1’) or without (represented as ‘Mock’) treatment of 25 µM 4EGI-1 for 30 min. The results are presented by the histobar diagrams representing data from three different preparations of primary neuron culture (N = 3), each with three technical repeats of experiments. Significant differences between control Sc oligo and TDP-si or FMRP-si oligo transfected neurons as well as between Mock and 4EGI-1 treated neurons are represented by ***p < 0.0001 and **p < 0.001 (Student’s t test). Inputs were similar (data not shown). The graphs of polysomal distribution from use of one of the three biological samples are exemplified in Fig S4. b Luciferase reporter assay of HEK293T cells transfected with psicheck2-3′UTR reporter with (pFlag + pGFP), (pFlag-TDP-43 + pGFP) or (pFlag-TDP-43 + pGFP-FMRP), followed by treatment with 5 µM cyclohexamide (CHX) or 50 µM 4EGI-1 (4EGI-1) for 12 h. Luciferase activities are presented as fold changes relative to that of cells transfected with (pFlag + pGFP) and without any drug treatment (N = 3). Significant differences among different groups were determined by one way ANOVA, *p < 0.01. c IP analysis of the association of CYFIP1 with TDP-43, FMRP and Rac1 mRNA in DIV 6 primary hippocampal neurons. Cell lysates from primary hippocampal neurons transfected with siRNA oligos were immunoprecipitated with anti-CYFIP1 or anti-rabbit IgG, and then analyzed by Western blotting (top 4 panels on the right) or by RT-PCR (bottom 2 panels on the right). The experiment was repeated for 3 times with the statistical analysis shown in Fig S6b. Inputs were similar, as shown in the left lower 5 panels
Fig. 5
Fig. 5
Rac1-3′UTR-mediated translational co-repression by TDP-43 and FMRP in hippocampal neuron dendrites. a Imaging analysis of Rac1 mRNA by FISH in DIV 6 and DIV 14 hippocampal neurons. i Hippocampal neurons at different DIVs were hybridized with Rac1 probe 1 (green, see Supplementary materials and methods for details) and anti-TDP-43 (magenta). The histogram (bottom) compares the levels of Rac1 mRNA, presented as fluorescence intensity per 10 µm of dendrites of transfected neurons. Each set of data was collected from 15 to 18 transfected neurons from three independent experiments. Error bars represent SEM and significant difference is represented by ***p < 0.0001 (Student’s t test). Scale bar 5 µm. ii FISH and immunofluorescence staining analysis of DIV 14 hippocampal neurons transfected with Sc, TDP-si or FMRP-si RNA oligo using Rac1 probe 1(green, see Supplementary materials and methods for details), anti-TDP-43 (magenta), and anti-FMRP (red). The histogram compares the levels of Rac1 mRNA. For each set of samples, the data were collected from 10 to 14 transfected neurons from three independent experiments. Error bars represent SEM. Scale bar 1 µm. Note that we calculated the fluorescence intensity in all FISH experiments using Rac1 anti-sense probe 1 (see Supplementary materials and methods for details) in comparison to the control. Furthermore, specificity of the FISH experiments was validated by the 60–70 % decrease of the fluorescence intensity upon RNAi knock down of Rac1 mRNA (Fig S5). b Imaging analysis of DIV 14 hippocampal neurons co-transfected with different RNAi oligos and pmyr-dEGFP-3′UTR as described in Supplementary materials and methods. The transfected neurons were probed with anti-TDP-43 or anti-FMRP. The distribution patterns of myr-dEGFP proteins expressed in transfected neurons are exemplified by the confocal microscope images (top 3 panels). Immunofluorescence from the endogenous TDP-43 protein (blue) and FMRP protein (red) (middle 3 panels) and DIC images (bottom 3 panels) of the same neurons are also shown. Fluorescence intensities of myr-dEGFP protein at near and distal dendrites (0–150 and 150–300 µm, left histogram) and soma (right histogram) were measured and normalized to Sc oligo-transfected neurons. A total of 20–25 neurons from three independent experiments were characterized. Error bars represent SEM and significant difference is represented by ***p < 0.0001 (Student’s t test). Scale bar 5 µm. Note that blockade of the action potentials with tetrodotoxin (TTX) significantly decreased expression of myr-dEGFP in distal dendrites of TDP-si or FMRP-si transfected neurons (data not shown), supporting that myr-dEGFP fluorescence patterns reflect local translation of myr-dEGFP-3′UTR mRNA
Fig. 6
Fig. 6
TDP-43 assisted recruitment of FMRP in dendritic Rac1 mRNP complex. Co-localization of Rac1 mRNA with TDP-43, FMRP and CYFIP1 proteins in TDP-43- or FMRP-depleted primary hippocampal neurons. DIV 14 hippocampal neurons were subjected to imaging analysis by FISH using of Rac1 mRNA using probe 1 (see Supplementary materials and methods for details) and immunofluorescence staining using anti-TDP-43, anti-FMRP or anti-CYFIP1. Representative confocal microscope images are shown on the left with arrows indicating co-localization of Rac1 mRNA with the three proteins. Quantification of the co-localization data from three sets of independent experiments (15–20 dendrites for each condition) is represented as a bar diagram on the right showing the percentages of dendritic Rac1 mRNA co-localized with TDP-43, FMRP or CYFIP1 proteins. Scale bar 5 μm. Significant differences are represented by ***p < 0.0001 and **p < 0.001 (Student’s t test)
Fig. 7
Fig. 7
Binding and translational regulation of dendritic mRNAs by FMRP and TDP-43. a i RNA-IP analysis of binding of GluR1(Gria1), Map1b, CamKII and mTOR mRNAs with FMRP and TDP-43 proteins in hippocampal neurons transfected with different RNAi oligos. Co-immunoprecipitated RNAs were analyzed by semi-quantitative (left) or quantitative (right) RT-PCR. Gapdh served as the negative control (not shown). Representative gel picture of semi-quantitative RT-PCR analysis are depicted on the left with lanes 1, 4 and 7 showing RNA enrichment in Sc oligo; lanes 2, 5 and 8 showing RNA enrichment in TDP-si oligo; and lanes 3, 6 and 9 showing RNA enrichment in FMRP-si oligo transfected neurons. Statistical analysis of data from three independent experiments is shown on the right. Significant differences in fold enrichment of different mRNAs between anti-IgG and anti-TDP-43 or anti-FMRP pulled down samples are represented by ***p < 0.0001 (Student’s t test). ii Relative expression levels of Map1b, GluR1, TDP-43 and FMRP proteins in cultured hippocampal neurons upon depletion of TDP-43 or FMRP by RNAi. Total proteins from DIV 6 primary hippocampal cultures transfected with different RNAi oligos for 48 h were subjected to Western blotting. Statistical analysis from three independent experiments is shown on the right. Significant differences are represented by ***p < 0.0001 (Student’s t test). b Polysomal distributions of different mRNAs in cultured DIV 6 hippocampal neurons transfected with different RNAi oligos. i RT-PCR analysis of RNAs isolated from different sucrose gradient fractions of cytoplasmic extracts from the transfected neurons. The data were plotted as the percentage of total mRNA in the gradient. Error bars represent SD from three experimental repeats from same set of biological sample. Percentage of mRNA level was significantly different between Sc oligo transfected and TDP-si or FMRP-si transfected neurons at 2nd–4th, 8th and 9th fractions for Map1b and GluR1 mRNA distributions. It was also significantly different between Sc oligo transfected and FMRP-si transfected neurons at 3rd, 4th and 9th fractions for CamKII and PSD-95 mRNA distributions (p < 0.01, pairwise t test). ii Quantitative RT-PCR analysis of the indicated mRNAs in polysome fractions of DIV 6 primary hippocampal neurons transfected with Sc, TDP-si and FMRP-si oligos, respectively. The fold of changes relative to the Sc oligo-transfected neurons are represented as the bar diagram. Error bars represent SD from three independent experiments with different biological samples. Significant differences between Sc oligo transfected and TDP-si or FMRP-si transfected neurons are represented by ***p < 0.0001 and **p < 0.001 (Student’s t test). Inputs are similar (data not shown)
Fig. 8
Fig. 8
Co-operation of TDP-43 and FMRP in translational inhibition of different proteins and spinogenesis in primary hippocampal neurons. a Imaging analysis of the effect of TDP-43 depletion on FMRP-mediated inhibition of Rac1, Map1b and GluR1 protein expression in DIV 14 neurons. Representative pictures of hippocampal neurons co-transfected with pGFP or pGFP-FMRP plus RNA oligo Sc or TDP-si and showing the fluorescence patterns from GFP (green) and from immunofluorescence staining of TDP-43 (red), Rac1 (orange), GluR1 (blue) and Map1b (white), respectively, are displayed in (i). The DIC images of the neurons are shown on the right. Scale bars = 2 μm. ii The immunofluorescence intensities of Rac1, GluR1 and Map1b in 45–55 transfected neurons from three independent experiments were measured and normalized to those of the (Sc + GFP) neurons. The fold of changes were calculated and shown in the bar diagram. Error bars represent SEM. b Imaging analysis of the effect of TDP-43 depletion on FMRP-mediated reduction of the dendritic protrusion density. Representative confocal microscope images of DIV 14 hippocampal neurons transfected with Sc oligo + pGFP (top), Sc oligo + pGFP-FMRP (middle) and TDP-si oligo + pGFP-FMRP (bottom), respectively, are shown on the left, with arrows indicating the dendritic protrusions. Histoplot of the average densities of dendritic protrusion of 10–15 neurons from three independent experiments is shown on the right. Scale bars 5 μm. c Developmental changes in the expression levels of TDP-43, FMRP and Rac1 proteins in mouse primary hippocampal neurons in culture. Western blotting patterns are shown on the left and statistical analysis is shown on the right. Data represent the mean ± SD (error bars; N = 3). Significant differences in a, b and c were determined by one way ANOVA ***p < 0.0001, **p < 0.001 and *p < 0.01. d Histoplot showing the increased density of dendritic protrusions in cultured DIV 6 hippocampal neurons upon RNAi knockdown of TDP-43 or FMRP. For each set, 12–16 neurons from three independent experiments have been analyzed. Statistical significances are represented by **p < 0.001 and *p < 0.01 (Student’s t test)
Fig. 9
Fig. 9
A model of translational co-repression of specific mRNA(s) by FMRP and TDP-43. a Schematic representation of TDP-43 engaged in binding with mRNA(s) and FMRP protein. TDP-43 (red) binds to UG/GU motifs (black) in the 3′UTR or CDS of the mRNA(s) through its RNA-binding domains (RRM1, RRM2). RNA-bound TDP-43 also physically interacts with FMRP protein (yellow) through its glycine-rich domain and recruits FMRP to the vicinity of the mRNA(s). b ON–OFF states of the translation of specific mRNA(s) mediated by FMRP and TDP-43. In the “OFF” state, RNA-bound TDP-43 (red) recruits FMRP (yellow) or the FMRP-CYFIP1 complex to the vicinity of the mRNA(s). FMRP-bound CYFIP1 (green) interacts with eIF4E (blue), thereby blocking eIF4G (grey) from binding to eIF4E and forming the eIF4F translation initiation complex (not shown). Under FMRP-depleted conditions (left lower scheme), TDP-43 still binds to UG/GU repeat sequence(s) in the mRNA(s) but CYFIP1 (green) can no longer be recruited, thus allowing the formation of the eIF4E-eIF4G complex at the 5′cap site and ribosome entry to start translation. When TDP-43 is depleted (right lower scheme) the inhibitory complex CYFIP1-FMRP cannot be recruited to the vicinity of the mRNA(s) to repress translation. Note that in either of the “ON” states, initiation complex formation between eIF4E and eIF4G can still be inhibited by the drug 4EGI-1

Similar articles

Cited by

References

    1. Aakalu G, Smith WB, Nguyen N, Jiang C, Schuman EM. Dynamic visualization of local protein synthesis in hippocampal neurons. Neuron. 2001;30:489–502. doi: 10.1016/S0896-6273(01)00295-1. - DOI - PubMed
    1. Abbeduto L, McDuffie A, Thurman AJ. The fragile X syndrome-autism comorbidity: what do we really know? Front Genet. 2014;5:355. doi: 10.3389/fgene.2014.00355. - DOI - PMC - PubMed
    1. Abekhoukh S, Bardoni B. CYFIP family proteins between autism and intellectual disability: links with Fragile X syndrome. Front Cell Neurosci. 2014;8:81. doi: 10.3389/fncel.2014.00081. - DOI - PMC - PubMed
    1. Baralle M, Buratti E, Baralle FE. The role of TDP-43 in the pathogenesis of ALS and FTLD. Biochem Soc Trans. 2013;41:1536–1540. doi: 10.1042/BST20130186. - DOI - PubMed
    1. Bechara EG, Didiot MC, Melko M, Davidovic L, Bensaid M, Martin P, Castets M, Pognonec P, Khandjian EW, Moine H, et al. A novel function for fragile X mental retardation protein in translational activation. PLoS Biol. 2009;7:e16. doi: 10.1371/journal.pbio.1000016. - DOI - PMC - PubMed

MeSH terms

Substances