. 2017 Jun;69(3):435-442.
doi: 10.1007/s10616-016-0005-z. Epub 2016 Aug 12.

Assay systems for screening food and natural substances that have anti-hyperuricemic activity: uric acid production in cultured hepatocytes and purine bodies-induced hyperuricemic model mice

Affiliations

Assay systems for screening food and natural substances that have anti-hyperuricemic activity: uric acid production in cultured hepatocytes and purine bodies-induced hyperuricemic model mice

Shin-Ichi Adachi et al. Cytotechnology. 2017 Jun.

Abstract

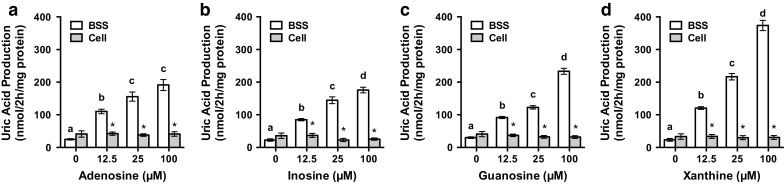
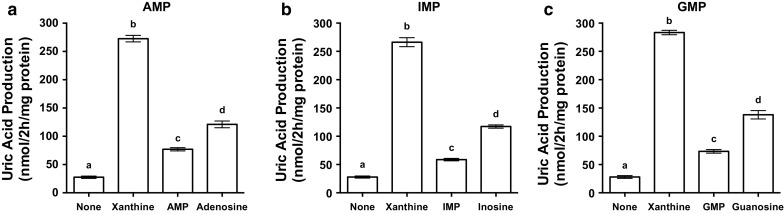
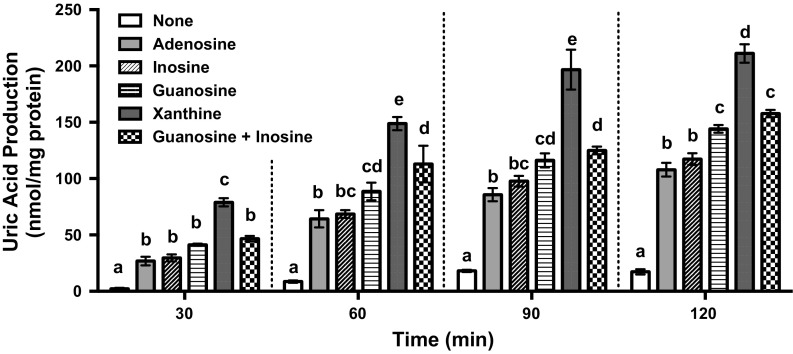
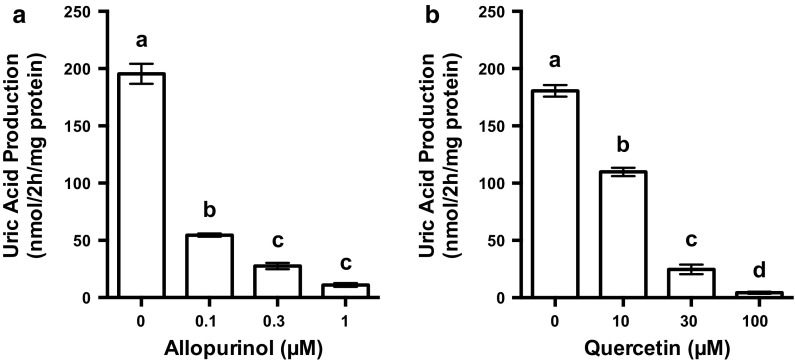
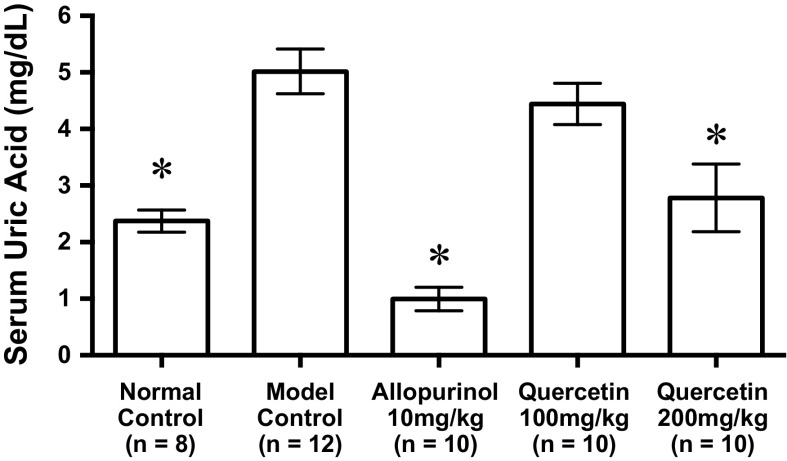
Hyperuricemia is characterized by the high uric acid (UA) level in serum (or plasma) and has been considered to be an important risk factor for gout. In the present study, we have attempted to construct an assay system for UA production in vitro employing cultured AML12 hepatocytes. UA levels in balanced salt solution (BSS) in the presence of UA precursor nucleosides, adenosine, inosine, guanosine and xanthine, at 12.5, 25, and 100 µM were significantly higher than BSS alone and their effects were dose-dependent, while all the UA precursors did not significantly increase intracellular UA levels. Hence, UA levels in BSS were thereafter adopted as an index of UA production. UA production from nucleosides was significantly higher than that from nucleotides (GMP, IMP and AMP). UA production from guanosine and inosine in combination (GI mixture) as well as nucleosides increased time-dependently and almost linearly up to 2 h. Selecting GI mixture, effects of allopurinol, a widely used anti-hyperuricemic agent, and quercetin, a well-known polyphenol in onion and strawberry, on UA production were examined. Both allopurinol and quercetin dose-dependently (0.1, 0.3 and 1 μM for allopurinol and 10, 30, and 100 μM for quercetin) and significantly reduced UA production in the hepatocytes. They also significantly reduced hyperuricemia induced by intraperitoneal injection of UA precursor purine bodies to mice at a single oral dose of 10 (allopurinol) or 200 (quercetin) mg/kg body weight. This assay system for UA production in cultured hepatocytes is considered to be useful to search for novel anti-hyperuricemic compounds in foods and natural resources with possibility to have human health benefits.

Keywords: AML12 hepatocyte; Hyperuricemia; Purine body; Uric acid.


Conflict of interest statement

Ethical Approval

This study was conducted on the basis of general ethical norms indicated by the Japan Society for the Promotion of Science (JSPS).

Conflict of interest

Authors declare that they have no conflict of interest.

Figures

Fig. 1
Fig. 1
Effects of adenosine, inosine, guanosine and xanthine on uric acid production in AML12 cells. AML12 cells were treated with various concentrations of adenosine (a), inosine (b), guanosine (c) and xanthine (d) for 2 h in balanced salt solution (BSS). Uric acid levels in the BSS (white bars) and the cells (gray bars) were measured by the uricase method. Each value represents mean ± SEM for six wells (duplicate measurements per well). Values not sharing a common letter are significantly different at P < 0.05 among the BSS groups (Tukey test). *Significantly different at P < 0.05 from UA levels in the BSS at the same UA precursor concentrations (paired Student t test)
Fig. 2
Fig. 2
Effects of AMP, IMP and GMP on uric acid production in AML12 cells. AML12 cells were treated with 100 µM AMP (a), 100 µM IMP (b) and 100 µM GMP (c) for 2 h in balanced salt solution (BSS). Uric acid production was measured by the uricase method. Each value represents mean ± SEM for six wells (duplicate measurements per well). Values not sharing a common letter are significantly different at P < 0.05 (Tukey test)
Fig. 3
Fig. 3
Time-course of uric acid production in AML12 cells after addition of its precursors. AML12 cells were treated with various UA precursors in 300 µl of BSS with 100 µM adenosine, 100 µM inosine, 100 µM guanosine, 100 µM xanthine, guanosine + inosine (100 µM each), and BSS alone (control). Uric acid production was measured by the uricase method at 30, 60, 90 and 120 min after treatment of the precursors, Each value represents mean ± SEM four wells (single measurement per well). Values not sharing a common letter are significantly different at P < 0.05 (Tukey test)
Fig. 4
Fig. 4
Effects of allopurinol and quercetin on UA production in AML12 cells. AML12 cells were treated with 0.1, 0.3 and 1 µM allopurinol or 10, 30 and 100 µM quercetin for 2 h in balanced salt solution containing guanosine + inosine (100 µM each). Uric acid production was measured by the uricase method. Each value represents mean ± SEM for six wells (duplicate measurements per well). Values not sharing a common letter are significantly different at P < 0.05 (Tukey test)
Fig. 5
Fig. 5
Effects of allopurinol and quercetin on serum uric acid levels in hyperuricemic mice. The mice were orally administered with allopurinol or quercetin at the different doses indicated. The mice were then intraperitoneally injected with both IMP and GMP (400 mg each/kg body weight) to induce hyperuricemia. Normal control and model control groups were treated with vehicles instead of test samples and nucleotides, respectively. Each value represents mean ± SEM for eight to twelve mice (duplicate measurements per mouse) *significantly different from the model control groups at P < 0.05 (Dunnet test)

References

    1. Bardin T, Richette P. Definition of hyperuricemia and gouty conditions. Curr Opin Rheumatol. 2014;26:186–191. doi: 10.1097/BOR.0000000000000028. - DOI - PubMed
    1. Becker MA, Schumacher HR, Jr, Wortmann RL, MacDonald PA, Eustace D, Palo WA, Streit J, Joseph-Ridge N. Febuxostat compared with allopurinol in patients with hyperuricemia and gout. N Engl J Med. 2005;353:2450–2461. doi: 10.1056/NEJMoa050373. - DOI - PubMed
    1. Choi HK, Atkinson K, Karlson EW, Willett W, Curhan G. Purine-rich foods, daily and protein intake, and the risk of gout in men. N Engl J Med. 2004;350:1093–1103. doi: 10.1056/NEJMoa035700. - DOI - PubMed
    1. Choi HK, Mount DB, Reginato AM. Pathogenesis of gout. Ann Intern Med. 2005;143:499–516. doi: 10.7326/0003-4819-143-7-200510040-00009. - DOI - PubMed
    1. Ishikawa T, Aw W, Kaneko K. Metabolic interactions of purine derivatives with human ABC transporter ABCG2: genetic testing to assess gout risk. Pharmaceuticals (Basel) 2013;6:1347–1360. doi: 10.3390/ph6111347. - DOI - PMC - PubMed

LinkOut - more resources