. 2016 Aug 11;166(4):950-962.
doi: 10.1016/j.cell.2016.07.005.

Dual Chromatin and Cytoskeletal Remodeling by SETD2

Affiliations

Dual Chromatin and Cytoskeletal Remodeling by SETD2

In Young Park et al. Cell. .

Abstract

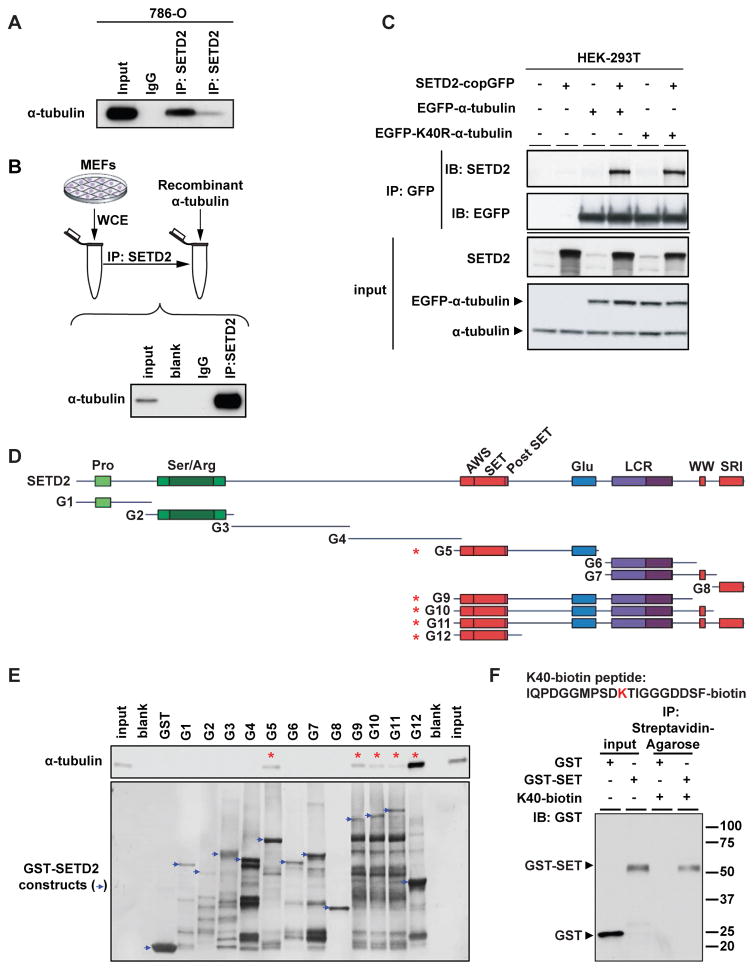
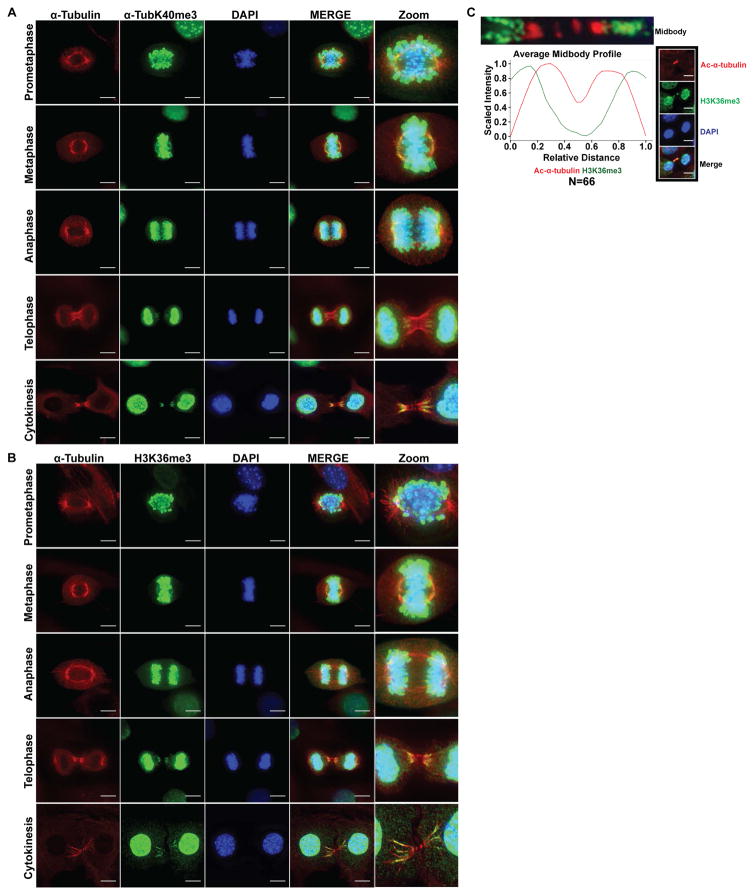
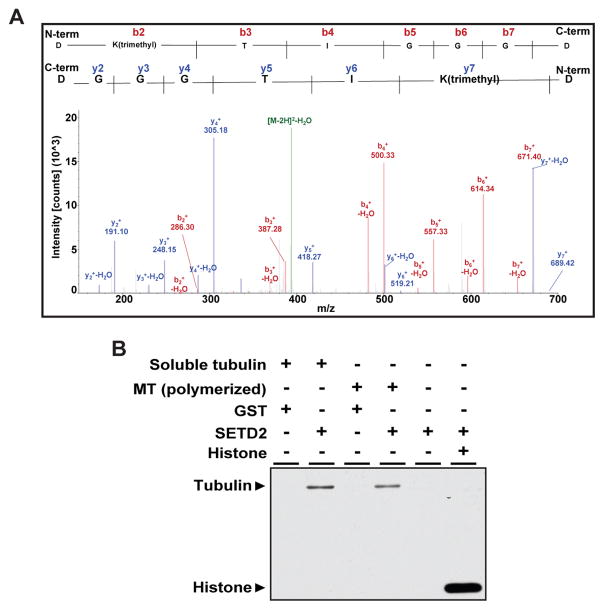
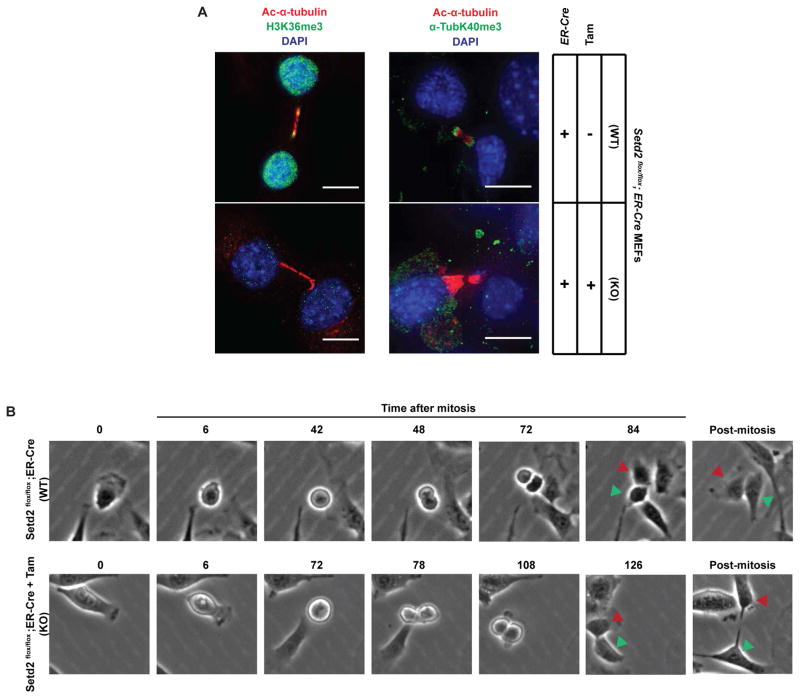
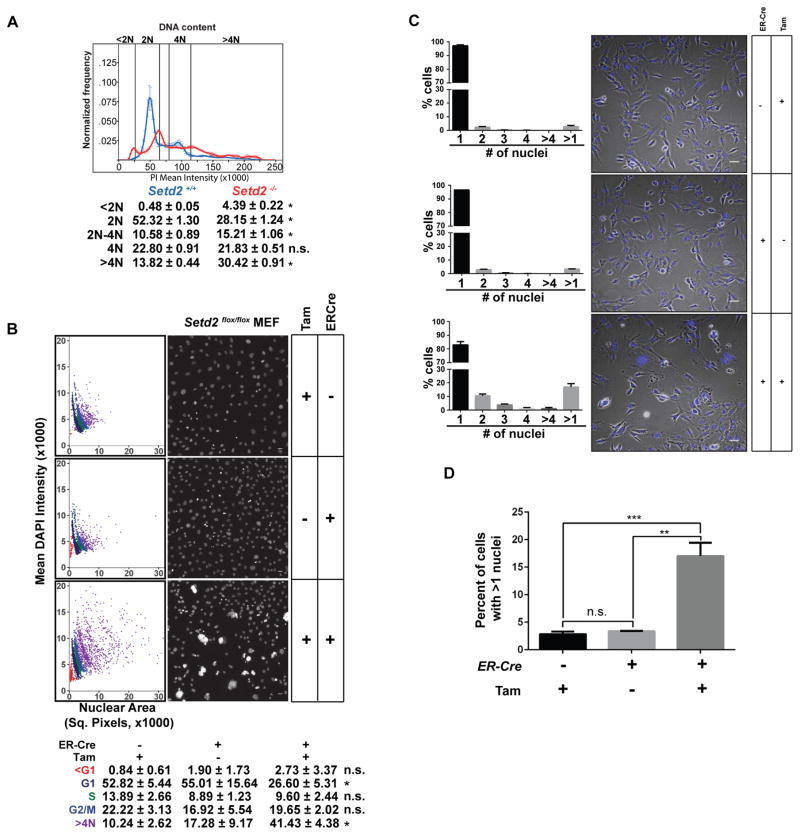
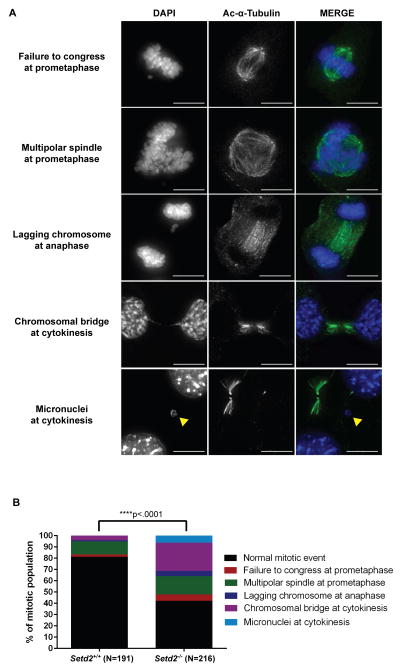
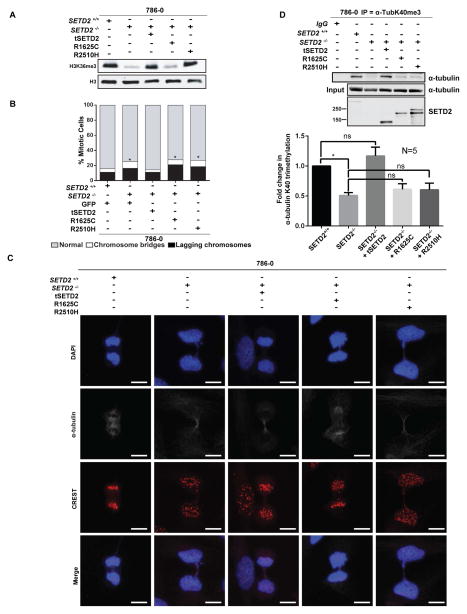
Posttranslational modifications (PTMs) of tubulin specify microtubules for specialized cellular functions and comprise what is termed a "tubulin code." PTMs of histones comprise an analogous "histone code," although the "readers, writers, and erasers" of the cytoskeleton and epigenome have heretofore been distinct. We show that methylation is a PTM of dynamic microtubules and that the histone methyltransferase SET-domain-containing 2 (SETD2), which is responsible for H3 lysine 36 trimethylation (H3K36me3) of histones, also methylates α-tubulin at lysine 40, the same lysine that is marked by acetylation on microtubules. Methylation of microtubules occurs during mitosis and cytokinesis and can be ablated by SETD2 deletion, which causes mitotic spindle and cytokinesis defects, micronuclei, and polyploidy. These data now identify SETD2 as a dual-function methyltransferase for both chromatin and the cytoskeleton and show a requirement for methylation in maintenance of genomic stability and the integrity of both the tubulin and histone codes.


Figures

Figure 1
Figure 1. SETD2 binds α-tubulin
(A) Co-immunoprecipitation of endogenous α-tubulin and SETD2 from 786-0 cells with two different SETD2 antibodies (Sigma-Aldrich and Abcam). (B) Co-immunoprecipitation of immunopurified SETD2 from MEFs using SETD2 antibody and recombinant α-tubulin. Input - recombinant α-tubulin, 10ng. (C) Co-immunoprecipitation of exogenous SETD2 and α-tubulin from HEK-293T cells co-expressing SETD2, and EGFP-α-tubulin or EGFP-K40R-α-tubulin. (D) Schematic of GST-SETD2 fusion protein constructs. (E) GST pull down assays of α-tubulin with the GST-SETD2 fusion constructs incubated with 1μg of recombinant α-tubulin (TUBA1A) protein and immunoblotted using α-tubulin antibody (upper panel). GST-SETD2 construct expression assessed using Coomassie blue staining (lower panel). (F) Peptide pull down using biotin-labeled K40 peptide of α-tubulin with the G12 or GST only constructs. Input 50ng.
Figure 2
Figure 2. Microtubule methylation during mitosis and cytokinesis in MEFs
(A) Representative images of cells stained using α-tubulin (red) and α-TubK40me3 (green) antibodies, counterstained with DAPI (blue). The far right panel (Zoom) indicates higher magnification images for better visualization. Scale bar =10μm. (B) Representative images of cells stained using α-tubulin (red) and H3K36me3 (green) antibodies, counterstained with DAPI (blue). The far right panel (Zoom) indicates higher magnification images for better visualization. Scale bar =10μm. (C) Quantitative analysis of average fluorescent intensities of midbodies immunostained with H3K36me3 (green curve) and acetylated α-tubulin (red curve) antibodies (N = 66 midbodies, from 3 independent experiments). Representative image showing H3K36me3 (green), acetylated α-tubulin (red) and DAPI (blue). Scale bar =10μm. See also Figure S2 and S3.
Figure 3
Figure 3. SETD2 methylates lysine 40 of α-tubulin
(A) Mass spectrometry analysis showing trimethylation at K40 on α-tubulin from HEK-293T cells. Expected molecular weights of trimethylated peptides from the N-terminus and C-terminus are shown as peaks in red and blue, respectively. (B) In vitro methylation of bovine microtubule proteins using recombinant SETD2 and S-[methyl-3H]-Adenosyl-L-Methionine (SAM) as a methyl donor. See also Figure S4.
Figure 4
Figure 4. Loss of methylation on midbody and mitosis delay caused by Setd2 ablation
(A) Representative cell images of Setd2+/+ and Setd2−/− cells using H3K36me3 or α-TubK40me3 (green), and acetylated α-tubulin (red) antibodies, counterstained with DAPI (blue). Scale bar =10μm. Note that pre-warming the PFA to 37°C significantly reduced cross reactivity of the α-TubK40me3 antibody with chromatin while retaining recognition of the α-TubK40me3 epitope on microtubules, as described in Experimental Procedures. (B) Live cell images of Setd2+/+ and Setd2/ cells undergoing mitosis and cytokinesis. Red and green arrowheads denote corresponding cells tracked during cell division. See also Figure S4.
Figure 5
Figure 5. Loss of Setd2 induces polyploidy
(A) FACS analysis of Setd2/ cells (red) and Setd2+/+ controls (blue). Error bars represent the mean and standard deviations of 4 biological replicates. *p<0.0001, n.s. = not significant. (B) Scatterplot of DNA content in Setd2 knockout (KO) MEFs with two control cells; Setd2flox/flox MEFs treated with 4-hydroxytamoxifen (genetic control) and ER-Cre transfected Setd2flox/flox MEFs treated with vehicle (ethanol) (pharmacologic control). Statistics comparing Setd2 KO to pharmacological control, *p<0.05. Scale bar=25μm, N=3. (C) Number of nuclei in Setd2 KO and with control MEFs. Cells were stained with DAPI and the nuclear content of ~1500 cells (~500 cells in three independent experiments) was counted manually from multiple confocal images. Scale bar=50μm. N=3. (D) Percentage of cells (from Figure 5C) with more than 1 nucleus. **p=0.0012, ***p=0.0009. Error bars represent standard error of the mean. See also Figure S5.
Figure 6
Figure 6. Mitotic and cytokinesis defects induced by loss of Setd2
(A) Representative images of mitotic and cytokinesis defects in Setd2 KO MEFs using an acetylated α-tubulin (green) antibody and counterstained with DAPI (blue). Scale bar=10μm. (B) Quantitation of abnormal mitotic events in Setd2+/+ control and Setd2/ cells. N=number of dividing cells counted. ****p<0.0001. See also Figure S6.
Figure 7
Figure 7. SETD2 SRI mutant rescues histone methylation but not tubulin methylation or mitotic defects
(A) Western blot analyses using histone extracts from parental 786-0 cells, SETD2-null 786-0 cells or SETD2-null 786-0 cells expressing tSETD2 (truncated SETD2 with intact methylation activity), R1625C mutant (SET domain mutant), or R2510H (SRI domain mutant). (B) Mitotic defects including chromosome bridges (white) and lagging chromosomes (black) quantitated for cells from three technical replicates, in each of two biologically independent experiments for a total of 200 cells for each condition.*p<0.0001. (C) Representative images of cells stained using α-tubulin (grey), centromere (CREST, red) antibodies and DAPI (blue). Scale bar =10μm. (D) Immunoprecipitation of cytoplasmic fraction using lysates from (A) with the α-TubK40me3 antibody and immunoblotted using a α-tubulin antibody. In the immunoblot using SETD2 antibody, the tSETD2-2A-GFP fusion protein was autocleaved to tSETD2 and GFP by self-cleaving 2A peptide after translation. The amounts of α-tubulin K40 trimethylation were quantitated by analyzing band intensities in five independent experiments (N=5). *p<0.05, error bars denote standard error of the mean. See also Figure S7.

Comment in

References

    1. Agromayor M, Martin-Serrano J. Knowing when to cut and run: mechanisms that control cytokinetic abscission. Trends in cell biology. 2013;23:433–441. - PubMed
    1. Alexandrov LB, Nik-Zainal S, Wedge DC, Aparicio SA, Behjati S, Biankin AV, Bignell GR, Bolli N, Borg A, Borresen-Dale AL, et al. Signatures of mutational processes in human cancer. Nature. 2013;500:415–421. - PMC - PubMed
    1. Aymard F, Bugler B, Schmidt CK, Guillou E, Caron P, Briois S, Iacovoni JS, Daburon V, Miller KM, Jackson SP, et al. Transcriptionally active chromatin recruits homologous recombination at DNA double-strand breaks. Nature structural & molecular biology. 2014;21:366–374. - PMC - PubMed
    1. Barisic M, Silva e Sousa R, Tripathy SK, Magiera MM, Zaytsev AV, Pereira AL, Janke C, Grishchuk EL, Maiato H. Mitosis. Microtubule detyrosination guides chromosomes during mitosis. Science. 2015;348:799–803. - PMC - PubMed
    1. Bi M, Zhao S, Said JW, Merino MJ, Adeniran AJ, Xie Z, Nawaf CB, Choi J, Belldegrun AS, Pantuck AJ, et al. Genomic characterization of sarcomatoid transformation in clear cell renal cell carcinoma. Proceedings of the National Academy of Sciences of the United States of America. 2016;113:2170–2175. - PMC - PubMed

Publication types