. 2016 Aug 4;375(5):411-421.
doi: 10.1056/NEJMoa1508749.

Innate Immunity and Asthma Risk in Amish and Hutterite Farm Children

Affiliations

Innate Immunity and Asthma Risk in Amish and Hutterite Farm Children

Michelle M Stein et al. N Engl J Med. .

Abstract

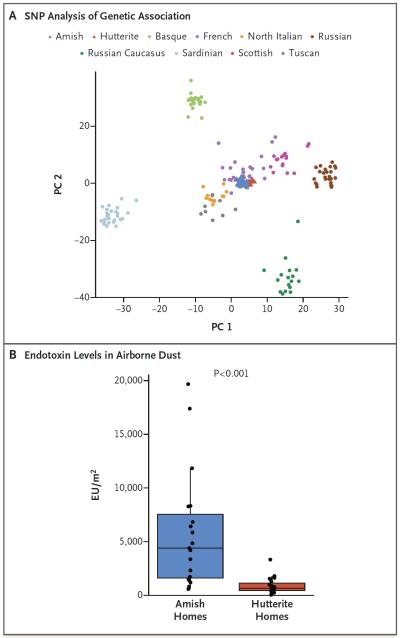
Background: The Amish and Hutterites are U.S. agricultural populations whose lifestyles are remarkably similar in many respects but whose farming practices, in particular, are distinct; the former follow traditional farming practices whereas the latter use industrialized farming practices. The populations also show striking disparities in the prevalence of asthma, and little is known about the immune responses underlying these disparities.

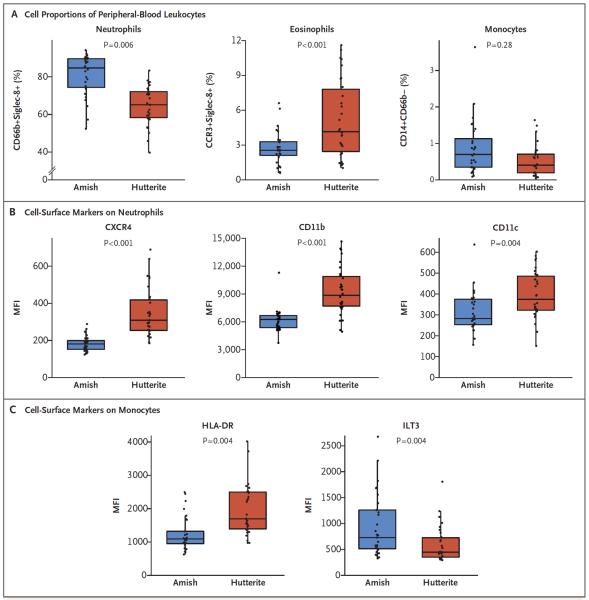
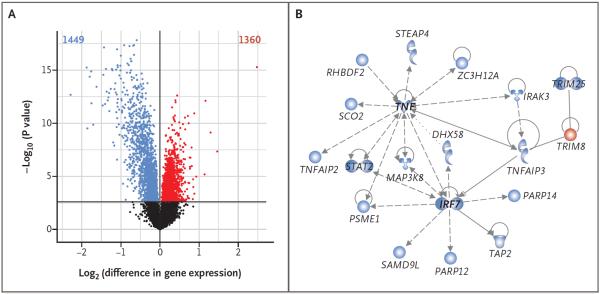
Methods: We studied environmental exposures, genetic ancestry, and immune profiles among 60 Amish and Hutterite children, measuring levels of allergens and endotoxins and assessing the microbiome composition of indoor dust samples. Whole blood was collected to measure serum IgE levels, cytokine responses, and gene expression, and peripheral-blood leukocytes were phenotyped with flow cytometry. The effects of dust extracts obtained from Amish and Hutterite homes on immune and airway responses were assessed in a murine model of experimental allergic asthma.

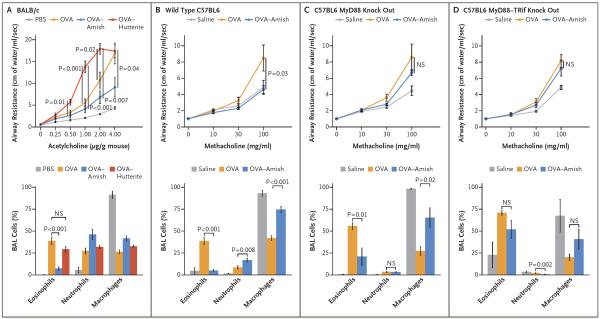
Results: Despite the similar genetic ancestries and lifestyles of Amish and Hutterite children, the prevalence of asthma and allergic sensitization was 4 and 6 times as low in the Amish, whereas median endotoxin levels in Amish house dust was 6.8 times as high. Differences in microbial composition were also observed in dust samples from Amish and Hutterite homes. Profound differences in the proportions, phenotypes, and functions of innate immune cells were also found between the two groups of children. In a mouse model of experimental allergic asthma, the intranasal instillation of dust extracts from Amish but not Hutterite homes significantly inhibited airway hyperreactivity and eosinophilia. These protective effects were abrogated in mice that were deficient in MyD88 and Trif, molecules that are critical in innate immune signaling.

Conclusions: The results of our studies in humans and mice indicate that the Amish environment provides protection against asthma by engaging and shaping the innate immune response. (Funded by the National Institutes of Health and others.).


Figures

Figure 1
Figure 1. Ancestries and Environments of Amish and Hutterite Children
Panel A shows a principal components plot of the first two principal components (PC 1 and PC 2) of the analysis of 72,034 single-nucleotide polymorphisms (SNPs). Amish and Hutterite genotypes were projected onto the sample space created by Human Genome Diversity Project (HGDP) for European populations. Panel B shows endotoxin levels in airborne dust from 10 Amish and 10 Hutterite homes. Box-and-whisker plots show a horizontal line indicating median value, a box representing the interquartile range, and whiskers showing the 95% confidence interval. The P value was calculated with the use of the Wilcoxon rank-sum test. EU denotes endotoxin units.
Figure 2
Figure 2. Proportions of Peripheral-Blood Leukocytes and Cell-Surface–Marker Phenotypes in Amish and Hutterite Children
The percentages of total peripheral-blood leukocytes (Panel A) were determined with flow cytometry for neutrophils (defined as CD66b+Siglec-8+), eosinophils (defined as CCR3+Siglec-8+), and monocytes (defined as CD14+CD66b−). Box-and-whisker plots show a line indicating median value, with the box showing the interquartile range and whiskers showing the 95% confidence interval. Neutrophils (Panel B) were characterized according to the surface expression of CXCR4, CD11b, and CD11c (shown here), along with CXCR1 and CXCR2, expressed as mean fluorescence intensity (MFI). The expression of the interleukin-8 coreceptors CXCR1 and CXCR2 was not significantly different between groups (P = 0.26 and P = 0.91, respectively). Monocytes (Panel C) were characterized for the surface expression of HLA-DR and immunoglobulin-like transcripts (ILTs), including ILT3 (shown here). There was no significant difference in the MFI of inhibitory receptors ILT2 and ILT4 between Amish and Hutterite children (P = 0.69 and P = 0.21, respectively; data not shown), whereas the surface expression of ILT5 was increased on Amish monocytes (P = 0.001; data not shown). All P values were calculated with the use of an unpaired Student's t-test. Cell proportions and phenotypes after the exclusion of children with asthma or allergic sensitization are shown in Table S4 in the Supplementary Appendix.
Figure 3
Figure 3. Gene-Expression Profiles in Peripheral-Blood Leukocytes from Amish and Hutterite Children
In Panel A, a volcano plot shows differences in baseline gene expression in peripheral-blood leukocytes from Amish and Hutterite children. The x axis indicates the log2 differences in gene-expression level between groups, with larger positive values representing genes with higher expression in the Hutterites relative to the Amish (1360 genes, shown in red points) and larger negative values representing genes with higher expression in the Amish relative to the Hutterites (1449 genes, shown in blue points). The y axis shows the −log10 of the P values for each gene, with larger values indicating greater statistical significance. The solid horizontal line indicates the 1% false discovery rate. Black points represent genes from Amish and Hutterite cells for which there was no significant difference in gene expression. Differences in gene expression remain after the data for children with asthma or allergic sensitization were excluded (Figs. S6 and S7 in the Supplementary Appendix). Changes in gene expression between the two groups after correcting for differences in cell proportion are shown in Figure S4 in the Supplementary Appendix. In Panel B, a network of differentially expressed genes in untreated peripheral-blood leukocytes is shown. Genes shown in blue have increased expression in Amish children, and the gene shown in red has increased expression in Hutterite children. The gene shapes indicate the class of each gene's protein product (spirals denote enzymes, a v-shape denotes cytokines, conjoined circles denote a transcription regulator, hollow upside-down triangles denote kinases, cups denote transporters, and circles denote other products). Lines represent different biologic relationships (solid lines indicate direct interaction, dashed lines indirect interaction, arrows direction of activation, arrows with a horizontal line direction of activation and inhibition, and lines without arrows binding only).
Figure 4
Figure 4. Effects of Amish and Hutterite House-Dust Extracts on Airway Responses in Mouse Models of Allergic Asthma
Panel A shows the effects of the intranasal instillation of 50 μl of Amish or Hutterite dust extract in 7-week-old mice (BALB/c strain) every 2 to 3 days for a total of 14 times beginning at day 0. The mice were sensitized with ovalbumin (OVA) intraperitoneally on days 0 and 14 and challenged with ovalbumin intranasally on days 28 and 38. Airway resistance (shown as centimeters of water per milliliter per second and stimulated in response to increasing doses of acetylcholine administered intravenously) and bronchoalveolar-lavage (BAL) cellularity were measured on day 39 (4 to 6 mice per group). The total amount of Amish and Hutterite dust extract administered over the course of the experiment represented the total load of airborne dust deposited on electrostatic dust collectors placed in Amish or Hutterite homes for 1 month. Statistical differences in experimental measures were assessed with the use of Student's t-test. Amish house-dust extracts (7.5 mg of dust equivalent in 50 μl) were instilled intranasally every 2 to 3 days for a total of 14 times beginning 5 days before day 0 into 7-week old wild-type mice (Panel B), mice deficient in MyD88 (Panel C), and mice deficient in MyD88 and Trif (Panel D) (all C57BL6 strains). These mice were sensitized intraperitoneally with 20 μg of ovalbumin on days 0 and 14 and were challenged intranasally with 75 μg of ovalbumin on days 26, 27, and 28. Airway resistance (shown as an increase from baseline in response to increasing doses of nebulized methacholine) and bronchoalveolar-lavage cellularity were measured on day 30 (12 mice per group for wild-type mice and 6 mice per group for those deficient in MyD88 or MyD88 and Trif). Statistical differences in experimental measures were assessed with the use of Student's t-test. I bars represent the standard errors of the data. NS denotes not significant and PBS phosphate-buffered saline.

Comment in

References

    1. Ober C, Yao TC. The genetics of asthma and allergic disease: a 21st century perspective. Immunol Rev. 2011;242:10–30. - PMC - PubMed
    1. Meyers DA, Bleecker ER, Holloway JW, Holgate ST. Asthma genetics and personalised medicine. Lancet Respir Med. 2014;2:405–15. - PMC - PubMed
    1. Bach JF. The effect of infections on susceptibility to autoimmune and allergic diseases. N Engl J Med. 2002;347:911–20. - PubMed
    1. Braun-Fahrländer C, Riedler J, Herz U, et al. Environmental exposure to endotoxin and its relation to asthma in school-age children. N Engl J Med. 2002;347:869–77. - PubMed
    1. Ege MJ, Mayer M, Normand AC, et al. Exposure to environmental microorganisms and childhood asthma. N Engl J Med. 2011;364:701–9. - PubMed

Publication types

MeSH terms