Comparative Study
. 2016 Aug 12;11(8):e0161201.
doi: 10.1371/journal.pone.0161201. eCollection 2016.

Hyperglycemia Determines Increased Specific MicroRNAs Levels in Sera and HDL of Acute Coronary Syndrome Patients and Stimulates MicroRNAs Production in Human Macrophages

Affiliations
Comparative Study

Hyperglycemia Determines Increased Specific MicroRNAs Levels in Sera and HDL of Acute Coronary Syndrome Patients and Stimulates MicroRNAs Production in Human Macrophages

Natalia Simionescu et al. PLoS One. .

Abstract

We aimed to determine the levels of microRNAs (miRNAs) in sera and HDL of acute coronary syndrome (ACS) compared to stable angina (SA) patients with/without hyperglycemia, and evaluate comparatively the functional effect of these sera on the processing machinery proteins (Drosha, DGCR8, Dicer) and miRNAs production in human macrophages. MiRNAs levels in sera and HDL from 35 SA and 72 ACS patients and 30 healthy subjects were measured by using microRNA TaqMan assays. MiR-223, miR-92a, miR-486, miR-122, miR-125a and miR-146a levels were higher in the hyperglycemic ACS compared to normoglycemic sera. MiR-223 and miR-486 prevailed in HDL2, while miR-92a predominated in HDL3, all three miRNAs discriminating between ACS and SA patients; their levels were increased in HDL from hyperglycemic ACS patients versus normoglycemic ones. The incubation of human macrophages with sera from ACS and SA patients showed that all patients' sera induced an increase of Drosha, DGCR8 and Dicer expressions and of selected miRNAs levels compared to control sera, the effect being higher in the case of hyperglycemic versus normoglycemic ACS sera. The addition of glucose to SA and ACS sera increased Drosha, DGCR8 and Dicer expression and miRNAs levels in the exposed macrophages. In conclusion, hyperglycemia is associated with increased miR-223, miR-92a, miR-486 levels in HDL, which discriminate between ACS and SA patients. Exposure of human macrophages to ACS compared to SA sera determines the upregulation of Drosha, DGCR8 and Dicer expression and the increase of selected miRNAs production, the effect being augmented by an increased glucose concentration.


Conflict of interest statement

Competing Interests: The authors have declared that no competing interests exist.

Figures

Fig 1
Fig 1. Boxplot distribution of the investigated miRNAs in sera.
Levels of miR-223 (A), miR-92a (B), miR-486 (C), miR-122 (D), miR-125a (E), miR-146a (F) in sera from Control subjects and coronary artery disease (CAD) patients with stable angina (SA) or acute coronary syndrome (ACS), with/without hyperglycemia. Data are expressed as log-transformed 2-ΔCq values, multiplied by 106 ± standard error of the mean (** p<0.01, *** p<0.001 hyperglycemic (HG) vs. normoglycemic (NG), ### p<0.001 SA or ACS vs. Control, Student T-test).
Fig 2
Fig 2
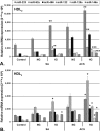
Distribution of analyzed miRNAs in HDL subfractions: HDL2 (A) and HDL3 (B) isolated by density gradient ultracentrifugation from pooled sera obtained from coronary artery disease (CAD) patients with stable angina (SA) and acute coronary syndrome (ACS), with/without hyperglycemia; the procedure was performed on 3 pools of sera from each group. Data are expressed as mean 2-ΔCq values multiplied by 106 ± standard error of the mean (* p<0.05, ** p<0.01, *** p<0.001 hyperglycemic (HG) vs. normoglycemic (NG), Student T-test).
Fig 3
Fig 3
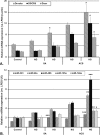
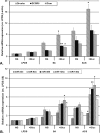
Expression of Drosha, DGCR8 and Dicer mRNA (A) and of selected miRNAs (B) in human macrophages incubated with sera from CAD patients with stable angina (SA) or acute coronary syndrome (ACS), with/without hyperglycemia. The expression level of each gene of interest was determined relative to β-actin, while the expression level of each miRNA was determined relative to snRNU6. Data are expressed as mean 2-ΔΔCq values ± standard error of the mean. LPDS = human lipoprotein-deficient serum (* p<0.05, ** p<0.01, *** p<0.001 hyperglycemic (HG) vs. normoglycemic (NG), Student T-test).
Fig 4
Fig 4
Expression of Drosha, DGCR8 and Dicer mRNA (A) and of selected miRNAs (B) in human macrophages incubated with normoglycemic CAD patients’ sera with stable angina (SA) or acute coronary syndrome (ACS), with/without added glucose. The expression level of each gene of interest was determined relative to β-actin, while the expression level of each miRNA was determined relative to snRNU6. Data are expressed as mean 2-ΔΔCq values ± standard error of the mean. +Gluc = 5.5 mM (100 mg/dl) added glucose; LPDS = human lipoprotein-deficient serum (*p<0.05, **p<0.01 +Gluc vs. normoglycemic (NG), Student T-test).

References

    1. Bartel DP. MicroRNAs: genomics, biogenesis, mechanism, and function. Cell. 2004;116(2):281–97. Epub 2004/01/28. 10.1016/S0092-8674(04)00045-5 . - DOI - PubMed
    1. Ono K, Kuwabara Y, Han J. MicroRNAs and cardiovascular diseases. FEBS J. 2011;278(10):1619–33. Epub 2011/03/15. 10.1111/j.1742-4658.2011.08090.x - DOI - PMC - PubMed
    1. Davis BN, Hata A. Regulation of MicroRNA Biogenesis: A miRiad of mechanisms. Cell communication and signaling: CCS. 2009;7:18 10.1186/1478-811X-7-18 - DOI - PMC - PubMed
    1. Lee Y, Ahn C, Han J, Choi H, Kim J, Yim J, et al. The nuclear RNase III Drosha initiates microRNA processing. Nature. 2003;425(6956):415–9. 10.1038/nature01957 . - DOI - PubMed
    1. Denli AM, Tops BB, Plasterk RH, Ketting RF, Hannon GJ. Processing of primary microRNAs by the Microprocessor complex. Nature. 2004;432(7014):231–5. 10.1038/nature03049 . - DOI - PubMed

Publication types

MeSH terms