

Method for single illumination source combined optical coherence tomography and fluorescence imaging of fluorescently labeled ocular structures in transgenic mice
- PMID: 27519152
- PMCID: PMC5072542
- DOI: 10.1016/j.exer.2016.08.003
Method for single illumination source combined optical coherence tomography and fluorescence imaging of fluorescently labeled ocular structures in transgenic mice
Abstract
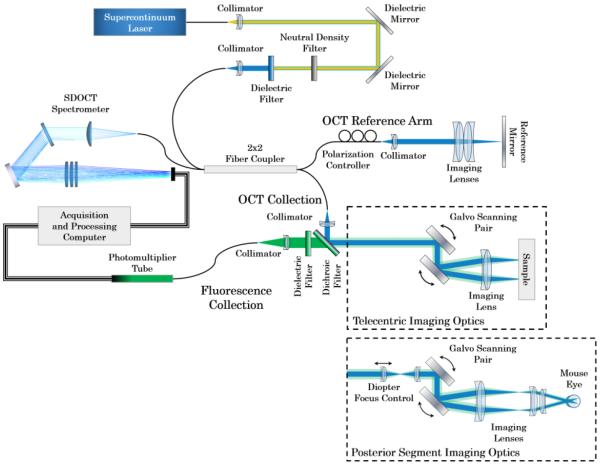
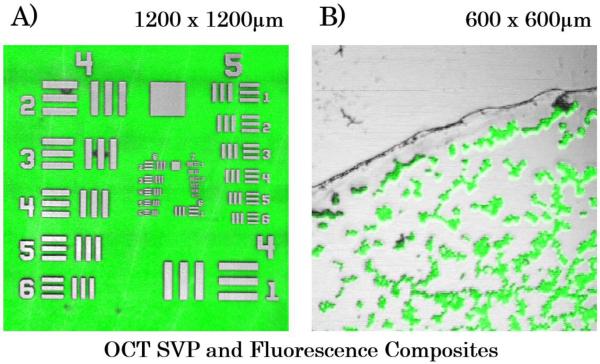
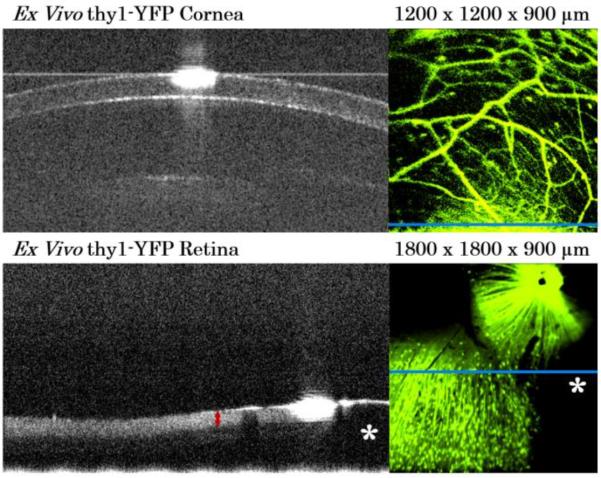
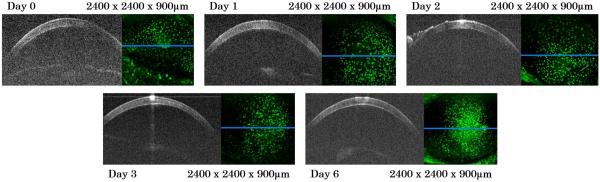
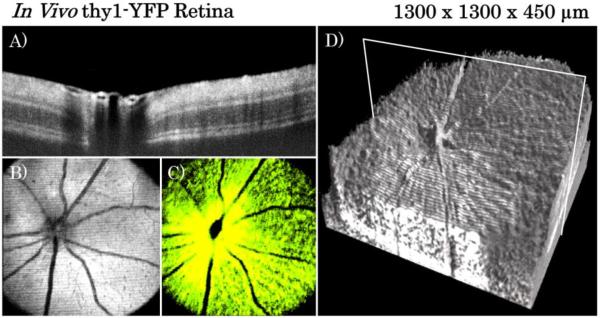
In vivo imaging permits longitudinal study of ocular disease processes in the same animal over time. Two different in vivo optical imaging modalities - optical coherence tomography (OCT) and fluorescence - provide important structural and cellular data respectively about disease processes. In this Methods in Eye Research article, we describe and demonstrate the combination of these two modalities producing a truly simultaneous OCT and fluorescence imaging system for imaging of fluorescently labeled animal models. This system uses only a single light source to illuminate both modalities, and both share the same field of view. This allows simultaneous acquisition of OCT and fluorescence images, and the benefits of both techniques are realized without incurring increased costs in variability, light exposure, time, and post-processing effort as would occur when the modalities are used separately. We then utilized this system to demonstrate multi-modal imaging in a progression of samples exhibiting both fluorescence and OCT scattering beginning with resolution targets, ex vivo thy1-YFP labeled neurons in mouse eyes, and finally an in vivo longitudinal time course of GFP labeled myeloid cells in a mouse model of ocular allergy.
Keywords: Animal; Cornea; Fluorescence; GFP; OCT; Optical coherence tomography; Retina; YFP.
Copyright © 2016 Elsevier Ltd. All rights reserved.
Figures
References
-
- Higashide T, Kawaguchi I, Ohkubo S, Takeda H, Sugiyama K. In Vivo Imaging and Counting of Rat Retinal Ganglion Cells Using a Scanning Laser Ophthalmoscope. Investigative Ophthalmology & Visual Science. 2006;47:2943–2950. - PubMed
-
- Leung CKS, Lindsey JD, Crowston JG, Ju W-K, Liu Q, Bartsch D-U, Weinreb RN. In vivo imaging of murine retinal ganglion cells. Journal of Neuroscience Methods. 2008;168:475–478. - PubMed
-
- Schuman JS, Hee MR, Arya AV, Pedut-Kloizman T, Puliafito CA, Fujimoto JG, Swanson EA. Optical coherence tomography: A new tool for glaucoma diagnosis. Current Opinion in Ophthalmology. 1995;6:89–95. - PubMed
Publication types
MeSH terms
Grants and funding
LinkOut - more resources
Full Text Sources
Other Literature Sources
Medical
Miscellaneous
