. 2016 Aug 12;17(1):628.
doi: 10.1186/s12864-016-2865-1.

Regulatory complexity revealed by integrated cytological and RNA-seq analyses of meiotic substages in mouse spermatocytes

Affiliations

Regulatory complexity revealed by integrated cytological and RNA-seq analyses of meiotic substages in mouse spermatocytes

Robyn L Ball et al. BMC Genomics. .

Abstract

Background: The continuous and non-synchronous nature of postnatal male germ-cell development has impeded stage-specific resolution of molecular events of mammalian meiotic prophase in the testis. Here the juvenile onset of spermatogenesis in mice is analyzed by combining cytological and transcriptomic data in a novel computational analysis that allows decomposition of the transcriptional programs of spermatogonia and meiotic prophase substages.

Results: Germ cells from testes of individual mice were obtained at two-day intervals from 8 to 18 days post-partum (dpp), prepared as surface-spread chromatin and immunolabeled for meiotic stage-specific protein markers (STRA8, SYCP3, phosphorylated H2AFX, and HISTH1T). Eight stages were discriminated cytologically by combinatorial antibody labeling, and RNA-seq was performed on the same samples. Independent principal component analyses of cytological and transcriptomic data yielded similar patterns for both data types, providing strong evidence for substage-specific gene expression signatures. A novel permutation-based maximum covariance analysis (PMCA) was developed to map co-expressed transcripts to one or more of the eight meiotic prophase substages, thereby linking distinct molecular programs to cytologically defined cell states. Expression of meiosis-specific genes is not substage-limited, suggesting regulation of substage transitions at other levels.

Conclusions: This integrated analysis provides a general method for resolving complex cell populations. Here it revealed not only features of meiotic substage-specific gene expression, but also a network of substage-specific transcription factors and relationships to potential target genes.

Keywords: Maximum covariance analysis; Meiosis; Mouse; RNA-seq; Spermatogenesis; Transcriptome.


Figures
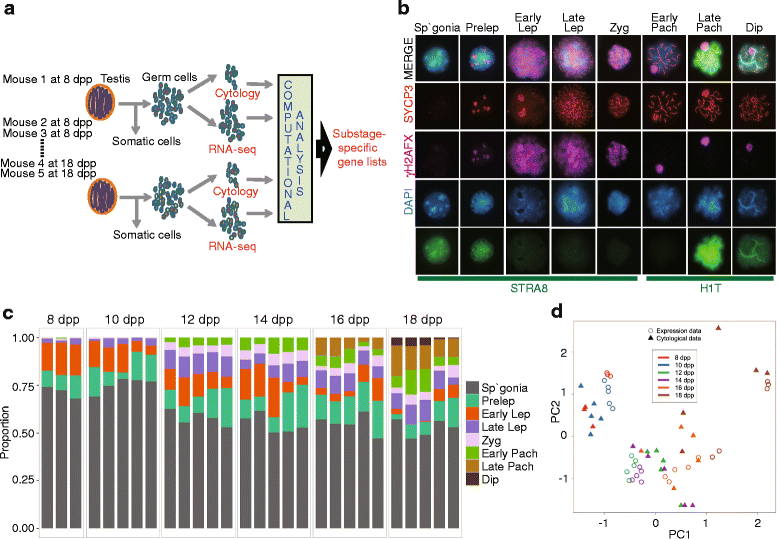
Fig. 1
Fig. 1
Decomposition of meiotic cells and gene expression. a Experimental design. Germ cells were isolated from whole testes from each of five juvenile male mice at 8, 10, 12, 14, 16 and 18 dpp. Each sample was analyzed for both cytology and gene expression by RNA-seq. PMCA was developed to identify the meiotic substage-specific transcriptomes. b Cytological classification and cellular populations. Isolated germ cells were immunolabeled for stage-specific maker proteins: STRA8, expressed in differentiating spermatogonia; SYCP3, a component of synaptonemal complex shows meiotic substage-specific labeling morphology; phosphorylated histone H2AFX (γH2AFX), marking DSBs throughout early prophase nuclei and restricted to the XY chromosomes during pachynema and diplonema; and histone HISTH1T, expressed in post-mid-pachytene spermatocytes. Nuclei were counter-stained with DAPI. c Meiotic cell composition during the first wave of spermatogenesis. The contribution by specific germ-cell stages for each developmental time point and mouse is shown, with colors representing specific meiotic substages. Abbreviations: Sp’gonia = spermatogonia, Prelep = pre-leptonema, Early Lep = early leptonema, Lep = leptonema, Late Lep = late leptonema, Zyg = zygonema, Early Pach = early pachynema, Late Pach = late pachynema, Dip = diplonema. d Concordance of expression and cytological data. Principal component 1 (PC1) versus principal component 2 (PC2) from independent PCA of cytological and RNA-seq data. Colors correspond to time points and icon shape corresponds to data type as indicated
Fig. 2
Fig. 2
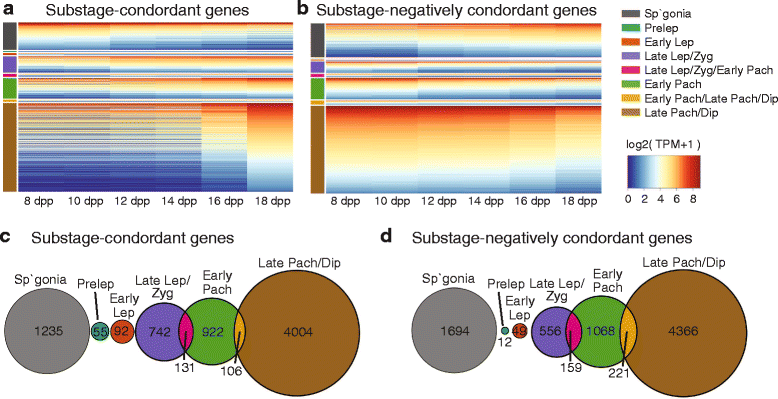
Expression of substage- concordant and negatively concordant genes. a Heat maps show gene expression of substage-concordant genes at each time point. b Heat maps show gene expression of substage-negatively concordant genes at each time point. Color bars on the left side of the heat maps represent meiotic substages (Abbreviations: Sp’gonia = spermatogonia, Pre Lep = pre-leptonema, Early Lep = early leptonema, Lep = leptonema, Late Lep = late leptonema, Zyg = zygonema, Early Pach = early pachynema, Late Pach = late pachynema, Dip = diplonema). Gene expression is shown as average log2(TPM + 1) over time point replicates. c Overlap among substage-concordant gene lists, illustrating the number of transcripts in common between each pair of lists. d Overlap among substage-negatively concordant gene lists, illustrating the number of transcripts in common between each pair of lists
Fig. 3
Fig. 3
X-linked gene expression during the first wave of spermatogenesis. a Boxplots of the difference from mean gene expression at 8 dpp are shown for each time point, with genes on the autosomes in purple and those on the XY chromosomes in green. Gene expression is log2(TPM + 1). b Heatmap of X-linked gene expression at each time point. Genes are clustered based on the pattern of expression: an increase of expression at 12 dpp and then stable throughout (Stable), steadily decreasing over time (Decreasing), or low expression from 8-10 dpp and high expression from 12-14 dpp followed by low expression at 16-18 dpp (Transient). Gene expression is shown as average log2(TPM + 1) over time-point replicates
Fig. 4
Fig. 4
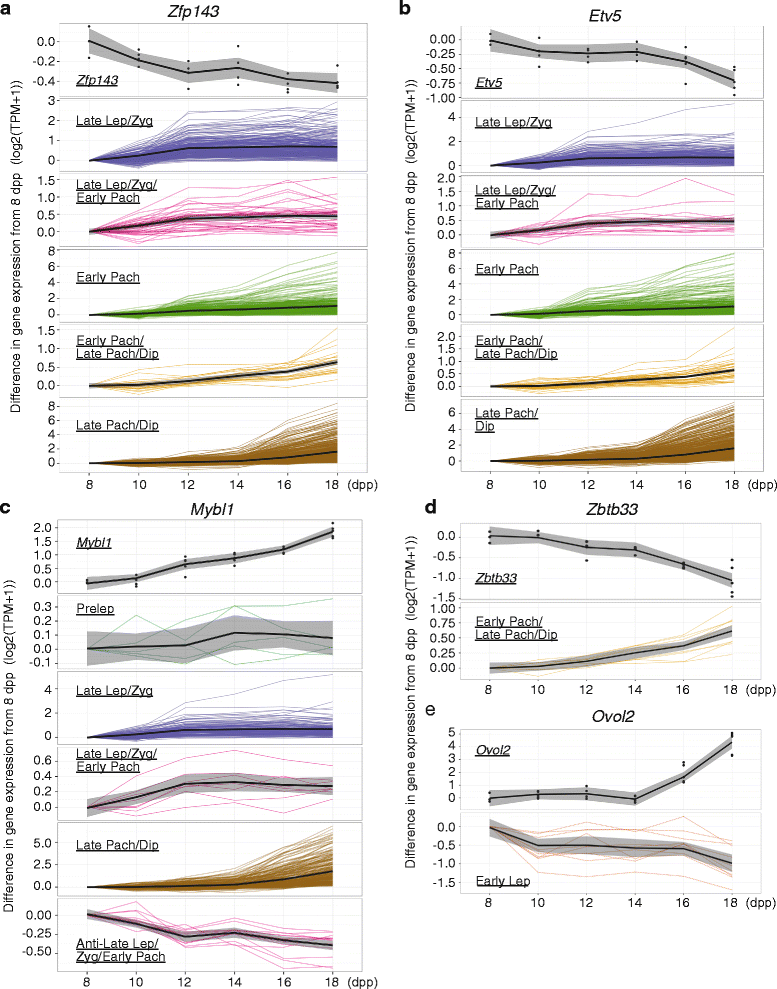
Expression of TFs and target genes for each substage. The difference from mean gene expression at 8 dpp of the TF and its target genes at each time point. To illustrate the overall pattern, a smoothed line was fit to the substage-specific gene expression. Color of lines represents the substage of target genes. Gene expression is average log2(TPM + 1), averaged over time point replicates. Expression is plotted for (a) Zpf143, (b) Etv5, (c) Mybl1, and (d) Zbtb33
Fig. 5
Fig. 5
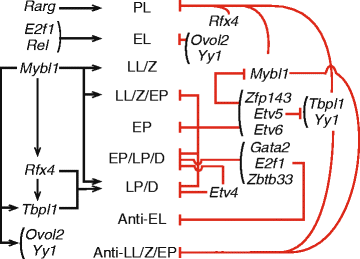
Regulation of substage-concordant gene expression during meiotic prophase. Analyses suggest that substage-concordant gene expression is regulated both positively and negatively by a network of TFs. TFs are shown by their gene names, and the meiotic substages of predicted TF target genes are shown in the center. Black arrows represent a TF acting as an enhancer on its target genes and red bars represent a TF acting as a suppressor on its target genes. (Abbreviations: PL = pre-leptonema, EL = early leptonema, LL/Z = late leptonema and zygonema, LL/Z/EP = late leptonema, zygonema, and early pachynema, EP = early pachynema, EP/LP/D = early and late pachynema and diplonema), LP/D = late pachynema and diplonema, Anti-EL = genes negatively concordant with early leptonema, Anti-LL/Z/EP = genes negatively concordant with late leptonema, zygonema, and early pachynema)

References

    1. Hogarth CA, Arnold S, Kent T, Mitchell D, Isoherranen N, Griswold MD. Processive pulses of retinoic acid propel asynchronous and continuous murine sperm production. Biol Reprod. 2015;92(2):37. doi: 10.1095/biolreprod.114.126326. - DOI - PMC - PubMed
    1. Romrell LJ, Bellve AR, Fawcett DW. Separation of mouse spermatogenic cells by sedimentation velocity. A morphological characterization. Dev Biol. 1976;49(1):119–131. doi: 10.1016/0012-1606(76)90262-1. - DOI - PubMed
    1. Bellve AR. Purification, culture, and fractionation of spermatogenic cells. Methods Enzymol. 1993;225:84–113. doi: 10.1016/0076-6879(93)25009-Q. - DOI - PubMed
    1. Bellve AR, Cavicchia JC, Millette CF, O’Brien DA, Bhatnagar YM, Dym M. Spermatogenic cells of the prepuberal mouse. Isolation and morphological characterization. J Cell Biol. 1977;74(1):68–85. doi: 10.1083/jcb.74.1.68. - DOI - PMC - PubMed
    1. da Cruz I, Rodriguez-Casuriaga R, Santinaque FF, Farias J, Curti G, Capoano CA, Folle GA, Benavente R, Sotelo-Silveira JR, Geisinger A. Transcriptome analysis of highly purified mouse spermatogenic cell populations: gene expression signatures switch from meiotic-to postmeiotic-related processes at pachytene stage. BMC Genomics. 2016;17(1):294. doi: 10.1186/s12864-016-2618-1. - DOI - PMC - PubMed

Publication types

MeSH terms