. 2016 Sep 30;291(40):21296-21321.
doi: 10.1074/jbc.M116.738542. Epub 2016 Aug 12.

Architecture of the Human Mitochondrial Iron-Sulfur Cluster Assembly Machinery

Affiliations

Architecture of the Human Mitochondrial Iron-Sulfur Cluster Assembly Machinery

Oleksandr Gakh et al. J Biol Chem. .

Abstract

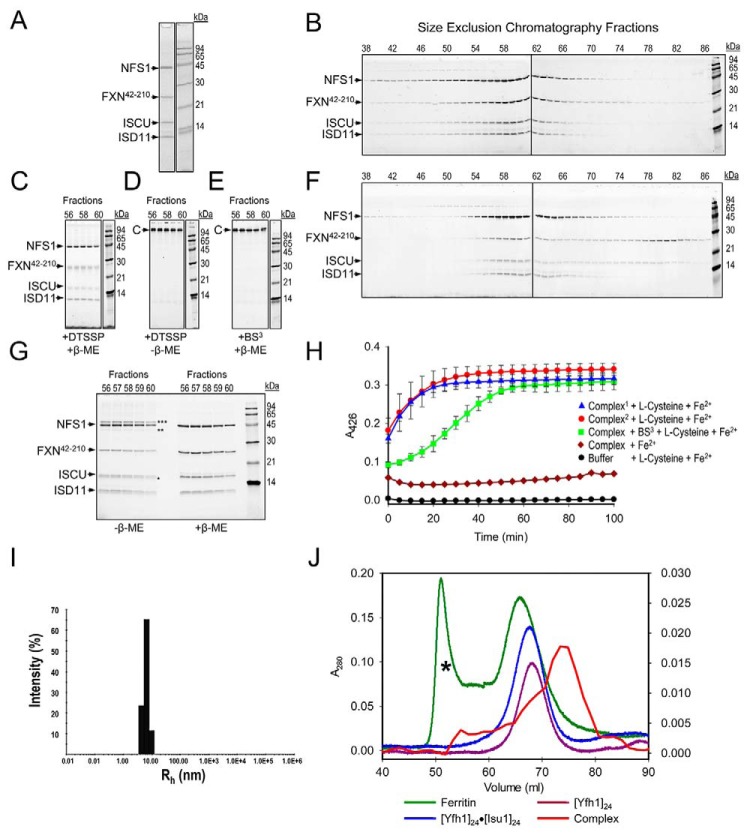
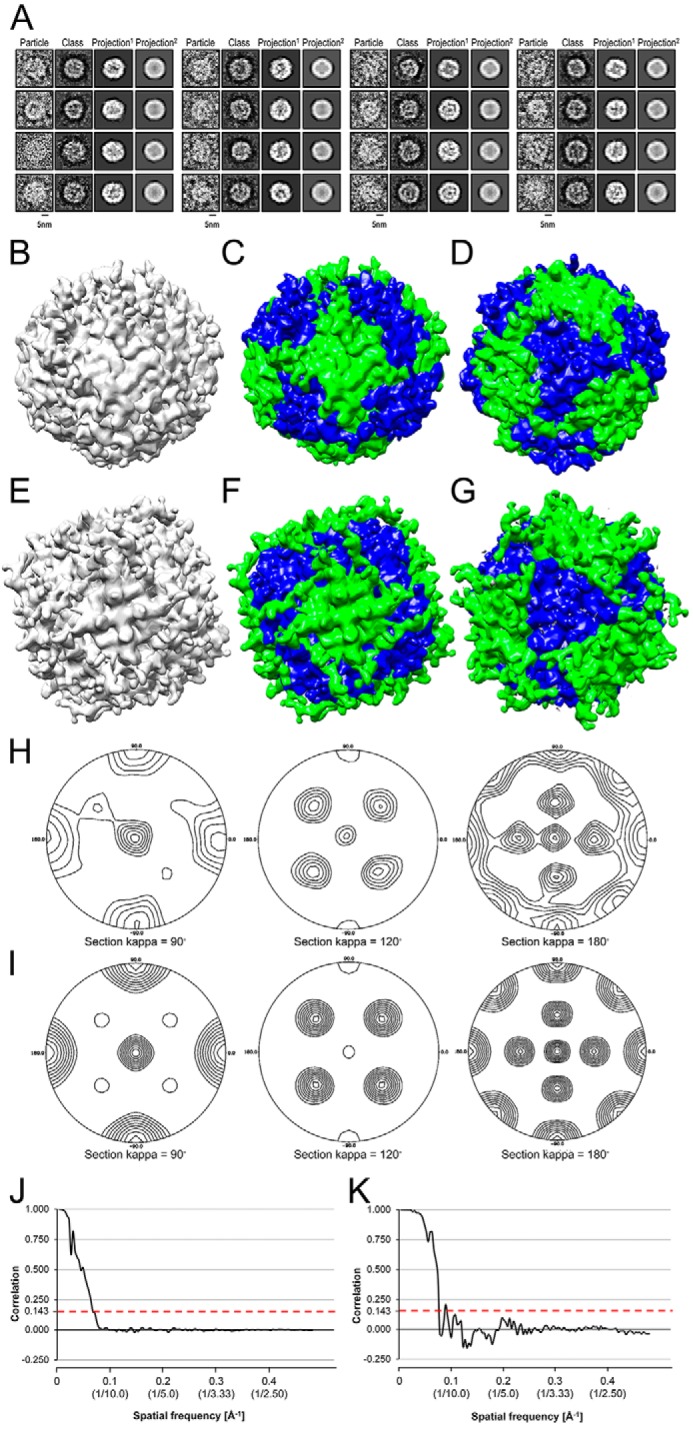
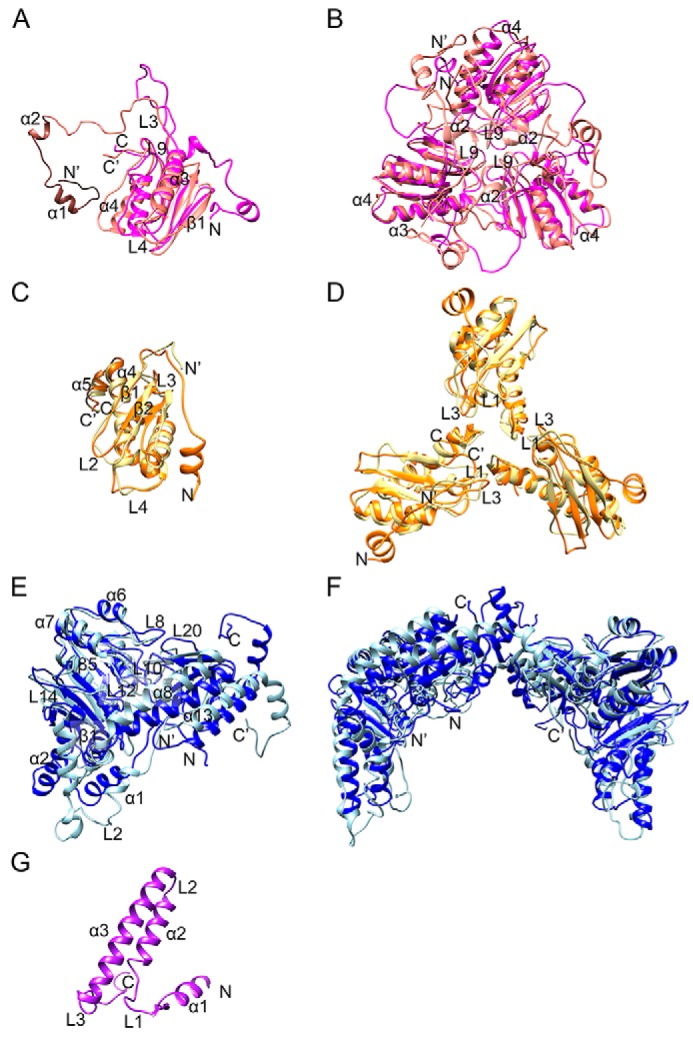
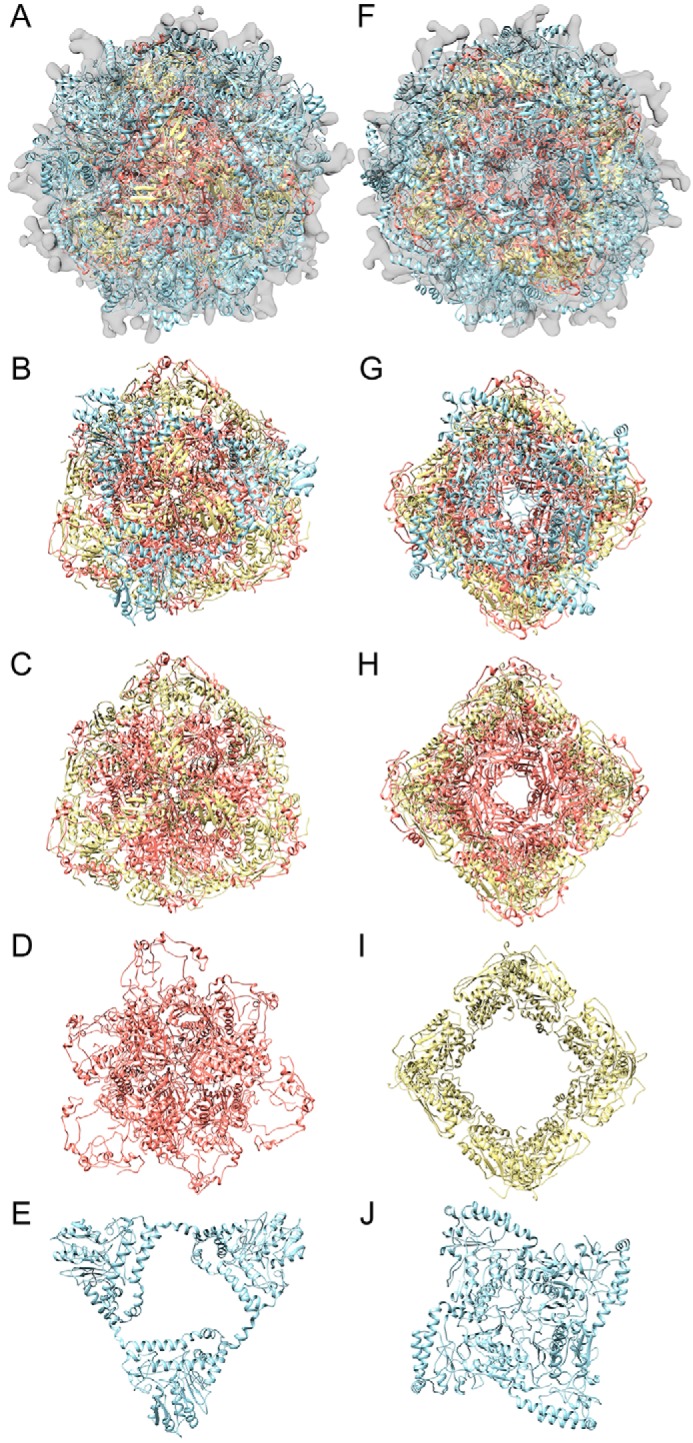
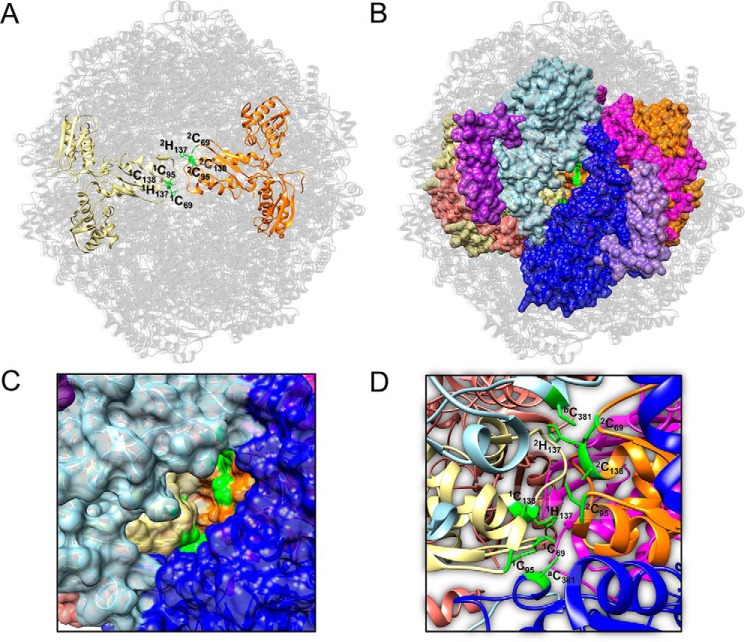
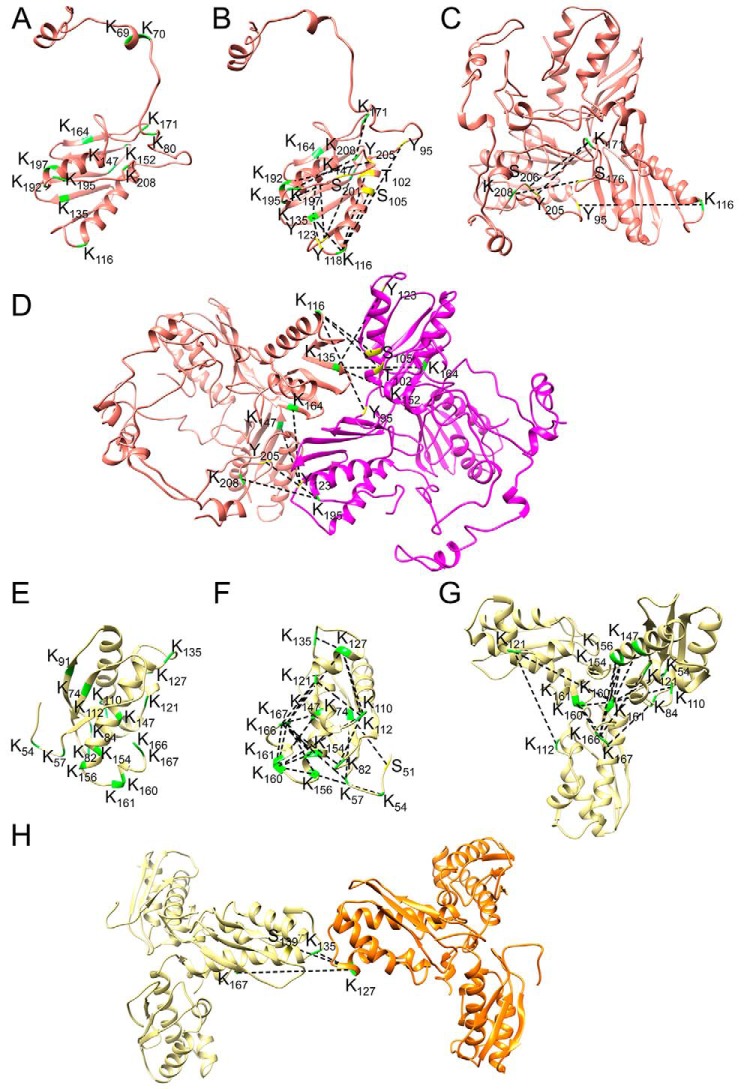
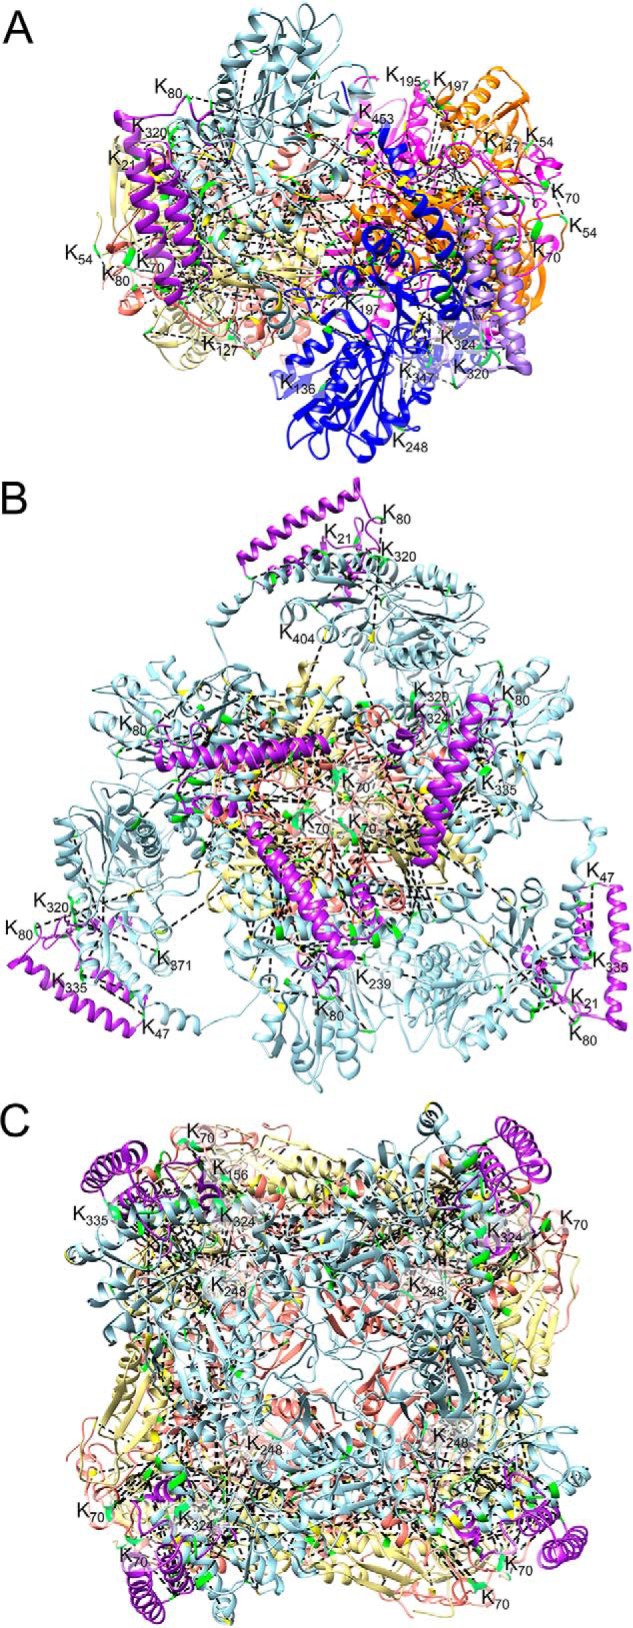
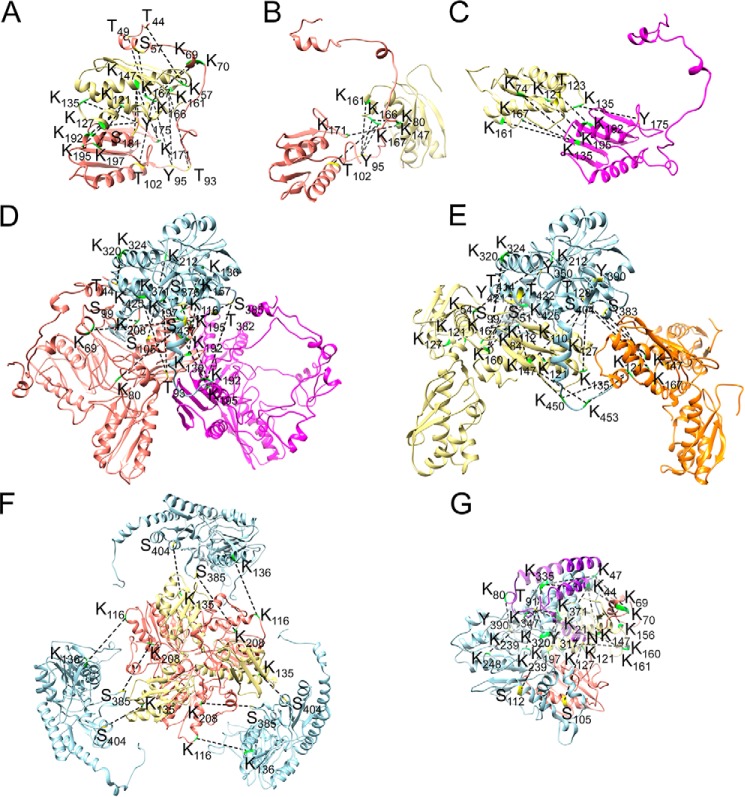
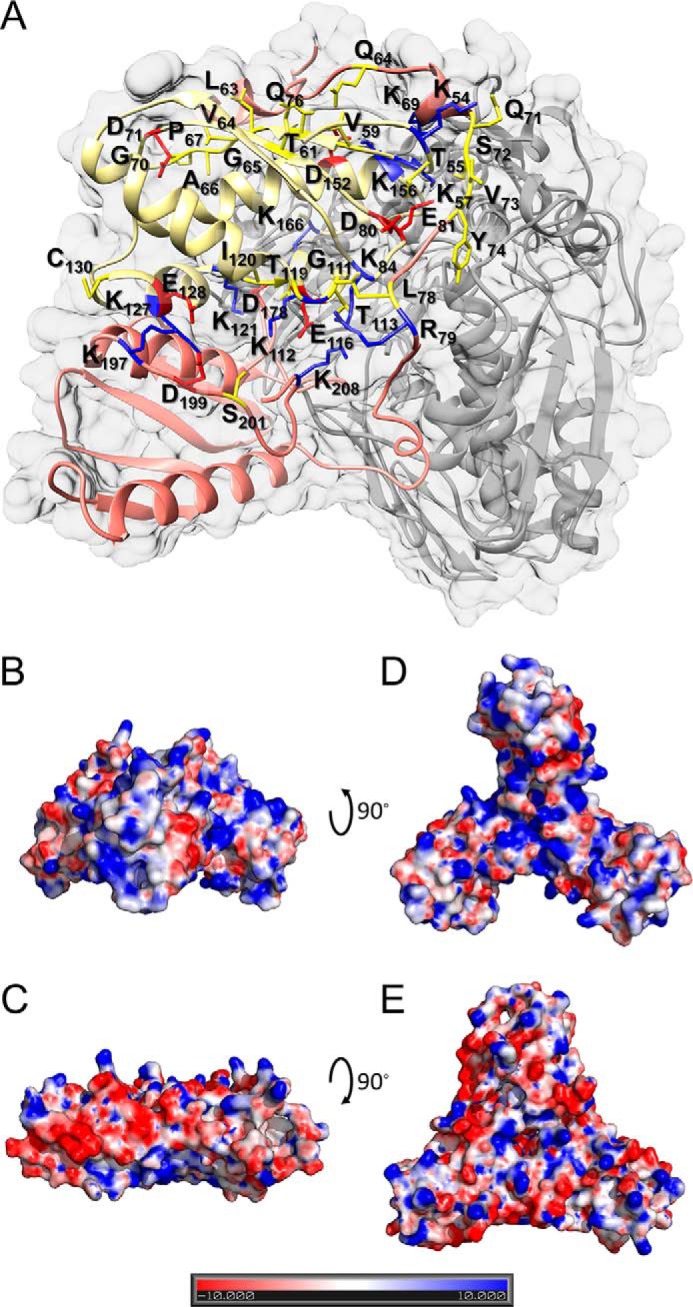
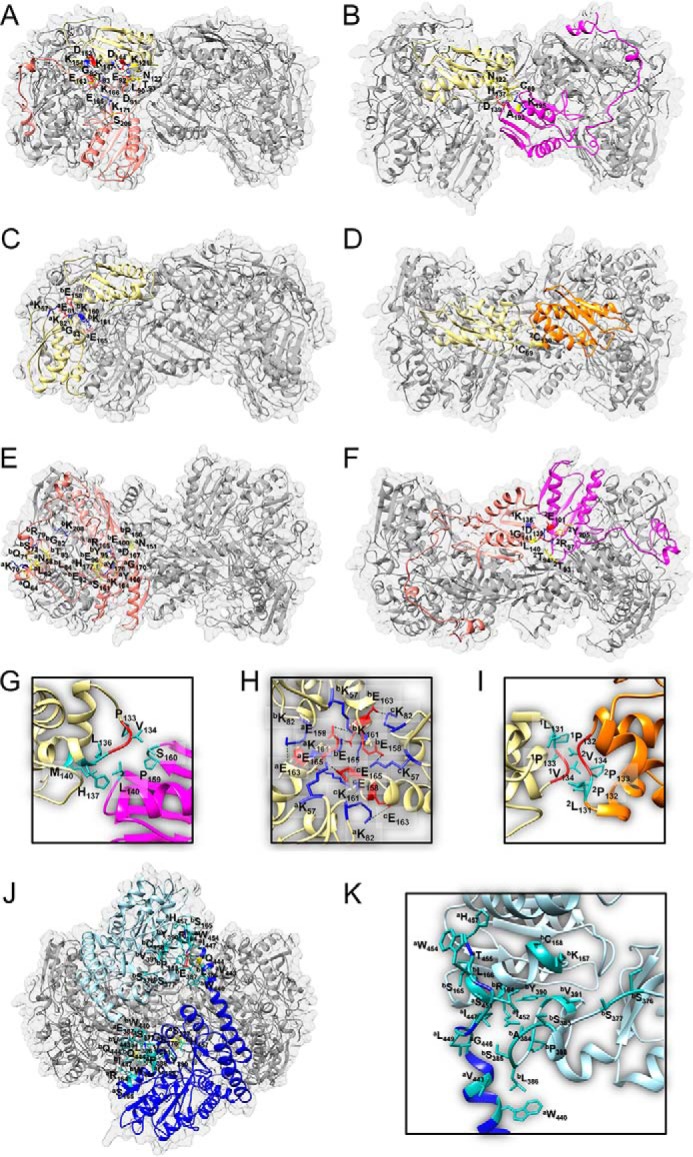
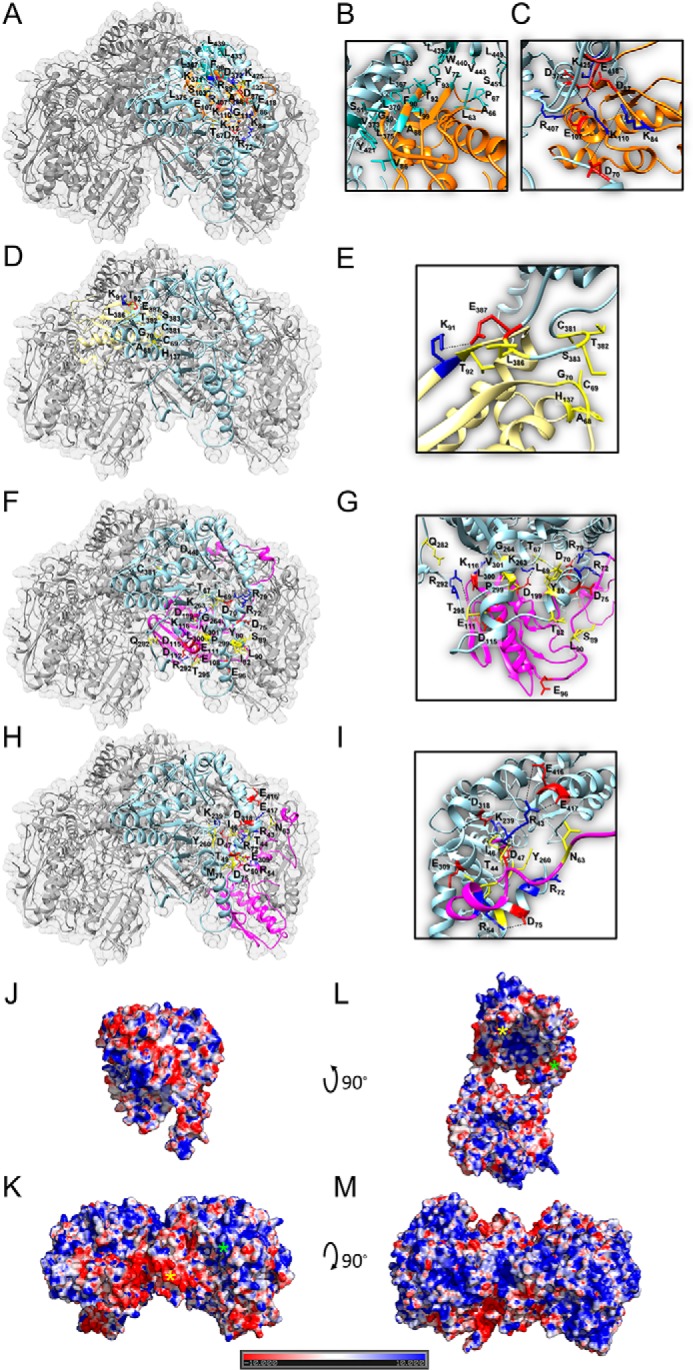
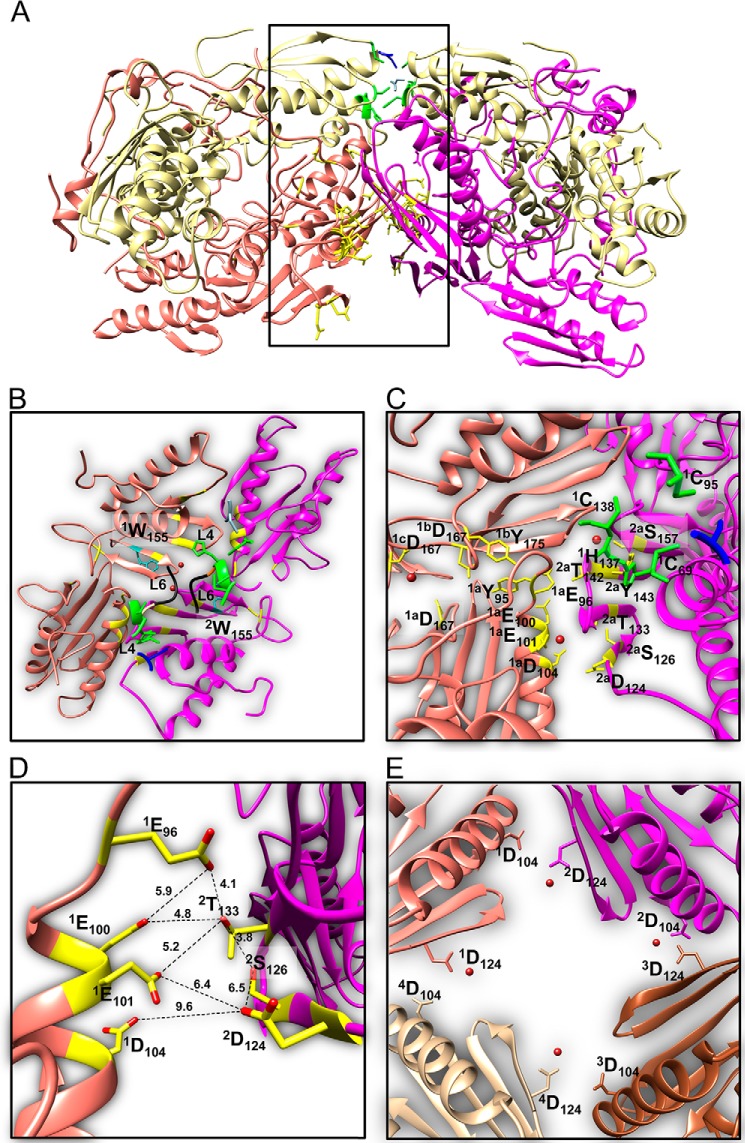
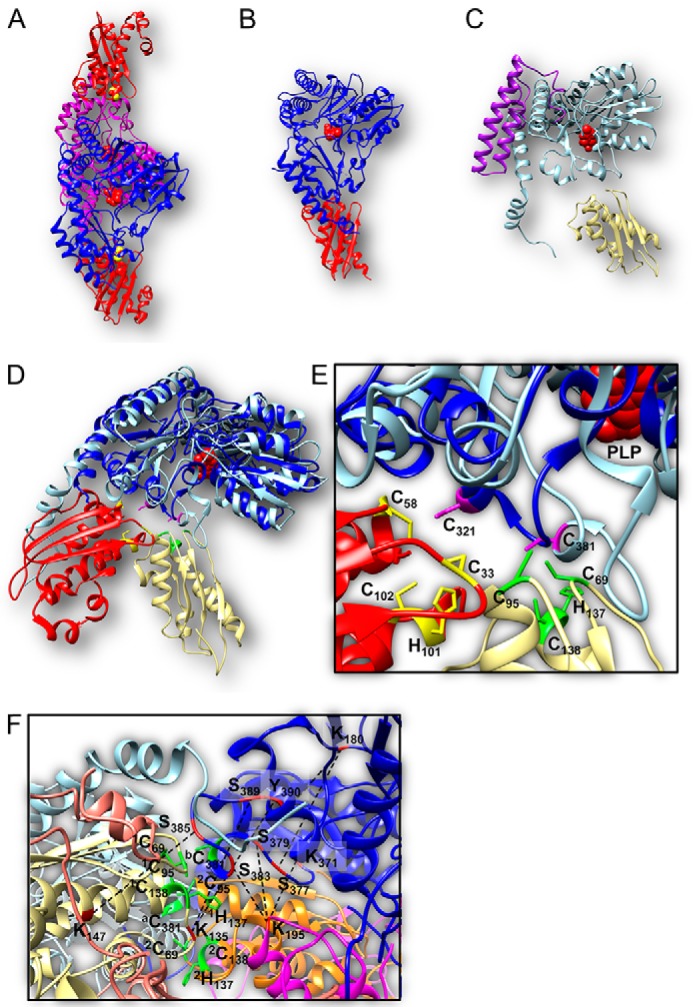
Fe-S clusters, essential cofactors needed for the activity of many different enzymes, are assembled by conserved protein machineries inside bacteria and mitochondria. As the architecture of the human machinery remains undefined, we co-expressed in Escherichia coli the following four proteins involved in the initial step of Fe-S cluster synthesis: FXN42-210 (iron donor); [NFS1]·[ISD11] (sulfur donor); and ISCU (scaffold upon which new clusters are assembled). We purified a stable, active complex consisting of all four proteins with 1:1:1:1 stoichiometry. Using negative staining transmission EM and single particle analysis, we obtained a three-dimensional model of the complex with ∼14 Å resolution. Molecular dynamics flexible fitting of protein structures docked into the EM map of the model revealed a [FXN42-210]24·[NFS1]24·[ISD11]24·[ISCU]24 complex, consistent with the measured 1:1:1:1 stoichiometry of its four components. The complex structure fulfills distance constraints obtained from chemical cross-linking of the complex at multiple recurring interfaces, involving hydrogen bonds, salt bridges, or hydrophobic interactions between conserved residues. The complex consists of a central roughly cubic [FXN42-210]24·[ISCU]24 sub-complex with one symmetric ISCU trimer bound on top of one symmetric FXN42-210 trimer at each of its eight vertices. Binding of 12 [NFS1]2·[ISD11]2 sub-complexes to the surface results in a globular macromolecule with a diameter of ∼15 nm and creates 24 Fe-S cluster assembly centers. The organization of each center recapitulates a previously proposed conserved mechanism for sulfur donation from NFS1 to ISCU and reveals, for the first time, a path for iron donation from FXN42-210 to ISCU.

Keywords: Friedreich ataxia; frataxin; iron-sulfur protein; mitochondria; protein complex.


Figures

FIGURE 1.
FIGURE 1.
Co-expression of human FXN42–210, NFS1, ISD11, and ISCU proteins in E. coli yields a stable and active four-protein complex. A, histidine-tagged NFS1 was co-expressed in E. coli with ISD11, ISCU, and streptavidin-tagged FXN42–210, and a complex containing all four proteins was purified as described under “Experimental Procedures.” B, Sephacryl S-300 size-exclusion chromatography and SDS-PAGE analysis of purified complex. C–E, complex eluted from the StrepTrapTM HP affinity column was treated with DTSSP (C and D) or BS3 (E) cross-linker and purified by size-exclusion chromatography, after which fractions 56–60 were analyzed by SDS-PAGE in the presence (C and E) or absence (D) of the reducing agent β-mercaptoethanol (β-ME). F, complex eluted from the StrepTrapTM HP affinity column was incubated for 1 h in the presence of 5 mm β-mercaptoethanol, purified by size-exclusion chromatography in TN150 buffer containing 5 mm β-mercaptoethanol, and analyzed by SDS-PAGE. G, after size-exclusion chromatography in the absence of reducing agent (B), fractions 56–60 were analyzed by SDS-PAGE in the absence or presence of β-mercaptoethanol. Asterisks denote protein bands that are only observed under non-reducing conditions (see supplemental Table S1 for details). H, indicated complex preparations were tested for their ability to catalyze Fe-S cluster assembly; Complex1 and Complex2 denote complex after the third and the last purification steps. Assays were performed anaerobically in the presence of 5 μm complex, 1 mm l-cysteine, 50 μm Fe2+ as described under “Experimental Procedures.” Each of the plots shows the mean ± S.D. of three independent measurements with two different complex preparations. I, dynamic light scattering measurements were performed on BS3-cross-linked complex freshly eluted from the size-exclusion chromatography column, and the hydrodynamic radius (Rh) was obtained as described under “Experimental Procedures.” J, elution volumes of the human complex (Complex) and the indicated protein complexes analyzed by Sephacryl S-300 size-exclusion chromatography. Asterisk denotes ferritin dimer. Although the predicted molecular mass of the human complex (∼2 MDa) is greater than that of ferritin (700–800 kDa due to iron content), these two complexes are eluted according to their similar dimensions (40). The fact that the human complex elutes slightly later than ferritin may also be due to retardation through weak adsorption to the gel.
FIGURE 2.
FIGURE 2.
Transmission EM and single particle analysis of human four-protein complex. A, electron micrographs of purified uranyl acetate-stained complex particles were obtained, and images were processed with the EMAN2 software package. Shown is a gallery of class averages, with one representative particle from each class and the corresponding projection of the initial 3D reconstructions without symmetry applied (Projection1 columns) and with 432 symmetry applied (Projection2 columns). Particles, class averages, and projections representing the 2-, 3-, and 4-fold axis of the complex and intermediate orientations are shown sequentially from the left to the right starting with the top row. The particle diameter was 15.2 ± 0.8 nm (average of 103 particles with 2-fold orientations), 15.1 ± 0.7 nm (average of 123 particles with 3-fold orientations), and 15.4 ± 0.7 nm (average of 91 particles with 4-fold orientations). B–G, refined 3D models were generated without imposed symmetry (B) or with 432 symmetry applied (E). Both models were segmented using Chimera, and the 4-fold (C and F) and 3-fold (D and G) axes were identified and colored in green and blue, respectively. H and I, stereographic projection plots of the kappa = 90°(4-fold), kappa = 120° (3-fold), and kappa = 180° (2-fold) sections of the self-rotation function of the EM density map of the refined 3D model of the complex without symmetry applied (H) and with 432 symmetry applied (I), obtained using POLARRFN. J and K, PDBe Fourier shell correlation (FSC) server was used to calculate and plot the FSC curve for the refined 3D model without (J) and with 432 symmetry applied (K). The dashed red line shows where the FSC curve crosses the correlation value of 0.143.
FIGURE 3.
FIGURE 3.
Molecular dynamics flexible fitting for docked structures of FXN42–210, NFS1, and ISCU proteins. A–F, upon docking of eight [FXN42–210]3·[ISCU]3 sub-complexes and 24 NFS1 monomers into the EM density map of the refined 3D model with 432 symmetry applied, one-half of the docked structure was subjected to molecular dynamics simulations and energy minimizations as described under “Experimental Procedures.” FXN42–210 monomer (A) and trimer (B) before (magenta ribbon; N, N terminus) and after (salmon ribbon; N′, N terminus); ISCU monomer (C) and trimer (D) before (orange ribbon; N, N terminus) and after (yellow ribbon; N′, N terminus); and NFS1 monomer (E) and dimer (F) before (blue ribbon; N, N terminus) and after (light blue ribbon; N′, N terminus) molecular dynamics simulations and energy minimizations. G, model of ISD11 monomer (purple ribbon; N, N terminus) obtained using the I-TASSER web resource, which was not included in the simulated structure as described under “Results.”
FIGURE 4.
FIGURE 4.
Overall architecture of the human [FXN42–210]24·[ISCU]24·[NFS1]24 complex. A–F, to visualize the structure of the entire complex, the simulated half of the structure was aligned with itself into the EM density map of the refined 3D model. The structure consists of 24 FXN42–210 (salmon ribbon), 24 ISCU (yellow ribbon), and 24 NFS1 (light blue ribbon) subunits. A and F, docked structure at the 3-fold (A) and 4-fold (F) axes of the complex. B–J, structural building blocks of the complex at the 3-fold axis (B–E) and the 4-fold axis (G–J) of the complex with EM density map removed.
FIGURE 5.
FIGURE 5.
Fe-S cluster assembly center at the 2-fold axis of the human [FXN42–210]24·[ISCU]24·[NFS1]24 complex. A, top view of two Fe-S cluster assembly sites formed by two adjacent [ISCU]3 sub-complexes at the 2-fold axis of the complex. ISCU trimers are shown as yellow and orange ribbons with Fe-S cluster coordinating residues shown as green sticks. The numbers 1 and 2 denote the two adjacent ISCU trimers. B, as in A with addition of two adjacent FXN42–210 trimers shown as salmon and magenta ribbons and surfaces, and one [NFS1]2·[ISD11]2 sub-complex, with NFS1 subunits shown as light blue and blue ribbons and surfaces, and ISD11 subunits shown as purple and light purple ribbons and surfaces. C, closer view of the two [2Fe-2S] assembly centers shown in B. D, same as C but with surfaces removed. The numbers 1 and 2 denote the two adjacent ISCU trimers, and the letters a and b the two adjacent NFS1 monomers. The structure of the [FXN42–210]6·[NFS1]2·[ISCU]6 sub-complex was extracted from the simulated half-structure of the complex, whereas ISD11 subunits were modeled at the surface of the complex as described under “Results.”
FIGURE 6.
FIGURE 6.
Architecture of FXN42–210 and ISCU trimers analyzed using chemical cross-linking. A and E, Lys residues (K, shown in green) available for cross-linking with BS3 in each FXN42–210 (A) and ISCU (E) monomer. B–D and F–H, mapping of representative cross-links (dotted lines; Lys residues are in green and non-Lys residues in yellow) in the simulated structures of FXN42–210 and ISCU monomers and trimers (see supplemental Table S2, a and b, for a detailed analysis of all cross-links identified). B, FXN42–210 subunit structure fulfills the distance constraints set by cross-links K192–Y205, K195–S201, K197–K208, K171–K208, K116–S105, K116–K135, Y118–K135, Y123–K147, and Y123–K164, and the maximum allowable distance constraints set by cross-links K116–Y95 and K116–T102 (supplemental Table S2a, pp. 1 and 2). C, FXN42–210 trimer structure fulfills the distance constraints set by cross-link K171–Y205, and the maximum allowable distance constraints set by cross-links K208–S176, K171–S206, and K116–Y95 (supplemental Table S2a, p. 1). D, structure of two adjacent FXN42–210 trimers fulfills the distance constraints set by cross-links K135–K152, K135–K164, K116–S105, Y123–K135, Y123–K147, and Y123–K164, and the maximum allowable distance constraints set by cross-links K195–Y205, K195–K208, K116–Y95, and K116–T102 (supplemental Table S2a, pp. 1 and 2). F, ISCU subunit structure fulfills the distance constraints set by cross-links S51–K74, K54–K156, K57–K74, K57–K166, K82–K112, K110–K127, K112–K121, K112–K127, K121–K166, K127–K135, K127–K167, K147–K160, K147–K166, K154–K160, K154–K166, K154–K167, K156–K160, K156–K167, K160–K167, K161–K166, K112–K160, and K82–K166 (supplemental Table S2b, pp. 1–4 and 7). G, ISCU trimer structure fulfills the distance constraints set by cross-links K54–K160, K121–K160, K147–K160, K154–K161, K154–K166, K156–K160, K156–K166, K160–K167, K161–K166, K110–K160, K160–K160, and K84–K167, and the maximum allowable distance constraints set by cross-links K112–K121 and K121–K166 (supplemental Table S2b, pp. 1, 2, 4, and 7). H, structure of two adjacent ISCU trimers fulfills the distance constraints set by cross-links K127–K135 and K127–S139, and the maximum allowable distance constraints set by cross-link K127–K167 (supplemental Table S2b, pp. 2, 3, and 7).
FIGURE 7.
FIGURE 7.
Architecture of NFS1 monomer, dimer, trimer, and tetramer and of ISD11 monomer analyzed using chemical cross-linking. A and F, Lys residues (K, shown in green) available for cross-linking with BS3 in each NFS1 (A) and ISD11 (F) monomer. B–E and G, mapping of representative cross-links (dotted lines; Lys residues are in green and non-Lys residues in yellow) in the simulated structures of NFS1 monomer, dimer, trimer, and tetramer, and the modeled ISD11 monomer (see supplemental Table S2, c and d for a detailed analysis of all cross-links identified). B, NFS1 subunit structure fulfills the distance constraints set by cross-links K180–K324, K180–K335, K212–K320, K212–K324, K226–K248, K239–K371, K248–K347, K320–K335, K324–K335, K180–K371, K324–Y317, K157–K371, K320–T414, K324–T415, and K335–S405 and the maximum allowable distance constraints set by cross-links K371–K453 and K212–K425 (supplemental Table S2c, pp. 1–4). C, NFS1 dimer structure fulfills the distance constraints set by cross-link K157–S437, and the maximum allowable distance constraints set by cross-links K371–T455, K180–S365, and K157–S365 (supplemental Table S2c, pp. 1, 3, and 4). D, NFS1 trimer structure fulfills the distance constraints set by cross-link K320–S437 (supplemental Table S2c, p. 1). E, NFS1 tetramer structure fulfills the distance constraints set by cross-links K157–S99 and K226–K248, and the maximum allowable distance constraint set by cross-link K320–T174 (supplemental Table S2c, pp. 2 and 3). G, ISD11 subunit structure fulfills the distance constraints set by cross-links K44–Y13, K44–K58, and K47–K60, and the maximum allowable distance constraints set by cross-links K47–Y13, K58–K80, K60–K80, and K44-T91 (supplemental Table S2d, p. 1).
FIGURE 8.
FIGURE 8.
Architecture of the [FXN42–210]24·[ISCU]24·[NFS1]24·[ISD11]24complex analyzed using primary amine-specific cross-linking. A–C, mapping of representative FXN42–210-ISCU, FXN42–210-NFS1, FXN42–210-ISD11, NFS1-ISCU, and NFS1-ISD11 cross-links (dotted lines; Lys residues are in green and non-Lys residues in yellow) at the 2-fold axis (90 recurring cross-links are shown) (A), 3-fold axis (85 recurring cross-links are shown) (B), and 4-fold axis (85 recurring cross-links are shown) (C) of [FXN42–210]24·[ISCU]24·[NFS1]24·[ISD11]24 complex. Most cross-links are shown in detail in Fig. 9.
FIGURE 9.
FIGURE 9.
Architecture of the [FXN42–210]·[ISCU], [FXN42–210]·[NFS1], [ISCU]·[NFS1], and [FXN42–210]·[ISCU]·[NFS1]·[ISD11] sub-complexes analyzed using primary amine-specific cross-linking. A, [FXN42–210]·[ISCU] heterodimer structure fulfills the distance constraints set by FXN42–210-ISCU cross-links T49–K167, S57–K167, K69–K166, K171–K147, Y175–K127, Y175–K135, Y175–K147, S181–K147, K192–K121, K195–K121, and K197–K121, and the maximum allowable distance constraints set by cross-links T93–K161, Y95–K161, T102–K166, Y95–K166, and K70–K167 (supplemental Table S2e, pp. 1–3). B, arrangement of adjacent FXN42–210 and ISCU subunits within the same [FXN42–210]3·[ISCU]3 sub-complex fulfills the distance constraints set by FXN42–210-ISCU cross-links K80–K166, Y95–K161, T102–K167, K171–K147, Y95–K166, and Y95–K167 (supplemental Table S2e, pp. 1–3). C, arrangement of FXN42–210 and ISCU subunits from two adjacent [FXN42–210]3·[ISCU]3 sub-complexes fulfills the distance constraints set by FXN42–210-ISCU cross-links Y175–K135, K192–T123, K195–K121, and K135–K167, and the maximum allowable distance constraints set by cross-links K135–K74 and K135–K161 (supplemental Table S2e, pp. 1–3). D, at the 2-fold axis of the complex, the arrangement of each subunit of the NFS1 dimer relative to FXN42–210 subunits from two adjacent FXN42–210 trimers fulfills the distance constraints set by FXN42–210-NFS1 cross-links T44–K320, K192–K371, K195–K371, K197–K371, K192–S385, K195–S385, K197–T382, K208–S99, K116–K136, and K116–K157, and the maximum allowable distance constraint set by cross-links T93–K425, T93–K371, K135–K157, K69–S437, and K80–S437 (supplemental Table S2f, pp. 1–3); the structure exceeds by ∼9 Å the maximum allowable distance constraint set by cross-link S105–K212 (supplemental Table S2f, p. 1). E, at the 2-fold axis of the complex, the arrangement of each subunit of the NFS1 dimer relative to ISCU subunits from two adjacent ISCU trimers fulfills the distance constraints set by ISCU-NFS1 cross-links S51–K425, K110–T422, K112–Y421, K147–S383, K147–K450, K147–K453, K84–Y350, K127–S99, K135–S404, and K160–Y421 and the maximum allowable distance constraints set by cross-links K121–K450, K121–K453, K160–K320, K160–K324, K167–Y390, K121–Y421, K127–Y421, K147–S404, K147-T414, K160–K425, K167–S99, and K127–Y390 (supplemental Table S2g, pp. 1–5); the structure exceeds by 2–6 Å the maximum allowable distance constraints set by cross-links K167–T128, K147–T128, and K54–K212 (supplemental Table S2g, pp. 1, 2, and 4). F, at the 3-fold axis of the complex, the arrangement of NFS1 subunits relative to FXN42–210 and ISCU subunits of one [FXN42–210]3·[ISCU]3 sub-complex fulfills the distance constraints set by ISCU-NFS1 cross-link K135–S404 (supplemental Table S2g, p. 4), and the maximum allowable distance constraints set by FXN42–210-NFS1 cross-links K208–S385 and K116–K136 (supplemental Table S2f, pp. 1 and 2). G, the arrangement of the [NFS1]·[ISD11] heterodimer relative to the [FXN42–210]·[ISCU] heterodimer underneath fulfills (i) the distance constraints set by FXN42–210-ISD11 cross-links K69–K44 and K70–K47 (supplemental Table S2h, p. 2) [it exceeds by ∼1–4 Å the maximum allowable distance constraints set by cross-links K197–K44 and S105–N-term (supplemental Table S2h, p. 1)]; (ii) the distance constraints set by ISCU-ISD11 cross-links K147–K44, K156–K47, and K160–N-term, and the maximum allowable distance constraints set by cross-links K121–N-term and K127–N-term (supplemental Table S2h, pp. 3 and 4) [it exceeds by ∼7 Å the maximum allowable distance constraints set by cross-link K161–T91 (supplemental Table S2h, p. 3)]; (iii) the distance constraints set by NFS1-ISD11 cross-links K335–K44, K335–K47, Y317–K21, K347–T91, K371–T91, K320–T91, K335–T91, and K239–T91, and the maximum allowable distance constraints set by cross-links Y390-K80 and K248-T91 [it exceeds by ∼3 Å the maximum allowable distance constraints set by cross-link S112–K21 (supplemental Table S2h, pp. 5 and 6)].
FIGURE 10.
FIGURE 10.
Interface of the [FXN42–210]3·[ISCU]3 sub-complex. A, PISA-identified [FXN42–210]·[ISCU] heterodimer interface. Conserved residues within this interface predicted to form hydrogen bonds and salt bridges between the two proteins are shown as red, blue, and yellow sticks for acidic, basic, and neutral residues, respectively. B–E, electrostatic potential of the entire [FXN42–210]3·[ISCU]3 sub-complex interface generated using PyMOL. B and C, ISCU trimer (B) and FXN42–210 trimer (C) in a lock and key arrangement. D and E, inside view of the interface between ISCU trimer (D) and FXN42–210 trimer (E). Increasing red represents increasing negative charge, white is neutral charge, and increasing blue represents increasing positive charge.
FIGURE 11.
FIGURE 11.
Interfaces within two adjacent [FXN42–210]3·[ISCU]3 sub-complexes and within the [NFS1]2 homodimer at the 2-fold axis of the complex. A–K, PISA-identified interfaces with amino acid residues shown as red, blue, sea blue, and yellow sticks for acidic, basic, hydrophobic, and neutral residues, respectively. A, interface between the N terminus of one FXN42–210 subunit and one adjacent ISCU subunit within the same [FXN42–210]3·[ISCU]3 sub-complex. B, interface between one FXN42–210 subunit and one ISCU subunit from the adjacent [FXN42–210]3·[ISCU]3 sub-complex. C and D, interface between two ISCU subunits (denoted a and b) of the same sub-complex (C) and two ISCU subunits (denoted 1 and 2) of adjacent sub-complexes (D). E and F, interface between FXN42–210 subunits (denoted a and b) of the same sub-complex (E) and two FXN42–210 subunits of adjacent sub-complexes (F). G and I, closer views of B and D, respectively, show possible hydrophobic interactions involving the PVK motif of ISCU (red ribbon) between one ISCU and one FXN42–210 subunit (G) and between two ISCU subunits of adjacent [FXN42–210]3·[ISCU]3 sub-complexes (I). H, PISA-identified salt bridges at the 3-fold axis of ISCU trimer (a–c denote the three subunits). J, two symmetrical interface are present between subunits of the NFS1 homodimer; K shows hydrophobic residues involved in one of the two NFS1-NFS1 interfaces.
FIGURE 12.
FIGURE 12.
Interfaces between [NFS1]2 homodimer and two adjacent [FXN42–210]3·[ISCU]3 sub-complexes at the 2-fold axis of the complex. A–I, PISA-identified interfaces with amino acid residues shown as red, blue, sea blue, and yellow sticks for acidic, basic, hydrophobic, and neutral residues, respectively. A and D, interfaces between each subunit of the NFS1 homodimer and ISCU subunits of two adjacent [FXN42–210]3·[ISCU]3 sub-complexes. B and C, hydrophobic interactions (B) and salt bridges (C) between NFS1 and ISCU subunits at the interface shown in A. E, salt bridges formed between NFS1 and ISCU subunits at the interface shown in D. F and H, interface between each subunit of the NFS1 homodimer and two FXN42–210 subunits of the same [FXN42–210]3·[ISCU]3 sub-complex. G and I, salt bridges between NFS1 and FXN42–210 subunits at the interfaces shown in F and H. J–M, electrostatic potential of the entire [FXN42–210]6·[ISCU]6·[NFS1]2 sub-complex interface generated using PyMOL. J and K, [NFS1]2 homodimer (J) and two adjacent [FXN42–210]3·[ISCU]3 sub-complexes (K) are shown in a lock and key arrangement. L and M, inside view of the interface between the NFS1 heterodimer (L) and two adjacent [FXN42–210]3·[ISCU]3 sub-complexes (M). Increasing red represents increasing negative charge; white is neutral charge, and increasing blue represents increasing positive charge. K and L, yellow asterisks show an acidic patch on FXN42–210, including conserved residues Asp-112 and Asp-115 (K), and a corresponding basic patch on NFS1, including invariant residues Arg-289 and Arg-R292 (L); green asterisks show a basic patch formed by FXN42–210 residues Arg-43, Arg-53, and Arg-54, together with ISCU conserved residues Lys-84 and Lys-110 (K), and a corresponding acidic patch on NFS1, including conserved residues Asp-372, Glu-416, and Glu-417) (L).
FIGURE 13.
FIGURE 13.
Fe-S cluster assembly center of the human four-protein complex. A, ribbon representation of the Fe-S cluster assembly center formed by two adjacent [FXN42–210]3·[ISCU]3 sub-complexes and one [NFS1]2·[ISD11]2 sub-complex at the 2-fold axis of the complex; for the two NFS1 subunits, only the Cys-381 residues are shown as a light blue and a blue stick; ISD11 subunits are not shown (see also Fig. 5B). B, position of the PVK motifs (shown as black ribbons) of ISCU subunits relative to each of the two Fe-S cluster assembly centers; Trp-155 of FXN42–210 is shown as a light blue stick; FXN42–210 residues involved in iron binding are highlighted in yellow. C, proposed FXN42–210 iron-binding sites modeled as described under “Results.” The numbers 1 and 2 denote two adjacent FXN42–210 or ISCU trimers; the letters a–c denote different subunits of FXN42–210 or ISCU trimer 1 or 2. For ISCU, only the Fe-S cluster coordinating residues are shown as green sticks. For NFS1, only the catalytic Cys-381 is shown as a blue stick. FXN42–210 residues involved in iron binding are shown as yellow sticks. D, putative ferroxidation site formed by two FXN42–210 subunits from the two adjacent [FXN42–210]3·[ISCU]3 sub-complexes at the 2-fold axis of the complex. E, putative iron mineralization sites formed by four FXN42–210 subunits from four adjacent [FXN42–210]3·[ISCU]3 sub-complexes at the 4-fold axis of the complex. Iron atoms were modeled as described under “Results.” The numbers 1–4 denote four adjacent FXN42–210 trimers.
FIGURE 14.
FIGURE 14.
Comparison of bacterial and human Fe-S cluster assembly complexes. A–C, ribbon representation of the A. fulgidus [IscS]2·[IscU]2 complex (PDB code 4EB5) (A), the E. coli [IscS]·[IscU] complex (PDB code 3LVL) (B), and the [NFS1]·[ISD11]·[ISCU] heterotrimer from the human complex (C). D, alignment of the [IscS]·[IscU] heterodimer with the [NFS1]·[ISCU] heterodimer shows the different positions of IscU (red ribbon) and ISCU (yellow ribbon) relative to the flexible loop and catalytic Cys of IscS (blue ribbon) and NFS1 (light blue ribbon). The pyridoxal 5′-phosphate cofactor is shown in red. E, close view of the flexible loops of IscS (blue ribbon) and NFS1 (light blue ribbon), with Cys-321 of IscS and Cys-381 of NFS1 shown as magenta sticks, relative to the positions of the Fe-S cluster coordinating residues of IscU (red ribbon) and ISCU (yellow ribbon), shown as yellow (IscU) and green (ISCU) sticks. F, ribbon representation of the Fe-S cluster assembly center formed by one NFS1 dimer resting on top of two adjacent [FXN42-210]3·[ISCU]3 sub-complexes at the 2-fold axis of the complex with Fe-S cluster coordinating residues of the two ISCU subunits shown as green sticks (1 and 2 denote the two ISCU subunits), and the flexible loops of the two NFS1 subunits with the catalytic Cys-381 residues shown as a green sticks (a and b denote the two NFS1 subunits). The arrangement fulfills the distance constraints set by FXN42–210-NFS1 cross-links K195–K171, K195–S379, and K195–S383 (supplemental Table S2f, p. 1), ISCU-NFS1 cross-links K147–S385, K135–S389, and K135–Y390 (supplemental Table S2g, pp. 1 and 3), and NFS1-NFS1 cross-links K180–S377 and K180–S379 (supplemental Table S2c, p. 1). Cross-links are shown as dotted lines; cross-linked residues are highlighted in red.

Similar articles

Cited by

References

    1. Lill R., Hoffmann B., Molik S., Pierik A. J., Rietzschel N., Stehling O., Uzarska M. A., Webert H., Wilbrecht C., and Mühlenhoff U. (2012) The role of mitochondria in cellular iron-sulfur protein biogenesis and iron metabolism. Biochim. Biophys. Acta 1823, 1491–1508 - PubMed
    1. Kim J. H., Bothe J. R., Alderson T. R., and Markley J. L. (2015) Tangled web of interactions among proteins involved in iron-sulfur cluster assembly as unraveled by NMR, SAXS, chemical crosslinking, and functional studies. Biochim. Biophys. Acta 1853, 1416–1428 - PMC - PubMed
    1. Blanc B., Gerez C., and Ollagnier de Choudens S. (2015) Assembly of Fe/S proteins in bacterial systems: biochemistry of the bacterial ISC system. Biochim. Biophys. Acta 1853, 1436–1447 - PubMed
    1. Maio N., and Rouault T. A. (2015) Iron-sulfur cluster biogenesis in mammalian cells: New insights into the molecular mechanisms of cluster delivery. Biochim. Biophys. Acta 1853, 1493–1512 - PMC - PubMed
    1. Layer G., Ollagnier-de Choudens S., Sanakis Y., and Fontecave M. (2006) Iron-sulfur cluster biosynthesis: characterization of Escherichia coli CyaY as an iron donor for the assembly of [2Fe-2S] clusters in the scaffold IscU. J. Biol. Chem. 281, 16256–16263 - PubMed

MeSH terms