

A Deafness- and Diabetes-associated tRNA Mutation Causes Deficient Pseudouridinylation at Position 55 in tRNAGlu and Mitochondrial Dysfunction
- PMID: 27519417
- PMCID: PMC5076513
- DOI: 10.1074/jbc.M116.739482
A Deafness- and Diabetes-associated tRNA Mutation Causes Deficient Pseudouridinylation at Position 55 in tRNAGlu and Mitochondrial Dysfunction
Abstract
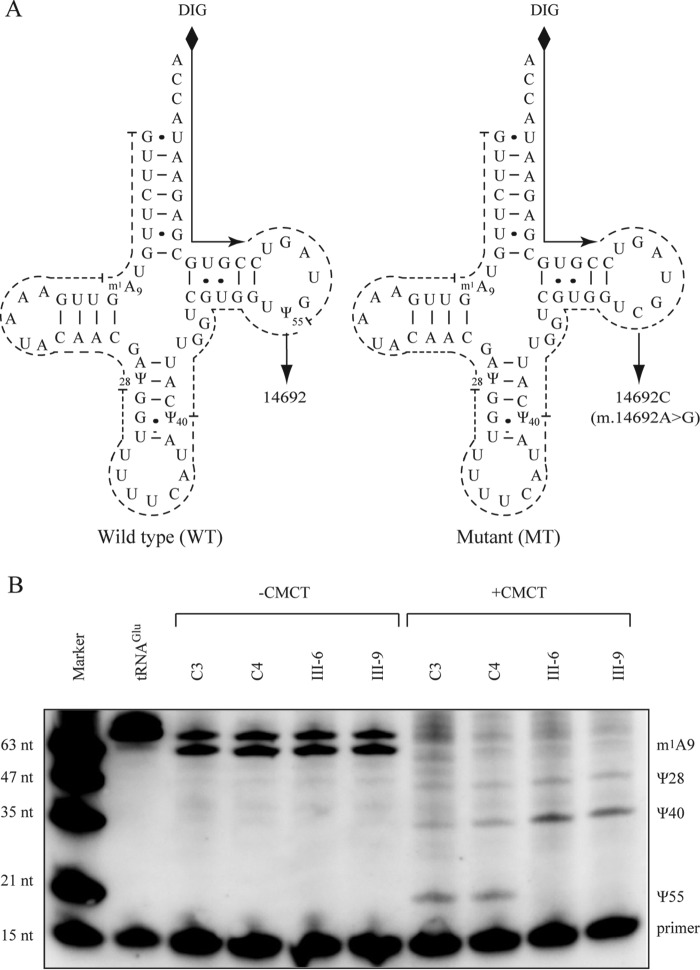
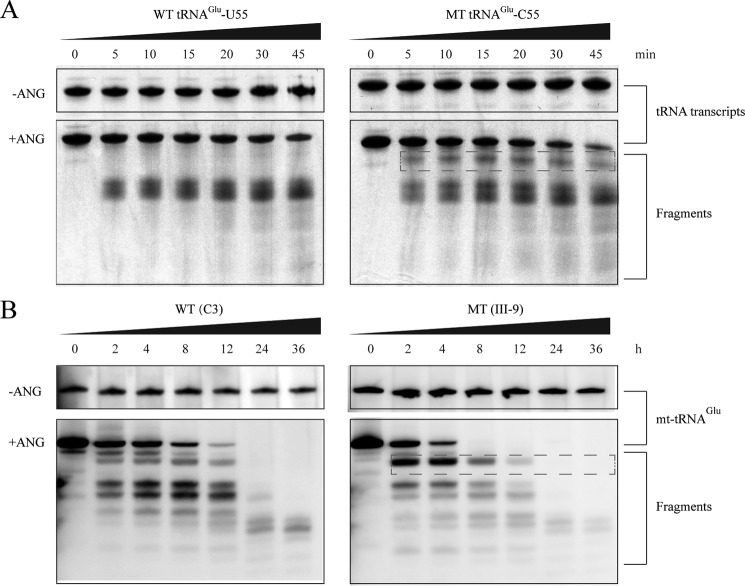
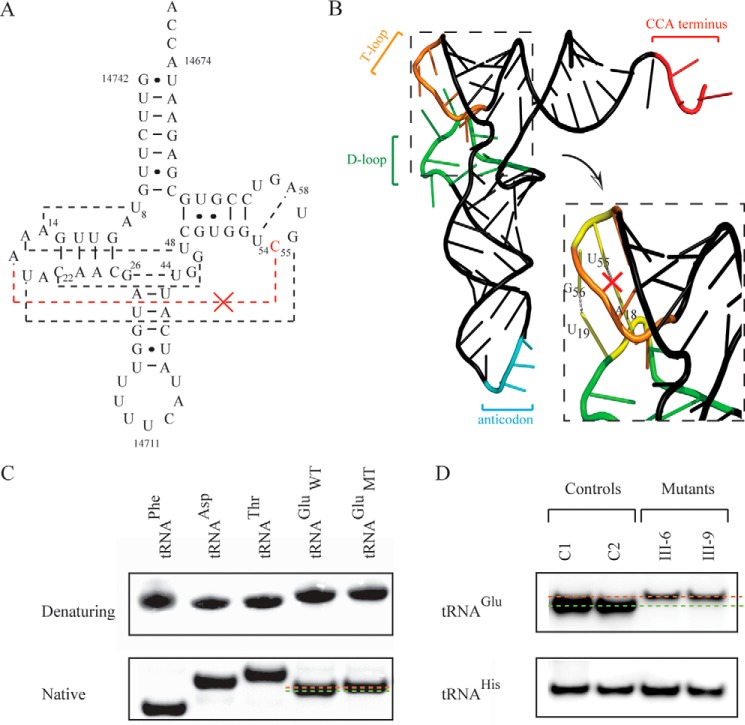
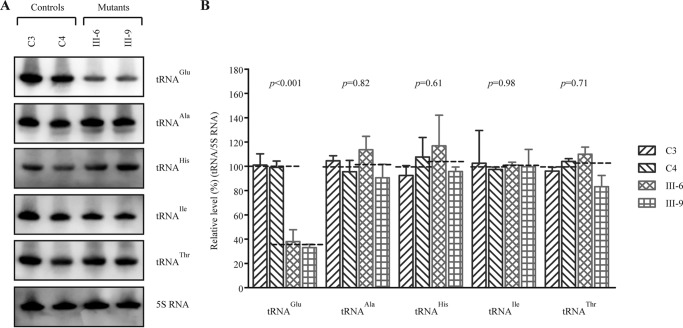
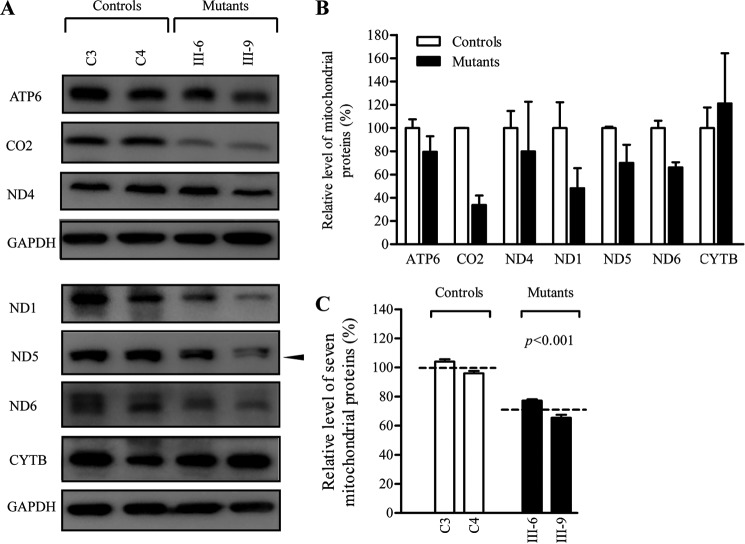
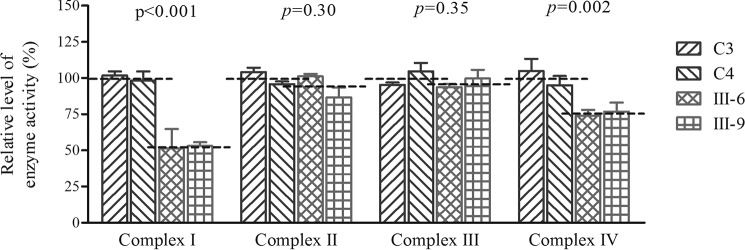
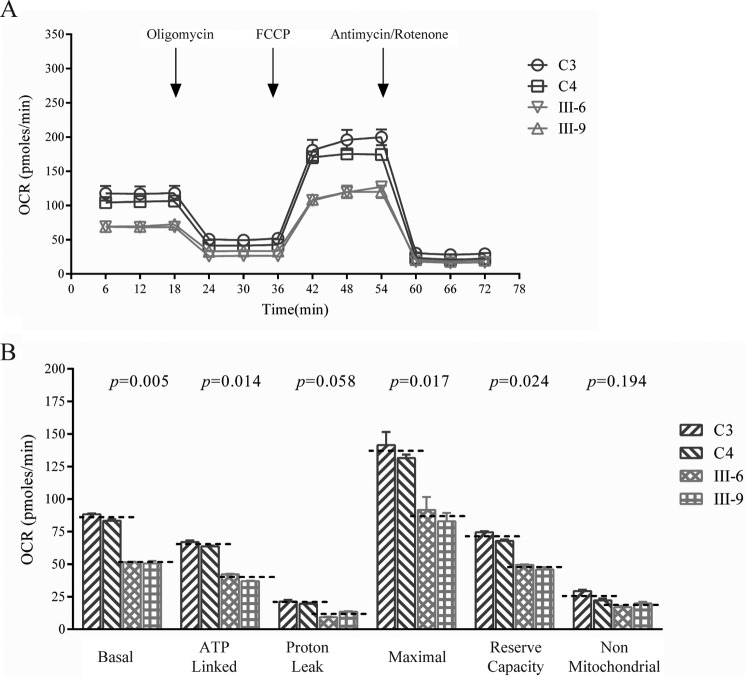
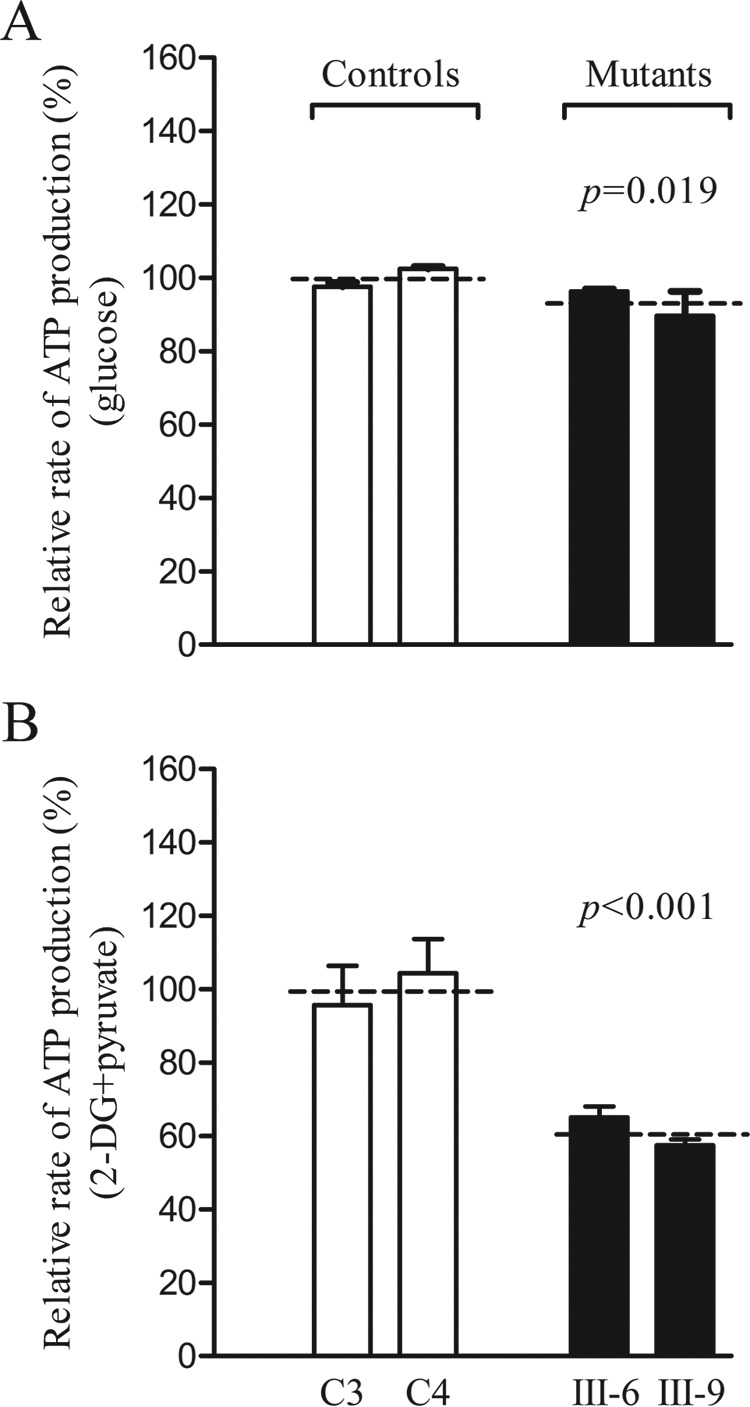
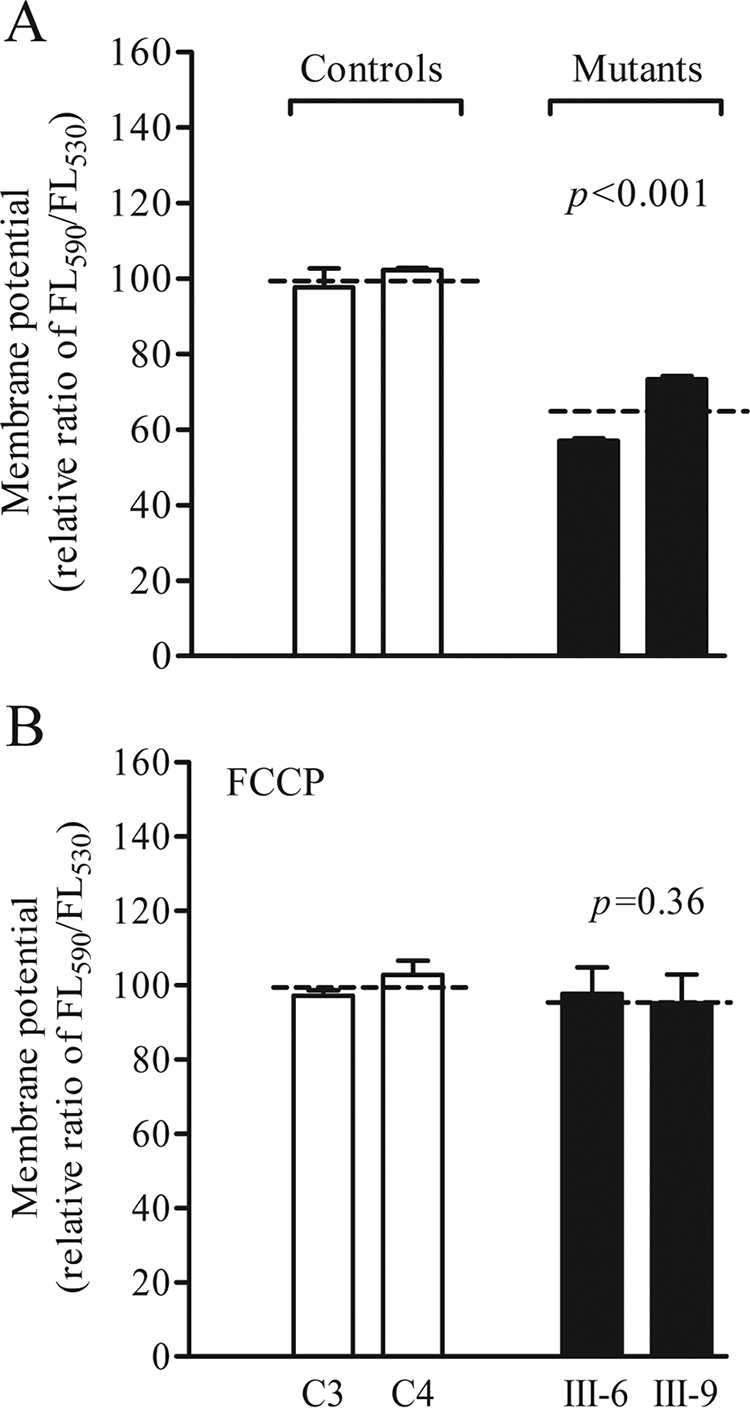
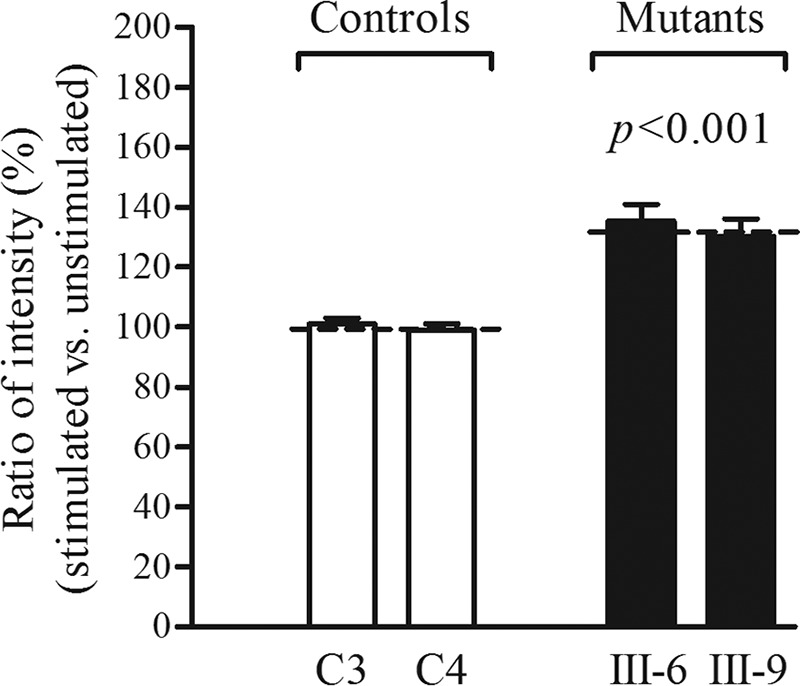
Several mitochondrial tRNA mutations have been associated with maternally inherited diabetes and deafness. However, the pathophysiology of these tRNA mutations remains poorly understood. In this report, we identified the novel homoplasmic 14692A→G mutation in the mitochondrial tRNAGlu gene among three Han Chinese families with maternally inherited diabetes and deafness. The m.14692A→G mutation affected a highly conserved uridine at position 55 of the TΨC loop of tRNAGlu The uridine is modified to pseudouridine (Ψ55), which plays an important role in the structure and function of this tRNA. Using lymphoblastoid cell lines derived from a Chinese family, we demonstrated that the m.14692A→G mutation caused loss of Ψ55 modification and increased angiogenin-mediated endonucleolytic cleavage in mutant tRNAGlu The destabilization of base-pairing (18A-Ψ55) caused by the m.14692A→G mutation perturbed the conformation and stability of tRNAGlu An approximately 65% decrease in the steady-state level of tRNAGlu was observed in mutant cells compared with control cells. A failure in tRNAGlu metabolism impaired mitochondrial translation, especially for polypeptides with a high proportion of glutamic acid codons such as ND1, ND6, and CO2 in mutant cells. An impairment of mitochondrial translation caused defective respiratory capacity, especially reducing the activities of complexes I and IV. Furthermore, marked decreases in the levels of mitochondrial ATP and membrane potential were observed in mutant cells. These mitochondrial dysfunctions caused an increasing production of reactive oxygen species in the mutant cells. Our findings may provide new insights into the pathophysiology of maternally inherited diabetes and deafness, which is primarily manifested by the deficient nucleotide modification of mitochondrial tRNAGlu.
Keywords: diabetes; hearing; mitochondrial disease; mtDNA; mutant; pathogenesis; posttranslational modification (PTM); tRNA.
© 2016 by The American Society for Biochemistry and Molecular Biology, Inc.
Figures
Similar articles
-
Contribution of the tRNAIle 4317A→G mutation to the phenotypic manifestation of the deafness-associated mitochondrial 12S rRNA 1555A→G mutation.J Biol Chem. 2018 Mar 2;293(9):3321-3334. doi: 10.1074/jbc.RA117.000530. Epub 2018 Jan 18. J Biol Chem. 2018. PMID: 29348176 Free PMC article.
-
A hypertension-associated mitochondrial DNA mutation alters the tertiary interaction and function of tRNALeu(UUR).J Biol Chem. 2017 Aug 25;292(34):13934-13946. doi: 10.1074/jbc.M117.787028. Epub 2017 Jul 5. J Biol Chem. 2017. PMID: 28679533 Free PMC article.
-
Variants in mitochondrial tRNAGlu, tRNAArg, and tRNAThr may influence the phenotypic manifestation of deafness-associated 12S rRNA A1555G mutation in three Han Chinese families with hearing loss.Am J Med Genet A. 2006 Oct 15;140(20):2188-97. doi: 10.1002/ajmg.a.31434. Am J Med Genet A. 2006. PMID: 16955413
-
Maternally inherited diabetes and deafness (MIDD): a distinct subtype of diabetes associated with a mitochondrial tRNA(Leu)(UUR) gene point mutation.Muscle Nerve Suppl. 1995;3:S124-30. doi: 10.1002/mus.880181425. Muscle Nerve Suppl. 1995. PMID: 7603513 Review.
-
[Mutations of mitochondrial tRNASer(UCN) and their connection with hearing loss].Zhonghua Yi Xue Yi Chuan Xue Za Zhi. 2017 Feb 10;34(1):128-132. doi: 10.3760/cma.j.issn.1003-9406.2017.01.030. Zhonghua Yi Xue Yi Chuan Xue Za Zhi. 2017. PMID: 28186612 Review. Chinese.
Cited by
-
Identification of a Novel Mitochondrial tRNA Mutation in Chinese Family with Type 2 Diabetes Mellitus.Pharmgenomics Pers Med. 2024 Apr 17;17:149-161. doi: 10.2147/PGPM.S438978. eCollection 2024. Pharmgenomics Pers Med. 2024. PMID: 38645701 Free PMC article.
-
Obesity associated with a novel mitochondrial tRNACys 5802A>G mutation in a Chinese family.Biosci Rep. 2020 Jan 31;40(1):BSR20192153. doi: 10.1042/BSR20192153. Biosci Rep. 2020. PMID: 31868206 Free PMC article.
-
Deletion of Mtu1 (Trmu) in zebrafish revealed the essential role of tRNA modification in mitochondrial biogenesis and hearing function.Nucleic Acids Res. 2018 Nov 16;46(20):10930-10945. doi: 10.1093/nar/gky758. Nucleic Acids Res. 2018. PMID: 30137487 Free PMC article.
-
Contribution of the tRNAIle 4317A→G mutation to the phenotypic manifestation of the deafness-associated mitochondrial 12S rRNA 1555A→G mutation.J Biol Chem. 2018 Mar 2;293(9):3321-3334. doi: 10.1074/jbc.RA117.000530. Epub 2018 Jan 18. J Biol Chem. 2018. PMID: 29348176 Free PMC article.
-
A prion accelerates proliferation at the expense of lifespan.Elife. 2021 Sep 15;10:e60917. doi: 10.7554/eLife.60917. Elife. 2021. PMID: 34545808 Free PMC article.
References
-
- Morton C. C. (2002) Genetics, genomics and gene discovery in the auditory system. Hum. Mol. Genet. 11, 1229–1240 - PubMed
-
- Thomas F., Balkau B., Vauzelle-Kervroedan F., and Papoz L. (1994) Maternal effect and familial aggregation in NIDDM: the CODIAB study: CODIAB-INSERM-ZENECA Study Group. Diabetes 43, 63–67 - PubMed
-
- Maassen J. A., 'T Hart L. M., Van Essen E., Heine R. J., Nijpels G., Jahangir Tafrechi R. S., Raap A. K., Janssen G. M., and Lemkes H. H. (2004) Mitochondrial diabetes: molecular mechanisms and clinical presentation. Diabetes 53, S103–S109 - PubMed
-
- Guillausseau P.-J., Massin P., Dubois-LaForgue D., Timsit J., Virally M., Gin H., Bertin E., Blickle J.-F., Bouhanick B., Cahen J., Caillat-Zucman S., Charpentier G., Chedin P., Derrien C., Ducluzeau P. H., et al. (2001) Maternally inherited diabetes and deafness: a multicenter study. Ann. Intern. Med. 134, 721–728 - PubMed
-
- Ballinger S. W., Shoffner J. M., Hedaya E. V., Trounce I., Polak M. A., Koontz D. A., and Wallace D. C. (1992) Maternally transmitted diabetes and deafness associated with a 10.4 kb mitochondrial DNA deletion. Nat. Genet. 1, 11–15 - PubMed
MeSH terms
Substances
LinkOut - more resources
Full Text Sources
Other Literature Sources
Medical
