. 2016 Aug 30;113(35):E5192-201.
doi: 10.1073/pnas.1603435113. Epub 2016 Aug 12.

p53 down-regulates SARS coronavirus replication and is targeted by the SARS-unique domain and PLpro via E3 ubiquitin ligase RCHY1

Affiliations

p53 down-regulates SARS coronavirus replication and is targeted by the SARS-unique domain and PLpro via E3 ubiquitin ligase RCHY1

Yue Ma-Lauer et al. Proc Natl Acad Sci U S A. .

Abstract

Highly pathogenic severe acute respiratory syndrome coronavirus (SARS-CoV) has developed strategies to inhibit host immune recognition. We identify cellular E3 ubiquitin ligase ring-finger and CHY zinc-finger domain-containing 1 (RCHY1) as an interacting partner of the viral SARS-unique domain (SUD) and papain-like protease (PL(pro)), and, as a consequence, the involvement of cellular p53 as antagonist of coronaviral replication. Residues 95-144 of RCHY1 and 389-652 of SUD (SUD-NM) subdomains are crucial for interaction. Association with SUD increases the stability of RCHY1 and augments RCHY1-mediated ubiquitination as well as degradation of p53. The calcium/calmodulin-dependent protein kinase II delta (CAMK2D), which normally influences RCHY1 stability by phosphorylation, also binds to SUD. In vivo phosphorylation shows that SUD does not regulate phosphorylation of RCHY1 via CAMK2D. Similarly to SUD, the PL(pro)s from SARS-CoV, MERS-CoV, and HCoV-NL63 physically interact with and stabilize RCHY1, and thus trigger degradation of endogenous p53. The SARS-CoV papain-like protease is encoded next to SUD within nonstructural protein 3. A SUD-PL(pro) fusion interacts with RCHY1 more intensively and causes stronger p53 degradation than SARS-CoV PL(pro) alone. We show that p53 inhibits replication of infectious SARS-CoV as well as of replicons and human coronavirus NL63. Hence, human coronaviruses antagonize the viral inhibitor p53 via stabilizing RCHY1 and promoting RCHY1-mediated p53 degradation. SUD functions as an enhancer to strengthen interaction between RCHY1 and nonstructural protein 3, leading to a further increase in in p53 degradation. The significance of these findings is that down-regulation of p53 as a major player in antiviral innate immunity provides a long-sought explanation for delayed activities of respective genes.

Keywords: E3 ubiquitin ligase RCHY1; SARS-CoV SUD; coronavirus replication; p53 antiviral activity; papain-like protease.


Conflict of interest statement

The authors declare no conflict of interest.

Figures

Fig. 1.
Fig. 1.
Interactions among SUD, RCHY1, and CAMK2D. Affinity-enrichment mass spectrometry screen (A–C): SUD with a C- or N-terminal GFP tag was recombinantly expressed in HEK293 cells and enriched from cell lysates using GFP-trap agarose beads (ChromoTek). Volcano plots show enrichment factors of all quantified proteins in C-terminally (A) or N-terminally (B) tagged SUD-expressing samples over vector-only controls, plotted against P values determined from a two-sample t test between three replicates each. Significance curves were determined as described (36) using c = 0.5 and x0 = 0.5 cutoff parameters. (C) Label-free quantification intensities of selected proteins across all samples. To calculate enrichment factors, missing quantifications were imputed with noise simulating the detection limit (35). (D) Split YFP: YFPN (YFP N-terminal fragment, amino acids 1–155) was fused to the N terminus of RCHY1, and YFPC (YFP C-terminal fragment, amino acids 156–239) was fused to the N terminus of SUD. At 24 h after cotransfection of both plasmids into HEK-293 cells, strong YFP signal was detected in the cytosol. Negative controls are YFPN–RCHY1 in combination with YFPC vector and YFPC–SUD in combination with YFPN vector. (E) Split YFP: YFPN was fused to the N terminus of CAMK2D, and YFPC was fused to the C terminus of SUD. At 24 h after cotransfection, clear YFP signal was detected in the cytosol of HEK293 cells. (F) Co-IP: plasmids expressing the indicated genes were transfected into HEK293 cells grown in 10-cm dishes. At 24 h after transfection, cells were lysed and the lysates were purified with GFP-trap consisting of agarose beads coated with anti-GFP antibodies. IP samples were analyzed by 12% (wt/vol) SDS/PAGE and Western blotting (WB) with anti–SARS-CoV Nsp3, anti-HA, and anti-GFP antibodies. (G) Co-IP: plasmids expressing CAMK2D–HA fusion together with plasmids expressing GFP or GFP–SUD were cotransfected into HEK293 cells grown in 10-cm dishes. At 24 h after transfection, cells were lysed. The lysates were purified with GFP-trap and subsequently analyzed by WB with anti-HA and anti-GFP antibodies.
Fig. S1.
Fig. S1.
SUD interacts with RCHY1 in F3H assay. SUD protein tagged with NLS-GFP are captured at the lacO array by the coexpressed GBP–LacI fusion and visualized as a green spot with fluorescence microscopy. The NLS-RFP–tagged RCHY1 protein colocalizes with the SUD protein at the lacO spot, indicating an interaction between these two proteins (Top, lacO spot is marked with filled arrowhead). In the absence of either SUD (Middle) or RCHY1 (Bottom), the RFP fusions are not recruited to the lacO spot (open arrowhead), demonstrating the specificity of this interaction assay. The nucleus was stained with DAPI. (Scale bar: 5 μm.)
Fig. 2.
Fig. 2.
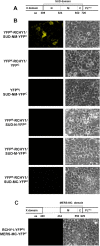
RCHY1 amino acids 95–144 and SUD-NM are crucial for interaction. (A) Scheme of RCHY1. (B) Split YFP: YFPN was fused to the N terminus of truncated RCHY1 fragments, and YFPC was fused to the C terminus of SUD. At 24 h after transfection of the expression plasmids into HEK293 cells, YFP signal was examined by fluorescence microscopy.
Fig. S2.
Fig. S2.
SUD-NM interacts with RCHY1. At 24 h posttransfection of the expression plasmids into HEK293 cells, YFP signal was examined by fluorescence microscopy. (A) Scheme of SUD location within SARS nsp3, which consists of 1,922 amino acids. (B) YFPN was fused to the N terminus of RCHY1, and YFPC was fused to the C terminus of truncated SUD fragments. (C) YFPN was fused to the C terminus of RCHY1, and YFPC was fused to the C terminus of MERS-MC domain, i.e., SUD-like domain (schematically presented in Upper).
Fig. S3.
Fig. S3.
Alignment of SUD with MERS homolog. The figure was created by using the program ESPript. SARS-CoV-SUD-N subdomain is indicated in blue; SARS-CoV-SUD-M subdomain and MERS-CoV-SUD-M homolog are indicated in black; SARS-CoV-SUD-C subdomain and MERS-CoV-SUD-C homolog are indicated in green. SLD, SUD-like domain.
Fig. 3.
Fig. 3.
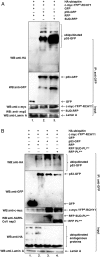
SUD augments p53 ubiquitination and stabilizes RCHY1. (A) Plasmids expressing HA-tagged ubiquitin, c-Myc-tagged YFPN-RCHY1, GFP or p53–GFP fusion, and RFP or SUD–RFP fusion were cotransfected into HEK293 cells growing in 10-cm dishes. At 24 h after transfection, cells were lysed and the lysates were purified with GFP-trap consisting of beads coated with anti-GFP antibodies. The samples of IP and input were analyzed by 12% (wt/vol) SDS/PAGE and WB with anti-HA, anti-GFP, anti–SARS-CoV Nsp3, anti-Myc, and anti-lamin A antibodies. (B) Plasmids expressing indicated proteins were cotransfected into HEK293 cells growing in 10-cm dishes. The in vivo ubiquitination assay was carried out as described in A.
Fig. 4.
Fig. 4.
SUD does not interfere with phosphorylation of RCHY1 and stabilizes it. (A) The indicated plasmids were cotransfected into HEK293 cells growing in 10-cm dishes. At 20 h posttransfection, PMA to a final concentration of 20 ng/mL and ionomycin to a final concentration of 1 µM were added to the cells. Two hours after the treatment, cells were lysed and the lysates were purified with GFP-trap. The samples of IP and input were analyzed by 12% (wt/vol) SDS/PAGE/WB and probed with anti–phospho-Ser/Thr, anti-GFP, anti-HA, anti-Myc, and anti–SARS-CoV Nsp3 antibodies. (B) Plasmids expressing RCHY1–RFP and plasmids ectopically expressing SUD were cotransfected into HEK293 cells grown on coverslips in a 24-well plate. At 24 h after transfection, cells were fixed with 2% (wt/vol) paraformaldehyde (PFA) and stained with DAPI. The samples were finally examined with a fluorescent microscope (Leica DM4000 B; 10× objective). A representative area of pictures taken randomly is shown. (C) Split-YFP plasmids expressing Myc-YFPN–RCHY1 and expressing YFPC or SUD–YFPC were transfected to HEK293 cells growing in a six-well plate. At 24 h after transfection, cells were lysed. The lysates were Western blotted with anti-Myc and anti-lamin A antibodies. (D) YFPN was fused to the N terminus of RCHY1 amino acids 1–144, and YFPC was fused to the N terminus of p53. Split-YFP fluorescence microscopy was performed as described before. (E) The 300-ng plasmids ectopically expressing RFP or p53-RFP together with 100-ng plasmids expressing YFPN–RCHY1 and YFPC–SUD were cotransfected into HEK293 cells growing on coverslips in a 24-well plate. The split-YFP experiment was carried out as described before. (F) Indicated plasmids were transfected into HEK293 cells growing in 10-cm culture dishes. The GFP-trap-based coIP was performed as described before.
Fig. 5.
Fig. 5.
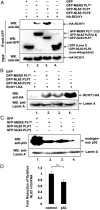
SARS PLpro interacts with RCHY1 and leads to accumulation of RCHY1 as well as p53 degradation. (A) YFPN and YFPC were fused to the N terminus of SARS PLpro and to the N terminus of RCHY1, respectively. At 24 h after transfection, HEK293 cells were fixed with PFA and stained with DAPI. Samples were inspected with a fluorescent microscope (Leica DM4000 B, 40× objective; Upper). Pictures for statistical analysis were taken from at least five randomly chosen areas. Intensities of split-YFP and DAPI signals were measured with ImageJ software (***P < 0.001; Lower). (B) Plasmids expressing HA-tagged SARS PLpro and GFP or GFP–RCHY1 fusion were transfected into HEK293 cells grown in 10-cm culture dishes. The coIP assay was performed as described before. (C) WB (Upper) Plasmids ectopically expressing SUD, PLpro, or SUD–PLpro fusion were transfected into HEK293 cells grown in a six-well plate. Cell lysates were prepared 24 h posttransfection and subjected to Western blotting with anti-Myc and anti-lamin A antibodies. qPCR: (Lower) Plasmids ectopically expressing SUD, PLpro, or SUD–PLpro fusion were transfected into HEK293 cells grown in a 24-well plate. At 24 h posttransfection, cells were harvested for total RNA extraction, first cDNA synthesis, and subsequent SYBR Green qPCR. The experiment was carried out in quadruplicates. (D) Indicated plasmids were transfected into HEK293 cells grown in a six-well plate. At 24 h posttransfection, cells were lysed for Western blotting with anti-p53 and anti-lamin A antibodies.
Fig. S4.
Fig. S4.
(A) In vitro deubiquitination assay of RCHY1 by SARS-CoV PLpro proteins without (lane 2) and with HIS tag (lane 3). HEK293 cells were cotransfected with GFP–RCHY1, HA-ubiquitin, camodulin1-RFP, and CAMK2D–MycYFP N-expression fusion. At 23 h after transfection, cells were treated with PMA and ionomycin to activate CAMK2D for induction of RCHY1 ubiquitination. Ninety minutes after the treatment, cells were harvested and GFP–RCHY1 protein was purified with GFP-trap_A beads. The purified beads-bound GFP–RCHY1 was subsequently incubated with 10 µM SARS PLpro proteins at 25 °C for 30 min in a buffer containing 10 mM Tris⋅Cl (pH 7.5), 150 mM NaCl, 0.5 mM EDTA, and 2 µM DTT. After incubation, beads were washed twice with washing buffer. The beads-bound GFP–RCHY1 were finally examined with anti-HA and anti-GFP antibodies in Western blot. (B) Deubiquitination assay of the SARS-CoV PLpro. The deubiquitination kinetic assay of the SARS-CoV PLpro was performed in 20 mM Tris⋅HCl, 150 mM NaCl (pH 7.9), 2 mM DTT at 25 °C. The reaction volume was 50 µL. The 0.025-μM SARS-CoV PLpro was used with different concentrations (1, 2, 4, 8 μM) of the fluorogenic substrate uniquitin-7-amino-4-methylcoumarin (AMC; Boston Biochem). The fluorescence signal generated by AMC release was measured using an Flx800 fluorescence spectrophotometer (BioTek; λex: 360 nm; λem: 460 nm). Reactions were started by adding the protease. A calibration curve was generated via measuring the fluorescence of free AMC in the reaction buffer. Saturation was not observed within a reasonable time unless the ratio of protein to substrate was 1:1 or larger. However, the data could be fit to the Michaelis–Menten equation using the GraphPad Prism program (GraphPad Software). The kinetic assay was performed in duplicates. v, reaction rate (µm-1⋅min-1); [E], enzyme concentration (µM).
Fig. 6.
Fig. 6.
p53 inhibits replication of a SARS-CoV. (A and B) Increased SARS-CoV growth in p53−/− ACE2-transgenic HCT116 cells. HCT116/ACE2 with p53 (+/+) and without p53 (−/−) were seeded at 2 × 10⁵ cells per mL. After 24 h, cells were infected in quadruplicate with SARS-CoV (Frankfurt) and VSV (Indiana) at an MOI of 0.001. After 1 h at 37 °C, cells were washed with PBS and McCoy culture medium was replenished. Samples were taken at 0 and 24 h postinfection. Viral RNA was extracted by a Macherey-Nagel viral RNA kit. Real-time PCR was performed using virus-specific probes and primers with the One-Step SuperScript III Kit (Life Technologies) according to previous protocols. (C and D) HCT116 wild-type (p53+/+) and knockout cells (p53−/−) were transfected with HCoV SARS DNA and RNA replicons. p53 expression in SW480 cells was induced by adding 100 ng/mL DOX (DOX+) 24 h before transfection. SW480 cells without DOX induction (DOX−) were applied as control. pBAC-SARS-Rep-R(enilla)Luc DNA was transfected into cells using Lipofectamine 3000, and Renilla luciferase activity was measured from cell lysates after 24 h. The pBAC-SARS-Rep-M(etridia)Luc RNA was cotransfected with N-RNA by electroporation of cells, and Metridian luciferase activity was determined from medium supernatant after 20 h (*P < 0.05, **P < 0.01, ***P < 0.001).
Fig. S5.
Fig. S5.
Characterization of p53 expression in HCT116 p53+/+, p53−/−, and SW480pRTRp53 cells. (A) WB of HEK293 and HCT116p53+/+ and p53−/− cells demonstrating lack of expression in p53- negative cells. (B) WB of SW480 pRTR cells containing mutated, nonfunctional p53 (single band at 0 h and lower band at 24 h post-DOX induction. The upper band at 24 h + DOX (arrow) represents induced functional p53 protein. (C) Fluorescence analysis of WB of SW480 pRTR cells. Functional p53 and GFP are both controlled by the DOX promotor. Expression of both proteins is thus induced by DOX. Conditional expression system: the cell lines SW480 and HCT116 p53+/+, p53/− (44) were kept in DMEM and McCoy’s medium, respectively. The pRTR vector (69) harboring a p53–VSV construct is described in ref. . Polyclonal SW480/pRTR-p53-VSV cell pools for conditional p53 expression were generated by transfection of the episomal pRTR-p53-VSV expression vector using FuGENE (Roche) and subsequent selection in 2 µg/mL puromycin (Sigma) for 10 d. The percentage of GFP-positive cells was determined 24 h after addition of DOX (Sigma) at a final concentration of 100 ng/mL.
Fig. S6.
Fig. S6.
p53 pressure down-regulates SARS-CoV replicon. Plasmid pBAC-SARS-Rep-R(enilla)luc was used to check the efficiency of genome replication of SARS-CoV replicon under the pressure of p53. pcDNA3.0 RLuc was applied as a control reporter. Effector plasmids were HA-tagged p53 and/or empty HA vectors. The 80-ng reporter plasmids and indicated amount of effector plasmids were cotransfected into HEK293 cells grown in 96-well plates. At 24 h posttransfection, luciferase activity was measured from cell extracts. Experiments were performed in quadruplicates.
Fig. 7.
Fig. 7.
MERS PLpro and NL63 PLP1/2 lead to accumulation of RCHY1 and p53 degradation. (A) The indicated plasmids were transfected to HEK293 cells growing in 10-cm culture dishes. CoIP was performed as described before. (B) The indicated plasmids were transfected to HEK293 cells growing in a six-well plate. At 24 h posttransfection, cells were lysed. The lysates were Western blotted with anti-HA and anti-lamin A antibodies. (C) At 24 h after transfection with the indicated plasmids into HEK293, cells were harvested and Western blotted with anti-p53 and anti-lamin A antibodies. (D) HEK293 cells were cotransfected with plasmids overexpressing RFP-ACE2 and plasmids overexpressing GFP control or p53-GFP. At 24 h after transfection, cells were inoculated with NL63 viruses of MOI 0.4 at 37 °C for 1 h. At 24 h after infection with NL63 virus, total RNA was extracted from cell lysates. Viral RNA was analyzed by qPCR with NL63-specific primers and standardized with RFP-ACE2 intensity. Experiments were performed in sextuplicates. ***P < 0.001.
Fig. S7.
Fig. S7.
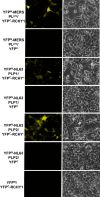
Split YFP interaction assay of MERS PLpro and NL63 PLP1/2 with RCHY1. YFPN was fused at the N terminus of MERS PLpro and NL63 PLP1/2, whereas YFPC was fused at the N terminus of RCHY1. The split-YFP assay was carried out in HEK293 cells as described above.

References

    1. Stadler K, et al. SARS--beginning to understand a new virus. Nat Rev Microbiol. 2003;1(3):209–218. - PMC - PubMed
    1. Hilgenfeld R, Peiris M. From SARS to MERS: 10 years of research on highly pathogenic human coronaviruses. Antiviral Res. 2013;100(1):286–295. - PMC - PubMed
    1. Graham RL, Donaldson EF, Baric RS. A decade after SARS: Strategies for controlling emerging coronaviruses. Nat Rev Microbiol. 2013;11(12):836–848. - PMC - PubMed
    1. Ma-Lauer Y, Lei J, Hilgenfeld R, von Brunn A. Virus-host interactomes--antiviral drug discovery. Curr Opin Virol. 2012;2(5):614–621. - PMC - PubMed
    1. Báez-Santos YM, St John SE, Mesecar AD. The SARS-coronavirus papain-like protease: Structure, function and inhibition by designed antiviral compounds. Antiviral Res. 2015;115:21–38. - PMC - PubMed

Publication types

MeSH terms

Substances