. 2016 Oct:171:1-11.
doi: 10.1016/j.clim.2016.08.009. Epub 2016 Aug 9.

Eosinophil peroxidase activates cells by HER2 receptor engagement and β1-integrin clustering with downstream MAPK cell signaling

Affiliations

Eosinophil peroxidase activates cells by HER2 receptor engagement and β1-integrin clustering with downstream MAPK cell signaling

Kerrie Hennigan et al. Clin Immunol. 2016 Oct.

Abstract

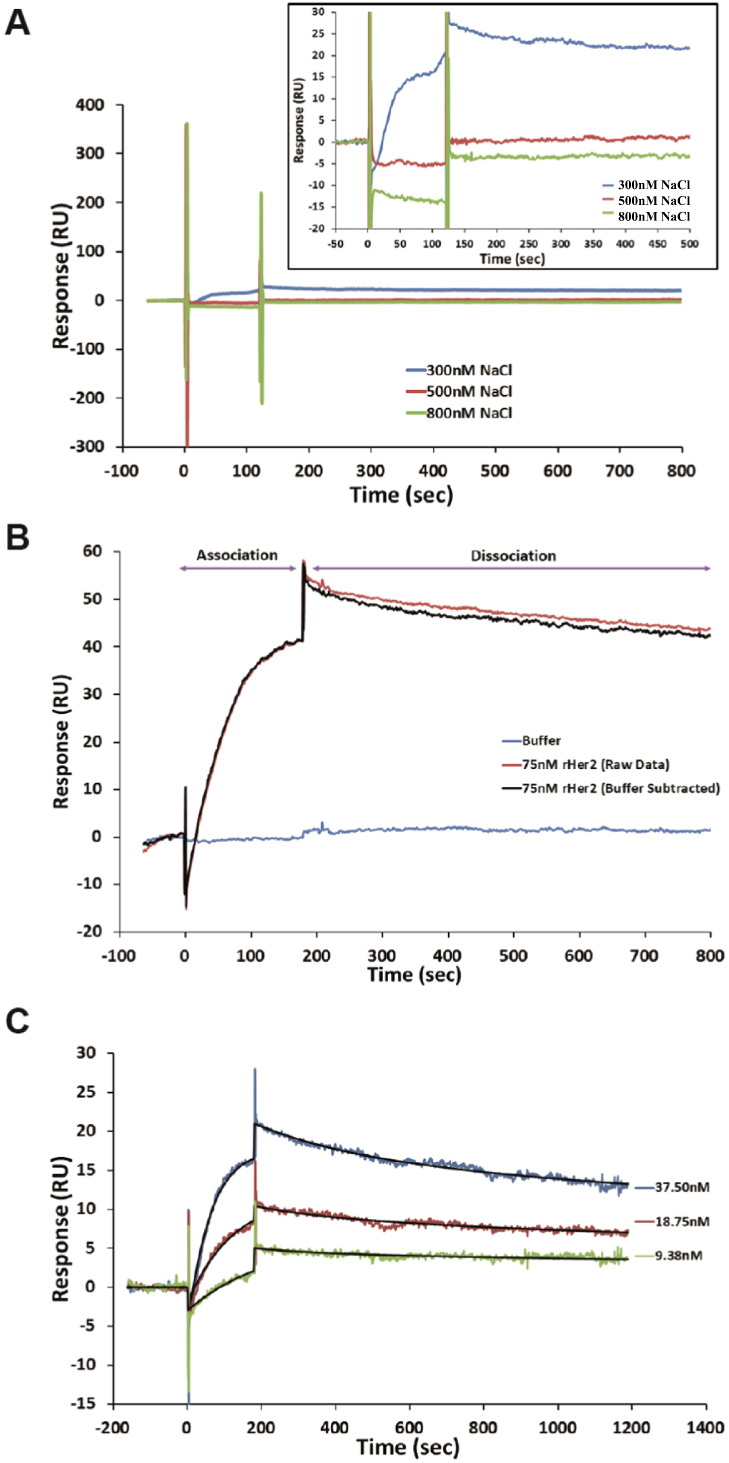
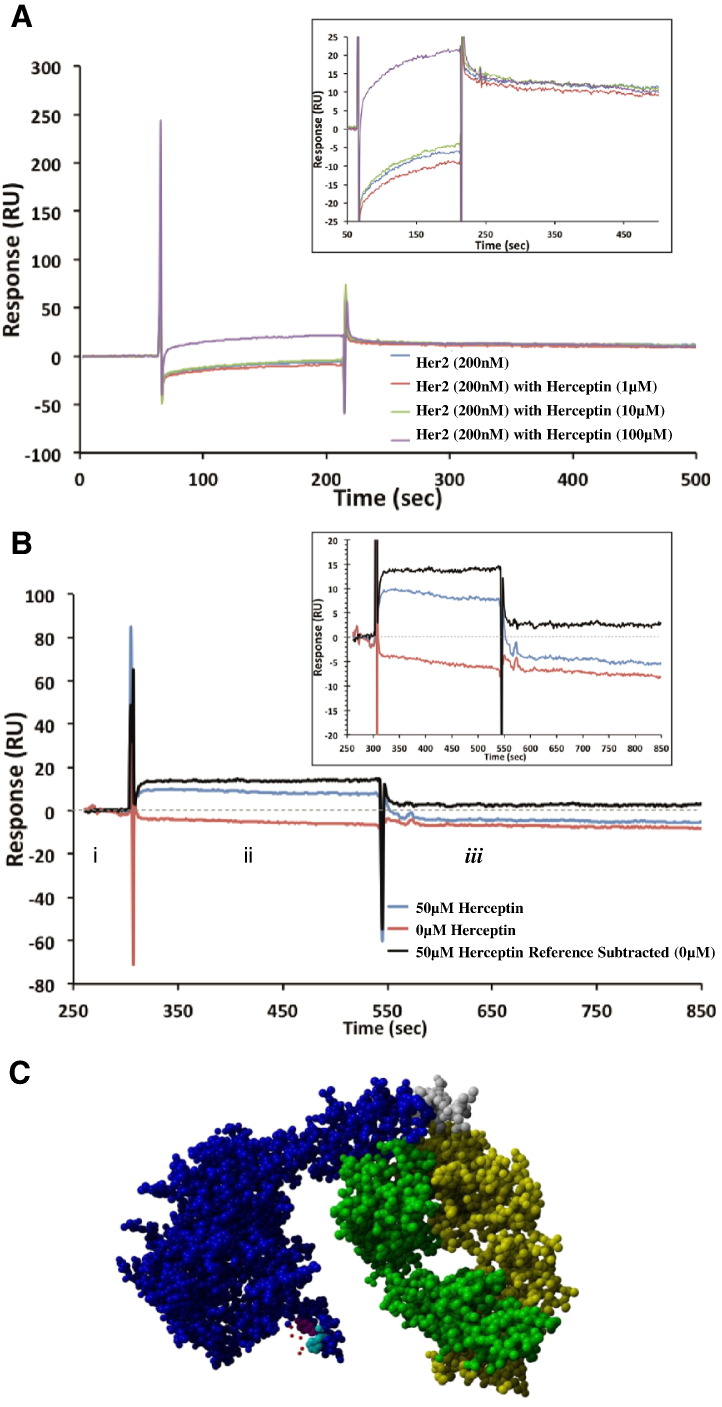
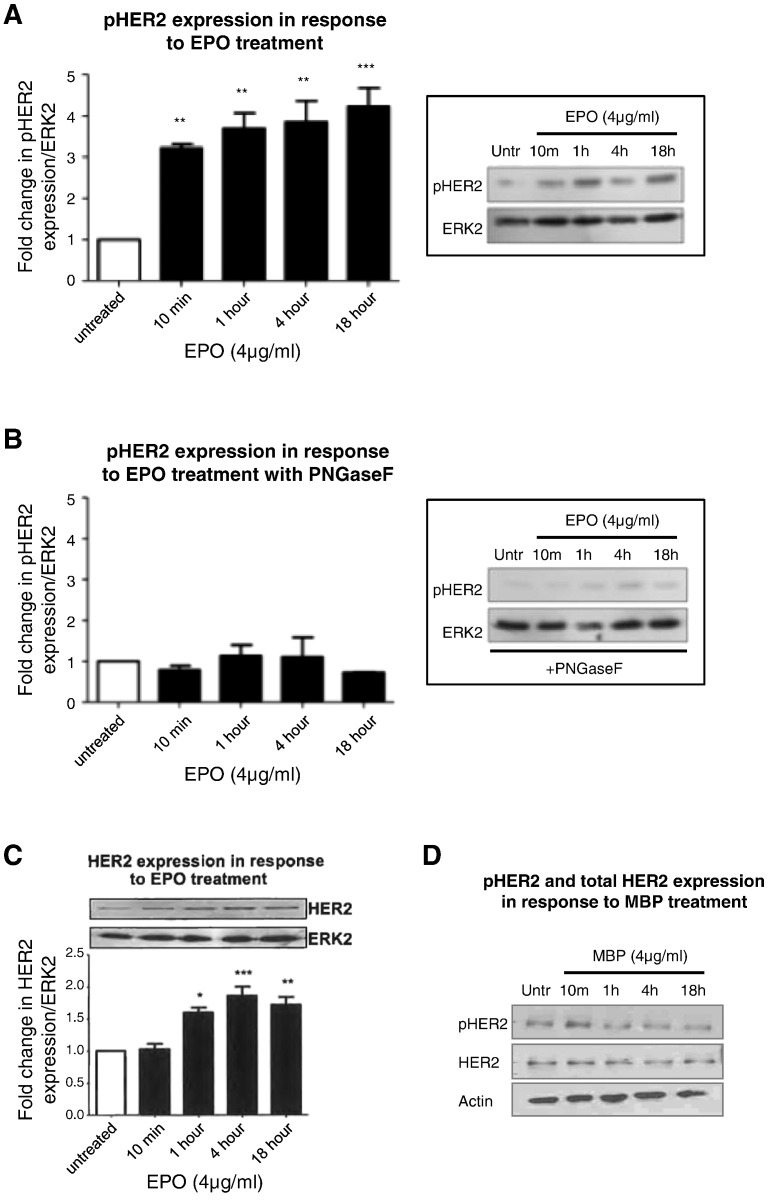
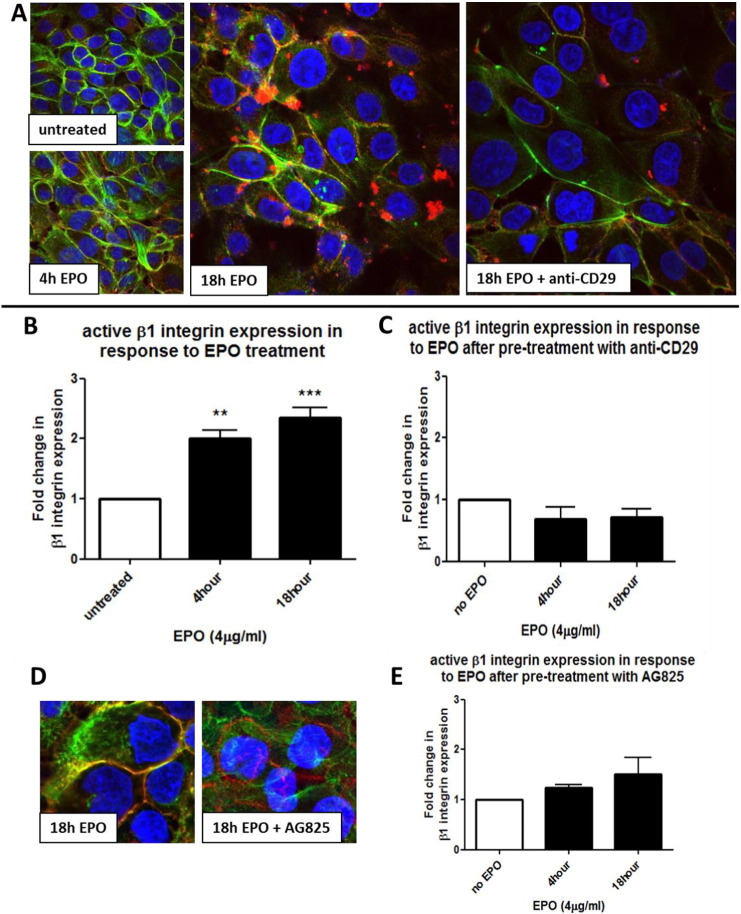
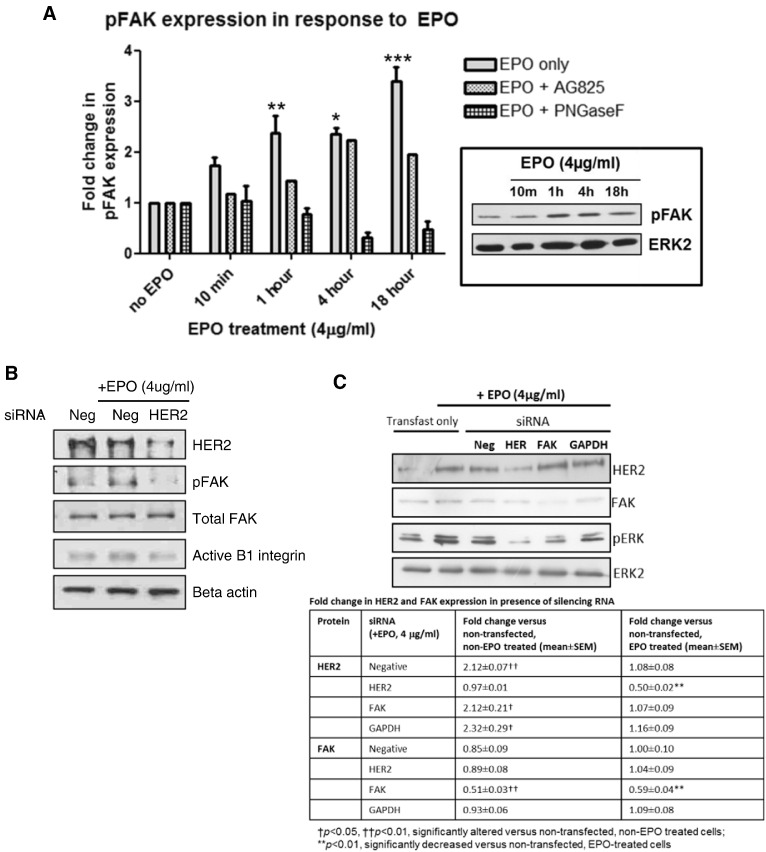
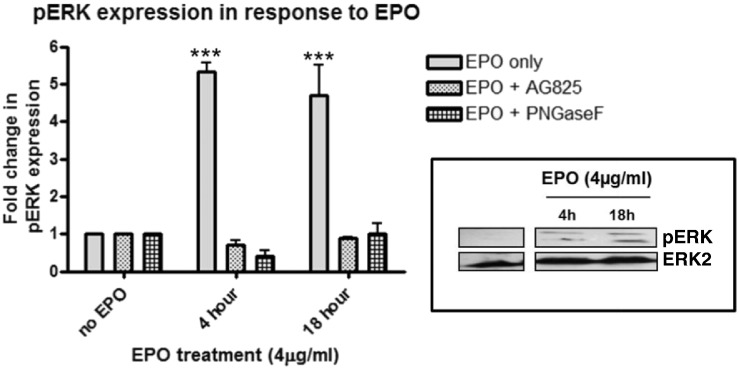
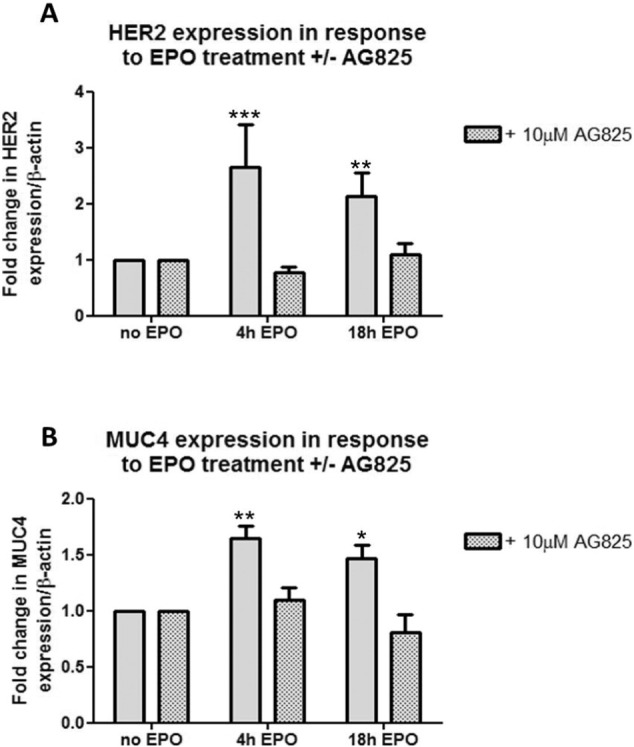
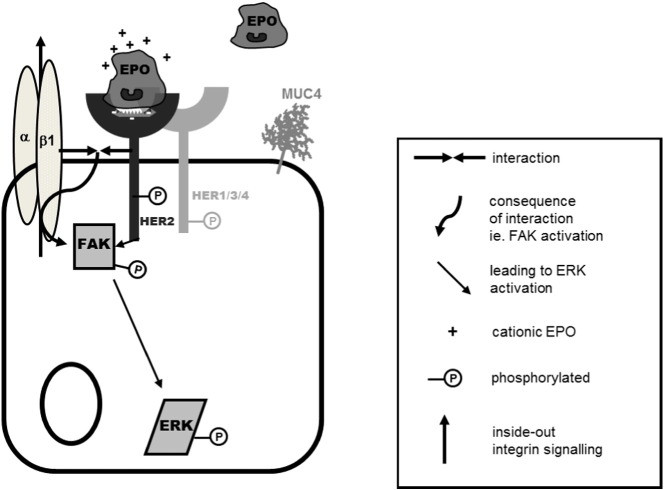
Eosinophils account for 1-3% of peripheral blood leukocytes and accumulate at sites of allergic inflammation, where they play a pathogenic role. Studies have shown that treatment with mepolizumab (an anti-IL-5 monoclonal antibody) is beneficial to patients with severe eosinophilic asthma, however, the mechanism of precisely how eosinophils mediate these pathogenic effects is uncertain. Eosinophils contain several cationic granule proteins, including Eosinophil Peroxidase (EPO). The main significance of this work is the discovery of EPO as a novel ligand for the HER2 receptor. Following HER2 activation, EPO induces activation of FAK and subsequent activation of β1-integrin, via inside-out signaling. This complex results in downstream activation of ERK1/2 and a sustained up regulation of both MUC4 and the HER2 receptor. These data identify a receptor for one of the eosinophil granule proteins and demonstrate a potential explanation of the proliferative effects of eosinophils.

Keywords: Eosinophil peroxidase; HER2; MUC4; β1-integrin.


Figures

Fig. 1
Fig. 1
Analysis of the interaction between EPO and rHER2 on Biacore The analysis was carried out on immobilized EPO. (A) Double reference subtracted binding of 75 nM rHER2 to EPO was performed over a range of salt concentrations (300–800 mM). The binding of rHER2 was diminished between 300 and 500 mM NaCl suggesting the importance of charge for the interaction. The overlay box shows an expansion of each sample. In (B) the binding profile for rHER2 in HBS-EP+ is shown. The red trace is the 75 nm rHER2 and the blue trace 0 nM (buffer only) raw data (online reference cell subtracted). The black trace is the double reference subtracted data (75 nM rHER2 minus 0 nM response). (C) Kinetic analysis of three HER2 concentrations (double reference subtracted data shown) is fitted with a bivalent analyte model (black line) with local Rmax fitting. The kinetic evaluation suggested ka1 = 1.29 × 105 M− 1 s− 1, kd1 = 2.03 × 10− 3 s− 1.
Fig. 2
Fig. 2
Assessment of interaction of EPO-rHER2 and Herceptin (A) Competitive binding profiles for EPO to rHER2 with incubation for 1 h with an excess of Herceptin. No diminishment of binding for EPO was observed in comparison to rHER2 with zero Herceptin. The overlay box shows an expansion of each sample. (B) Sequential injection of rHER2 across EPO (i) followed by Herceptin (ii) and monitoring of dissociation for 5 min (iii). The red trace is the dissociation of rHER2 from EPO (with no Herceptin) and the blue trace is the data collected after injection of Herceptin (50 μM). The black trace is the double referenced data (removing the dissociation of rHER2 from EPO). The overlay box is an expansion showing that Herceptin bound to rHER2 despite the receptor interacting with EPO. The results suggest that the binding site for EPO does not overlap with the known binding site for Herceptin (amino acid region 557–603 [37]). (C) 3D crystal structure of HER2-Herceptin complex with predicted binding site for EPO indicated. Blue and grey: extracellular domain of HER2 with grey indicating the amino acids closest to the transmembrane domain. Green and yellow: heavy and light chains of Herceptin antibody. Red: Amino acids of EPO which are predicted to interact with HER2. Magenta: HER2 amino acid 252. Cyan: HER2 amino acid 257.
Fig. 3
Fig. 3
EPO induces HER2 phosphorylation in an N-linked glycosylation-dependent mechanism (A) 16HBE14o cells were exposed to EPO (4 μg/ml) for varying times and fold change in pHER2 (at its autophosphorylation site Y1248) was assessed by Western blotting. (B) 16HBE14o cells were first pretreated with an enzyme that catalyzes the complete removal of N-linked oligosaccharide chains from glycoproteins (PNGase F, 2 U/ml, 1 h) and then exposed to EPO (4 μg/ml) for varying times. Fold change in pHER2 was assessed. (C) 16HBE14o cells were exposed to EPO (4 μg/ml) for varying times and fold change in HER2 was assessed by Western blotting. The graphs show the fold change in pHER2 (A,B) or HER2 (C) expression levels in response to EPO treatment compared to untreated cells in the absence (A,C) or presence (B) of PNGase F at the indicated times. (n = 3, mean ± sem; *p < 0.05, **p < 0.01, ***p < 0.001). (D) 16HBE14o cells were exposed to MBP (4 μg/ml) for varying times and expression of pHER2 and HER2 was assessed by Western blotting. Images are representative of n = 3 experiments.
Fig. 4
Fig. 4
EPO induces a pHER2-dependent activation of β1 integrin (A, D) 16HBE14o cells were grown on coverslips and treated with EPO (4 μg/ml) for various times or left untreated (as indicated). Some wells were pre-treated with a specific anti-β1-integrin neutralizing antibody (anti-CD29, 1 μg/ml, 2 h) or pretreated with a HER2 tyrosine kinase inhibitor (AG825, 10 μM, 2 h), as indicated on images. β1-integrin (red) was stained with a mouse integrin-β1 antibody (JB1B, Santa Cruz) and a Texas Red goat anti-mouse IgG secondary antibody. β1-integrin activation is indicated by clustering and co-localization with F-actin fibers, stained with Phalloidin (green), resulting in the orange clusters visible at 18 h EPO treatment (A). In (B) cells were treated with EPO (4 μg/ml) for varying time points, cellular protein was subjected to Western blot analysis and probed for active β1-integrin and against ERK2 for normalization. In (C) cells were first pre-treated with anti-CD29 (1 μg/ml, 2 h) and then exposed to EPO (4 μg/ml) for varying time points. Cellular protein was subjected to Western blot analysis and probed for active β1-integrin and against ERK2 for normalization. In (D) confocal microscopy images show the comparison of cells treated with EPO for 18 h in the absence or presence of AG825 (as indicated). β1-integrin (red) activation is indicated by clustering and co-localization with F-actin fibers. In (E) 16HBE14o cells were first pre-treated with AG825 (10 μM, 2 h) and then exposed to EPO (4 μg/ml) for varying time points. The graphs show the fold change in active β1-integrin expression levels in response to EPO treatment compared to untreated cells in the absence (B) or presence (C, E) of inhibitors at the indicated times. (n = 3, mean ± sem; **p < 0.01, ***p < 0.001).
Fig. 5
Fig. 5
EPO induces the activation of focal adhesion kinase (FAK) and HER2 which are required for activation of β1 integrin (A) Western blots of 16HBE14o protein from cells treated with or without EPO (4 μg/ml) at the indicated times. Some were pre-treated with the inhibitor AG825 (10 μM, 2 h) or the endoglycosidase PNGase F (2 U/ml, 1 h) (see legend) and probed with a rabbit anti-human pFAK antibody. The graphs show the fold change in pFAK expression levels in response to EPO treatment compared to untreated cells in the absence or presence of inhibitors at the indicated times. (n = 3, mean ± sem; *p < 0.05, **p < 0.01, ***p < 0.001). The blots shown are representative of 3 similar experiments. Protein levels of total FAK remain unchanged in the presence of EPO and the various inhibitors studied (data not shown). (B) Western blots of 16HBE14o cells grown in the absence or presence of EPO (4 μg/ml, 18 h) as indicated. Cells were transfected with silencing RNA (siRNA) to a scrambled negative control (Neg) or HER2. (C) Western blots of 16HBE14o cells grown in the absence or presence of EPO (4 μg/ml, 18 h) as indicated. Cells were transfected or not with siRNA to a scrambled negative control (Neg), HER2, FAK or GAPDH. Table shows the fold change in HER2 and FAK protein expression following transfection.
Fig. 6
Fig. 6
EPO induces the activation of extracellular signal-regulated kinase (ERK) via N-linked glycosylation through the initial activation of HER2 Western blots of 16HBE14o protein from cells treated with or without EPO (4 μg/ml) at the indicated times. Some were pre-treated with the inhibitor AG825 (10 μM, 2 h) or the endoglycosidase PNGase F (2 U/ml, 1 h) (see legend) and probed with a rabbit anti-human pERK antibody. The graphs show the fold change in pERK expression levels in response to EPO treatment compared to untreated cells in the absence or presence of inhibitors at the indicated times. (n = 3, mean ± sem; *p < 0.05, **p < 0.01, ***p < 0.001). The blots shown are representative of 3 similar experiments. Protein levels of total ERK remain unchanged in the presence of EPO and the various inhibitors studied (data not shown).
Fig. 7
Fig. 7
EPO induces a pHER2-dependent increase in the transcriptional levels of HER2 and MUC4 16HBE14o cells were treated with EPO (4 μg/ml) in the absence of or following pre-treatment with AG825 (10 μM, 2 h). Cellular material was harvested for RNA isolation and cDNA synthesis and Real-time PCR was performed. Graphs show the fold change in HER2 (A) or MUC4 (B) relative to β-actin expression in response to EPO (4 μg/ml) at the indicated time points compared with untreated cells (n = 3, mean ± sem; *p < 0.05, **p < 0.01, ***p < 0.001).
Fig. 8
Fig. 8
Summary diagram EPO binds to the HER2 receptor, resulting in its activation, which in turn activates FAK. FAK acts as a scaffold protein bringing together β1-integrin and the HER2 receptor with subsequent HER2-dependent, FAK-dependent β1-integrin activation. EPO also induces a pHER2-dependent, FAK-dependent activation of ERK 1/2.

Similar articles

Cited by

References

    1. Bousquet J., Chanez P., Lacoste J.Y., Barneon G., Ghavanian N., Enander I., Venge P., Ahlstedt S., Simony-Lafontaine J., Godard P. Eosinophilic inflammation in asthma. N. Engl. J. Med. 1990;323:1033–1039. - PubMed
    1. Kay A.B. Eosinophils and asthma. N. Engl. J. Med. 1991;324:1514–1515. - PubMed
    1. Saeed W., Badar A., Hussain M.M., Aslam M. Eosinophils and eosinophil products in asthma. J. Ayub Med. Coll. Abbottabad. 2002;14:49–55. - PubMed
    1. Costello R.W., Schofield B.H., Kephart G.M., Gleich G.J., Jacoby D.B., Fryer A.D. Localization of eosinophils to airway nerves and effect on neuronal M2 muscarinic receptor function. Am. J. Phys. 1997;273:L93–103. - PubMed
    1. Evans C.M., Fryer A.D., Jacoby D.B., Gleich G.J., Costello R.W. Pretreatment with antibody to eosinophil major basic protein prevents hyperresponsiveness by protecting neuronal M2 muscarinic receptors in antigen-challenged guinea pigs. J. Clin. Invest. 1997;100:2254–2262. - PMC - PubMed

MeSH terms