. 2016 Aug 12;16(1):97.
doi: 10.1186/s12874-016-0196-1.

Modelling multiple thresholds in meta-analysis of diagnostic test accuracy studies

Affiliations

Modelling multiple thresholds in meta-analysis of diagnostic test accuracy studies

Susanne Steinhauser et al. BMC Med Res Methodol. .

Abstract

Background: In meta-analyses of diagnostic test accuracy, routinely only one pair of sensitivity and specificity per study is used. However, for tests based on a biomarker or a questionnaire often more than one threshold and the corresponding values of true positives, true negatives, false positives and false negatives are known.

Methods: We present a new meta-analysis approach using this additional information. It is based on the idea of estimating the distribution functions of the underlying biomarker or questionnaire within the non-diseased and diseased individuals. Assuming a normal or logistic distribution, we estimate the distribution parameters in both groups applying a linear mixed effects model to the transformed data. The model accounts for across-study heterogeneity and dependence of sensitivity and specificity. In addition, a simulation study is presented.

Results: We obtain a summary receiver operating characteristic (SROC) curve as well as the pooled sensitivity and specificity at every specific threshold. Furthermore, the determination of an optimal threshold across studies is possible through maximization of the Youden index. We demonstrate our approach using two meta-analyses of B type natriuretic peptide in heart failure and procalcitonin as a marker for sepsis.

Conclusions: Our approach uses all the available information and results in an estimation not only of the performance of the biomarker but also of the threshold at which the optimal performance can be expected.

Keywords: Biomarker; Diagnostic accuracy study; Meta-analysis; ROC curve; Threshold.


Figures
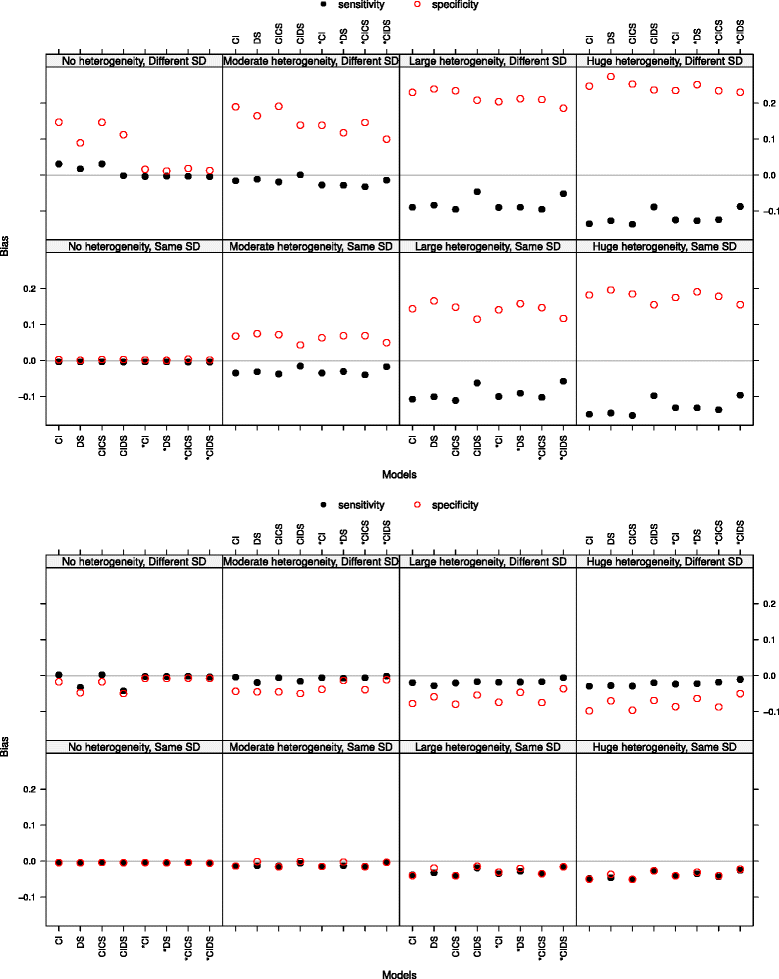
Fig. 1
Fig. 1
Bias of sensitivity and specificity at threshold 0 (top panel) and at the true optimal threshold (bottom panel). The Poisson distribution was chosen with λ=1.3 for the number of thresholds. The four plots at the bottom show the case of same standard deviations (SD), the top four plots the case of different standard deviations. The heterogeneity of the studies increases from left to right
Fig. 2
Fig. 2
Coverage of sensitivity and specificity at the true optimal threshold (top panel). Bias of the optimal threshold (bottom panel). The Poisson distribution was chosen with λ=1.3 for the number of thresholds. The four plots at the bottom show the case of same standard deviations (SD), the top four plots the case of different standard deviations. The heterogeneity of the studies increases from left to right
Fig. 3
Fig. 3
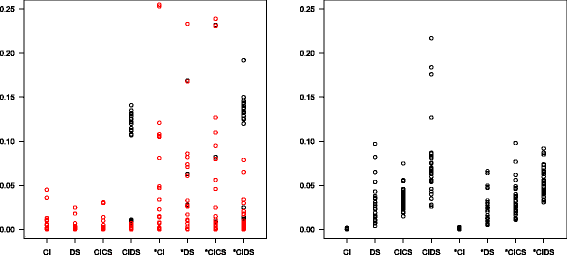
Percentage of error messages (left panel) and warnings (right panel) in simulation scenarios with a varying number of thresholds. Red circles indicate cases with negative regression slope
Fig. 4
Fig. 4
Percentage of error messages (left panel) and warnings (right panel) in simulation scenarios with the number of thresholds fixed to five. Red circles indicate cases with negative regression slope
Fig. 5
Fig. 5
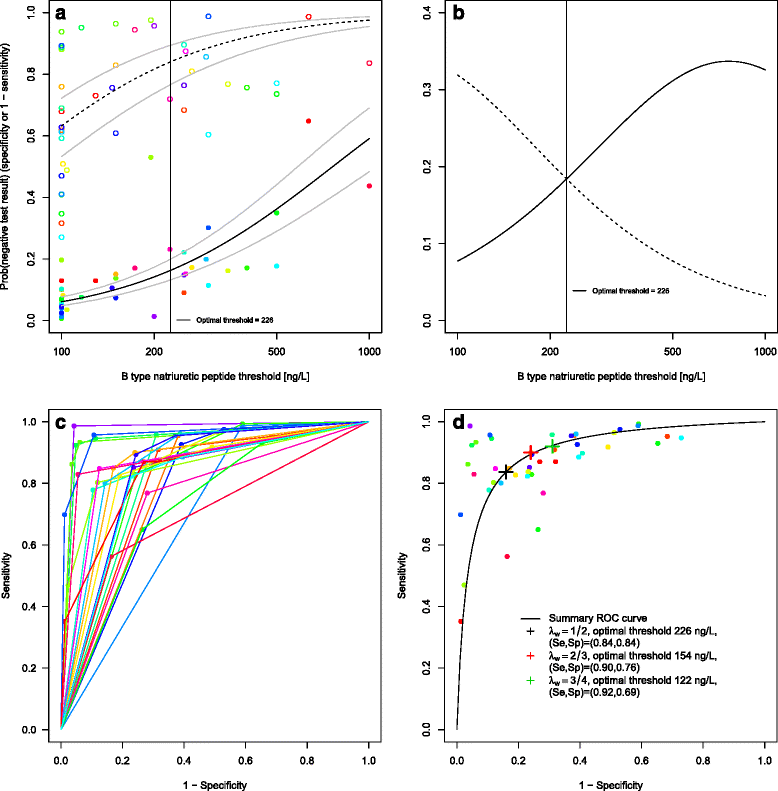
B type natriuretic peptide data. a Estimated distribution functions for the non-diseased (open circles, dashed line) and the diseased individuals (filled circles, solid line). The grey lines mark the confidence regions and different studies are marked in different colours. The optimal threshold, derived from a maximization of the Youden index, is depicted as a solid vertical line. b Estimated densities and their point of intersection. Non-diseased (dashed line), diseased individuals (solid line). c Study-specific ROC curves. d Estimated SROC curve with the optimal thresholds for different weightings of sensitivity and specificity marked as crosses in black, red and green. Different studies are marked in different colours
Fig. 6
Fig. 6
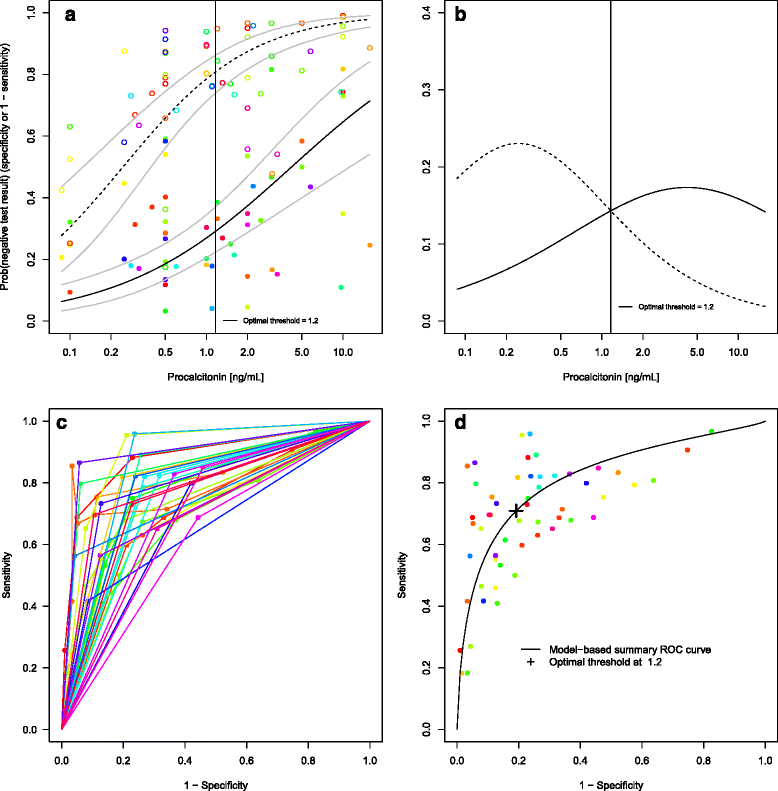
Procalcitonin data. a Estimated distribution functions for the non-diseased (open circles, dashed line) and the diseased individuals (filled circles, solid line). The grey lines mark the confidence regions and different studies are marked in different colours. The optimal threshold, derived from a maximization of the Youden index, is depicted as a solid vertical line. b Estimated densities and their point of intersection. Non-diseased (dashed line), diseased individuals (solid line). c Study-specific ROC curves. d Estimated SROC curve with the optimal threshold for equal weighting of sensitivity and specificity. Different studies are marked in different colours

References

    1. Pepe MS. The Statistical Evaluation of Medical Tests for Classification and Prediction. Oxford, UK: Oxford University Press; 2004.
    1. Roberts E, Ludman AJ, Dworzynski K, Al-Mohammad A, Cowie MR, McMurray JJ, Mant J. The diagnostic accuracy of the natriuretic peptides in heart failure: systematic review and diagnostic meta-analysis in the acute care setting. Br Med J. 2015;350:910. doi: 10.1136/bmj.h910. - DOI - PMC - PubMed
    1. Aertgeerts B, Buntinx F, Kester A. The value of the CAGE in screening for alcohol abuse and alcohol dependence in general clinical populations: a diagnostic meta-analysis. J Clin Epidemiol. 2004;57(1):30–9. doi: 10.1016/S0895-4356(03)00254-3. - DOI - PubMed
    1. Zhelev Z, Hyde C, Youngman E, Rogers M, Fleming S, Slade T, Coelho H, Jones-Hughes TVN. Diagnostic accuracy of single baseline measurement of elecsys troponin T high-sensitive assay for diagnosis of acute myocardial infarction in emergency department: systematic review and meta-analysis. BMJ. 2015;350:15. doi: 10.1136/bmj.h15. - DOI - PMC - PubMed
    1. Wacker C, Prkno A, Brunkhorst FM, Schlattmann P. Procalcitonin as a diagnostic marker for sepsis: a systematic review and meta-analysis. Lancet Infect Dis. 2013;13(5):426–35. doi: 10.1016/S1473-3099(12)70323-7. - DOI - PubMed

Publication types

LinkOut - more resources