. 2016 Aug 12:16:624.
doi: 10.1186/s12885-016-2606-5.

IAP antagonists Birinapant and AT-406 efficiently synergise with either TRAIL, BRAF, or BCL-2 inhibitors to sensitise BRAFV600E colorectal tumour cells to apoptosis

Affiliations

IAP antagonists Birinapant and AT-406 efficiently synergise with either TRAIL, BRAF, or BCL-2 inhibitors to sensitise BRAFV600E colorectal tumour cells to apoptosis

Philippos Perimenis et al. BMC Cancer. .

Abstract

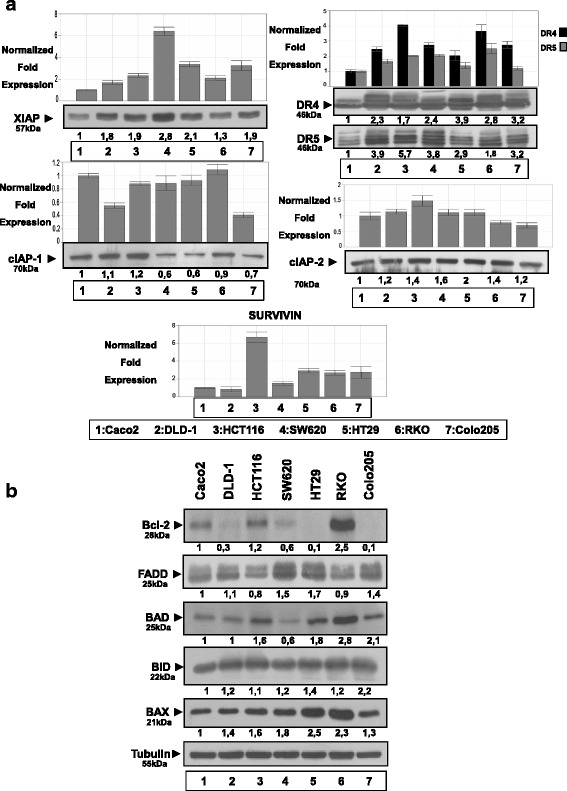
Background: High expression levels of Inhibitors of Apoptosis Proteins (IAPs) have been correlated with poor cancer prognosis and block the cell death pathway by interfering with caspase activation. SMAC-mimetics are small-molecule inhibitors of IAPs that mimic the endogenous SMAC and promote the induction of cell death by neutralizing IAPs.

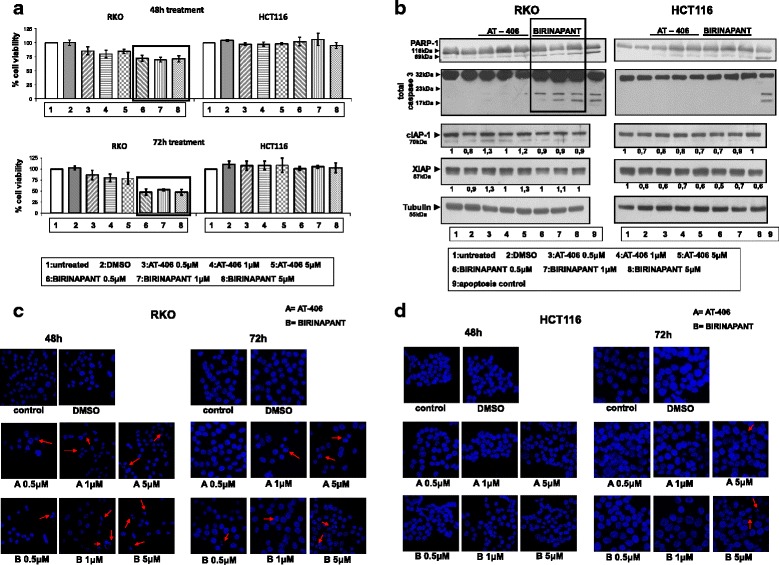
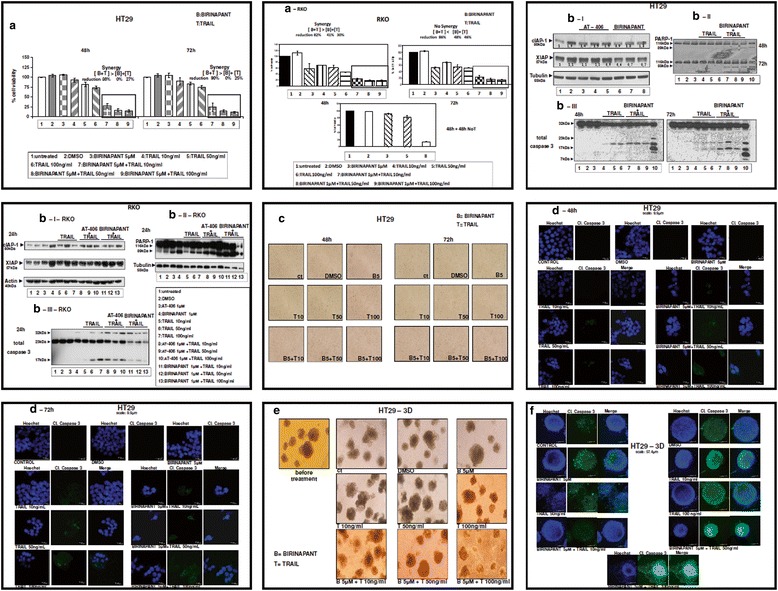
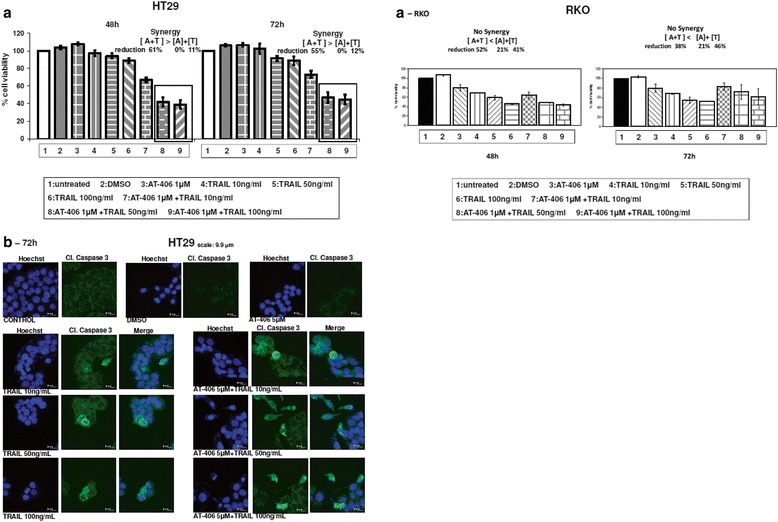
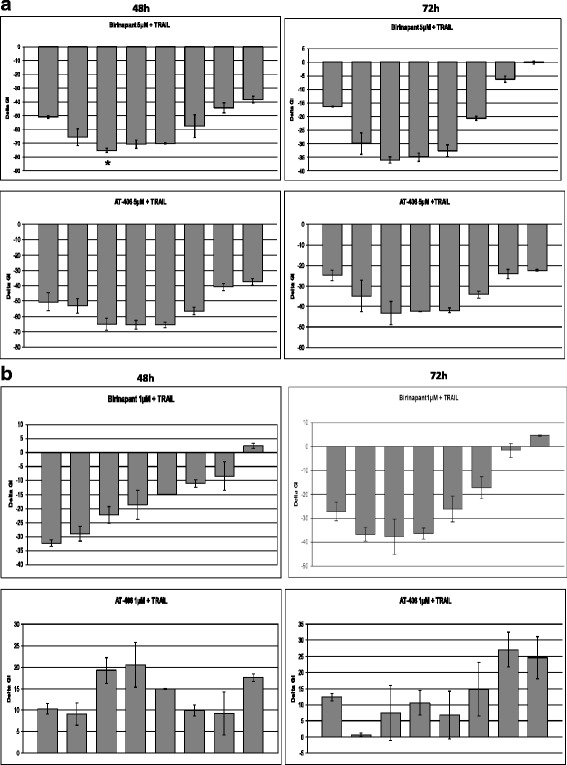
Methods: In this study, anti-tumour activity of new SMAC-mimetics Birinapant and AT-406 is evaluated against colorectal adenocarcinoma cells and IAP cross-talk with either oncogenic BRAF or BCL-2, or with the TRAIL are further exploited towards rational combined protocols.

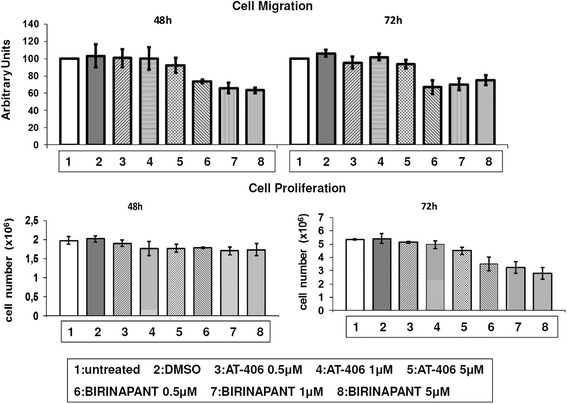
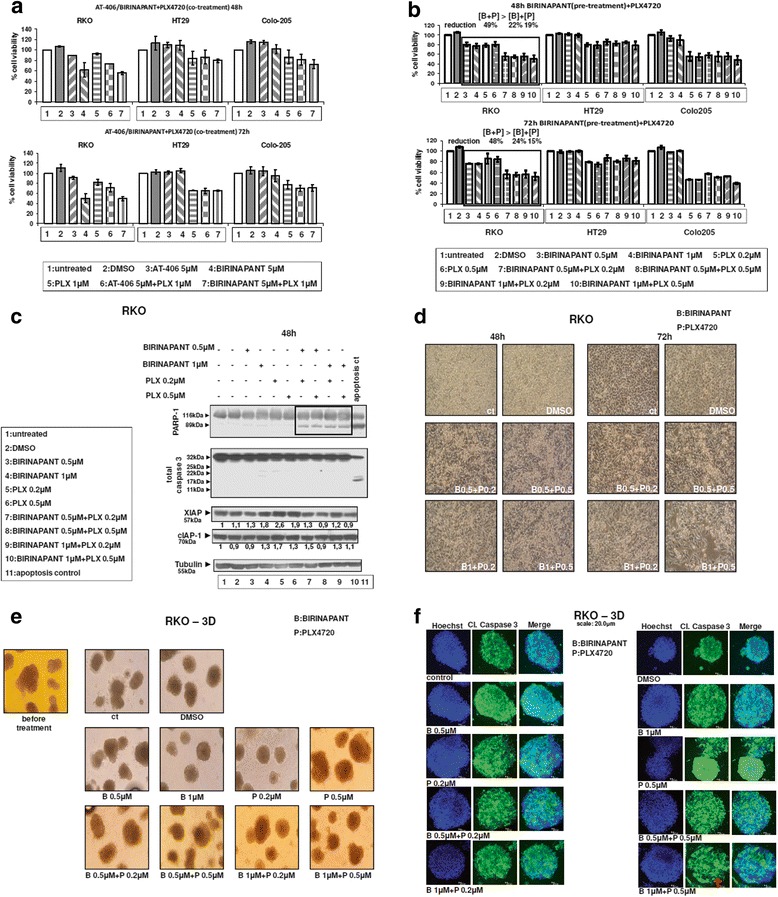
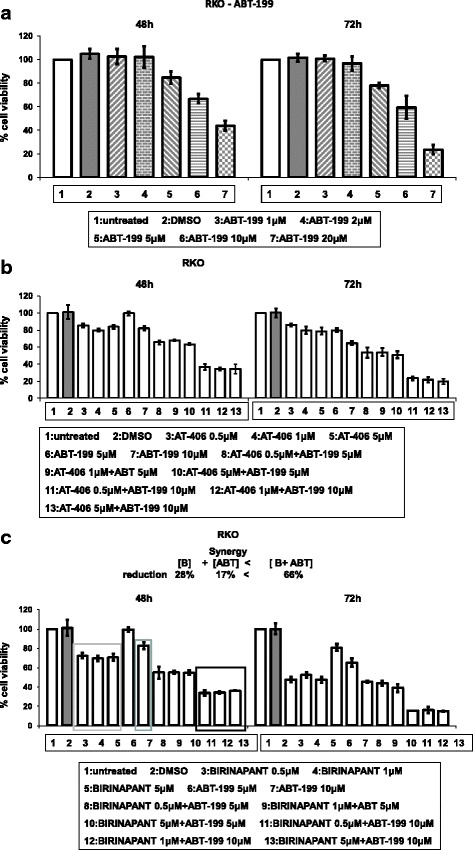
Results: It is shown that pre-treatment of SMAC-mimetics followed by their combined treatment with BRAF inhibitors can decrease cell viability, migration and can very efficiently sensitize colorectal tumour cells to apoptosis. Moreover, co-treatment of TRAIL with SMAC-mimetics can efficiently sensitize resistant tumour cells to apoptosis synergistically, as shown by median effect analysis. Finally, Birinapant and AT-406 can synergise with BCL-2 inhibitor ABT-199 to reduce viability of adenocarcinoma cells with high BCL-2 expression.

Conclusions: Proposed synergistic rational anticancer combined protocols of IAP antagonists Birinapant and AT-406 in 2D and 3D cultures can be later further exploited in vivo, from precision tumour biology to precision medical oncology.

Keywords: BCL2 inhibitors; BRAF inhibitors; IAP antagonists; Overcome resistance in colorectal cancer cells; Synergistic treatments; TRAIL.


Figures

Fig. 1
Fig. 1
Overexpression of IAP members, TRAIL receptors DR4, DR5 and BCL-2 members in colorectal adenocarcinoma cell lines: DLD-1 (lane 2), HCT116 (lane 3), SW620 (lane 4), HT29 (lane 5), RKO (lane 6) and Colo-205 (lane 7), compared to Caco2, an intermediate colorectal adenoma cell line (lane 1). a: Relative RNA and protein levels of cIAP-1, cIAP-2, XIAP, SURVIVIN, DR4 and DR5 genes were evaluated by Real Time PCR and W.B analysis respectively in colon adenocarcinoma cell lines. The analysis was performed in triplicates and the ± SD is shown. Columns indicate relative RNA levels normalized to glyceraldehyde 3-phosphate dehydrogenase (GAPDH). Proteins are quantified against α-Tubulin. b: Protein levels of other (anti)apoptotic factors in colon adenocarcinoma cell lines by W.B. Data are representative for three independent experiments
Fig. 2
Fig. 2
Birinapant treatment results in reduced cell viability and appearance of apoptosis in selected colorectal adenocarcinoma cells. a: Cell viability of cell lines after treatment with SMAC-mimetics. Cells were either left untreated (ctr = control) or treated with 0.5 μM, 1 mM or 5 mM AT-406 and Birinapant for 48 h (1) and 72 h (2) and the % percentage cell viability was measured by SRB. Average of three independent experiments are presented as fold change of the absorbance of treated/untreated cells for each condition. Columns = % percentage of cell viability, bars = SD. b: Protein levels of XIAP, cIAP-1, PARP-1 and total caspase-3 in RKO and HCT116 were analysed by W.B. after treatment with 0.5, 1 and 5 μM SMAC-mimetics AT-406 (lanes 3–5) and Birinapant (lanes 6–8) for 48 and 72 h. Untreated (lane 1) or treated with DMSO cells (lane 2) were used as control. Proteins are quantified against α-Tubulin. Data are representative for three independent experiments. c-d: Confocal microscope images and Hoechst staining of RKO (2C) and HCT116 (2D) cell lines two-dimensional culture, after treatment with SMAC-mimetics AT-406 (A) and Birinapant (B). Crescent nuclei of RKO cells present after cell treatments are shown by arrows. Confocal microscope images were taken after treatment with SMAC-mimetics AT-406 and Birinapant in RKO (2c) and HCT116 (2d) 48 and 72 h. The nuclei were detected with HOECHST staining. Representative images are presented
Fig. 3
Fig. 3
Birinapant treatment reduces RKO tumour cell migrative capacity. Upper panel: Migration ability of RKO cell lines treated with SMAC-mimetics AT-406 and Birinapant compared to the untreated cells. Cells were treated with AT-406 and Birinapant for 24 or 48 h and allowed to migrate. The values are the average of two independent experiments. Lower panel: Cell proliferation of cell line RKO co-treated with SMAC-mimetics AT-406 and Birinapant for 48 and 72 h. The values are the average of two independent experiments. Columns = number of cells/well (of 6-well plate)
Fig. 4
Fig. 4
Pre-treatment with Birinapant and then co-treatment with Birinapant/ BRAF inhibitor PLX4720 synergistically induce apoptosis of colorectal adenocarcinoma cells in 2D and 3D. a: Cell viability after co-treatment with the SMAC-mimetics Birinapant or AT-406 in combination with the BRAF inhibitor PLX4720. Cells were either left untreated (ctr = control) or treated with 5 μM Birinapant, 5 μM AT-406 and 1 μM PLX4720 and their combinations for 48 and 72 h. The average of three independent experiments is presented as fold change of the absorbance of treated/untreated cells, for each condition. Columns = % percentage of cell viability, bars = SD. b: Cell viability after pre-treatment with the SMAC-mimetic Birinapant and then co-treatment with BRAF inhibitor PLX4720 and Birinapant. Cells were either left untreated (ctr = control) or treated with 0.5 or 1 μM Birinapant and 0.2 or 0.5 μM PLX4720. For the pre-treatment testing, cells were first incubated for 24 h with either 0.5 or 1 μM of Birinapant and then co-treated with 0.2 and 0.5 μM PLX4720 for another 24 or 48 h. c: Protein levels of PARP-1, total Caspase-3, XIAP, cIAP-1 and p-ERK1/2 in RKO by W.B., after pre-treatment with 0.5 or 1 μM Birinapant and then co-treatment with 0.2 or 0.5 μM PLX4720. Untreated cells were used as control. Proteins are quantified against α-Tubulin. Data are representative for three independent experiments. d: Light microscopy images from RKO culture after pre-treatment with Birinapant and then co-treatment with PLX4720. Detached cells are shown in supernatant of co-treated group. Several images were taken from untreated and treated with Birinapant (0.5 or 1 μM) and PLX4720 (0.2 or 0.5 μM) RKO cells while been cultured in 6-well plates for 48 and 72 h. Representative images are presented. e: Light microscopy of three-dimensional culture of RKO cells after co-treatment with 0.5 μM, 1 μM Birinapant and 0.2 μM, 0.5 μM PLX4720 and their combination in 3D culture for 6 d. Representative images. f: Confocal microscope images were taken after co-treatment with 0.5 μM, 1 μM Birinapant and 0.2 μM, 0.5 μM PLX4720 and combinations in 3D cultures for 6 days. The nuclei were detected with HOECHST staining (blue color), cleaved Caspase-3 (green color). Representative images. Scale bar: 20 μm
Fig. 5
Fig. 5
Co-treatment of Birinapant with TRAIL can synergistically increase their efficiency and induce apoptosis in colorectal adenocarcinoma cells in 2D and 3D. 5a: Cell viability of cell line HT29 after co-treatment with the SMAC-mimetic Birinapant and the apoptotic agent TRAIL. Cells were either left untreated (ctr = control) or treated with Birinapant, TRAIL and their combination for 48 and 72 h and the % percentage cell viability was measured. The average of three independent experiments is presented. Columns = % percentage of cell viability, bars = SD. 5a-RKO: Respectively for cell line RKO (upper panel). To check for the reversibility of treatment effects, RKO cells were either left untreated (ctr = control), treated with either Birinapant, TRAIL or their combination for 48 h. Cells were then incubated with additional 48 h without treatments (NoT) and the % percentage cell viability was measured. The average of three independent experiments is presented. 5b-I. Protein levels of cIAP-1 and XIAP after 0.5, 1 and 5 μM AT-406 (lanes 3–5) or Birinapant (lanes 6–8) treatments respectively for 48 h, compared to control lanes 1 (no treatment) or 2 (DMSO treatment). 5b-II and 5b-III. Protein levels of PARP-1 and total Caspase-3 in HT29 cell line after co-treatment with SMAC-mimetic Birinapant and TRAIL for 48 and 72 h. Cells were either left untreated (lane 1) or treated with DMSO (lane 2), with 5 μM Birinapant (lane 3), with 10, 50 and 100 ng/mL TRAIL (lanes 4–6), or with 5 μM Birinapant and combination with TRAIL (lanes 7–9) for 48 and 72 h. Sensitive cell line HCT116 treated with TRAIL is used as positive control (lane 10). Using W. B., protein levels of PARP-1 (Figure 5b-II) and of total Caspase 3 (Figure 5b-III) were analyzed after the corresponding treatments. Data are representative for three independent experiments. 5b-I-RKO: Protein levels of cIAP-1 and XIAP after mono-treatments (lanes 3 and 4 for AT-406 and Birinapant respectively and lanes 5–7 for TRAIL 10, 50 and 100 ng/mL respectively) and co-treatments (lanes 8–13 as shown) for 24 h. Untreated (lane 1) and treated with DMSO (lane 2), cells are also presented. 5b-II-RKO and 5b-III-RKO: Protein levels of PARP-1 and total Caspase-3 after respective mono-treatments and co-treatments (same lines as 5-I-RKO). Data are representative of three independent experiments. 5C: Light microscopy images from HT29 culture after combined treatment with Birinapant and TRAIL. Detached (apoptotic) cells are shown in supernatant of co-treated groups for 48 and 72 h. Representative images. 5d: Confocal microscope images were taken after co-treatment with Birinapant, TRAIL and their combination. Nuclei were detected with HOECHST staining (blue color), cleaved Caspase-3 (green color). Representative images.. Scale bar: 9.9 μm. 5e. Light microscopy of three-dimensional culture of HT29 cells after co-treatment with Birinapant, TRAIL and their combinations in 3D for 6 days. Representative images. 5f: Confocal microscope images were taken after co-treatment with Birinapant, TRAIL and their combinations in 3D culture for 6 days. The nuclei were detected with HOECHST staining (blue color), cleaved Caspase-3 (green color). Representative images. Scale bar: 57.4 μm
Fig. 6
Fig. 6
SMAC-mimetic AT-406 and TRAIL synergistically kill resistant tumour cells. 6a Cell viability of HT29 cell line after combined treatment with SMAC-mimetic AT-406 and the apoptotic agent TRAIL. Cells were either left untreated (ctr = control) or treated with AT-406 combined with TRAIL for 48 and 72 h and the % percentage cell viability was measured by SRB staining. The values are the average of three independent experiments and are presented as fold change of the absorbance of treated/untreated cells, for each condition. Columns = % percentage of cell viability, bars = SD. 6a-RKO: Respectively for cell line RKO. 6b. Confocal microscope images were taken after co-treatment with AT-406, TRAIL and their combinations for 48 and 72 h. The nuclei were detected with HOECHST staining (blue color), cleaved Caspase-3 (green color). Representative images. Scale bar: 9.9 μM
Fig. 7
Fig. 7
SMAC-mimetics AT-406 and Birinapant show synergistic effects when co-treated with TRAIL in HT29 and RKO. 7a-HT29: Synergy graphs for HT29 cell line treated for 48 and 72 h with AT-406 or Birinapant fixed dose (5 μM) and increasing concentrations of TRAIL (from left to right: 100, 50, 25, 12,5, 6,25, 3,125, 1,5625 and 0,78125 ng/mL). 7b-RKO: Respectively for RKO cell line with fixed dose of SMAC-mimetics 1 μM
Fig. 8
Fig. 8
BCL-2 inhibitor ABT-199 can efficiently cause apoptosis when combined with SMAC-mimetics Birinapant and AT-406. a: Cell viability of RKO after treatment with ABT-199, a specific inhibitor of BCL-2. Cells were either left untreated (ctr = control) or treated with different concentrations of ABT-199 for 48 and 72 h and the % percentage cell viability was measured by SRB. The values are the average of three independent experiments and are presented as fold change of the absorbance of treated/untreated cells, for each condition. Columns = % percentage of cell viability, bars = SD. b: Cell viability of cell line RKO after combined treatment with the SMAC-mimetic AT-406 and ABT-199. Cells were either left untreated (ctr = control) or treated with AT-406 combined with ABT-199 for 48 and 72 h and the % percentage cell viability was measured by SRB. c: Cell viability of cell line RKO after combined treatment with the SMAC-mimetic Birinapant and ABT-199. Cells were either left untreated (ctr = control) or treated with Birinapant and ABT-199 combination for 48 and 72 h. The values are the average of three independent experiments and are presented as fold change of the absorbance of treated/untreated cells, for each condition. Columns = % percentage of cell viability, bars = SD

Similar articles

Cited by

References

    1. Oberoi-Khanuja TK, Murali A, Rajalingam K. IAPs on the move: role of inhibitors of apoptosis proteins in cell migration. Cell Death Dis. 2013;4:e784. doi: 10.1038/cddis.2013.311. - DOI - PMC - PubMed
    1. Wu G, Chai J, Suber TL, Wu JW, Du C, Wang X, et al. Structural basis of IAP recognition by Smac/DIABLO. Nature. 2000;408:1008–12. doi: 10.1038/35050012. - DOI - PubMed
    1. Nachmias B, Ashhab Y, Ben-Yehuda D. The inhibitor of apoptosis protein family (IAPs): an emerging therapeutic target in cancer. Semin Cancer Biol. 2004;14:231–43. doi: 10.1016/j.semcancer.2004.04.002. - DOI - PubMed
    1. Yang QH, Du C. Smac/DIABLO selectively reduces the levels of c-IAP1 and c-IAP2 but not that of XIAP and livin in HeLa cells. J Biol Chem. 2004;279:16963–70. doi: 10.1074/jbc.M401253200. - DOI - PubMed
    1. Drosopoulos K, Pintzas A. Multifaceted targeting in cancer: the recent cell death players meet the usual oncogene suspects. Expert Opin Ther Targets. 2007;11:641–5. doi: 10.1517/14728222.11.5.641. - DOI - PubMed

Publication types

MeSH terms