

The Genetic Architecture of Noise-Induced Hearing Loss: Evidence for a Gene-by-Environment Interaction
- PMID: 27520957
- PMCID: PMC5068943
- DOI: 10.1534/g3.116.032516
The Genetic Architecture of Noise-Induced Hearing Loss: Evidence for a Gene-by-Environment Interaction
Abstract
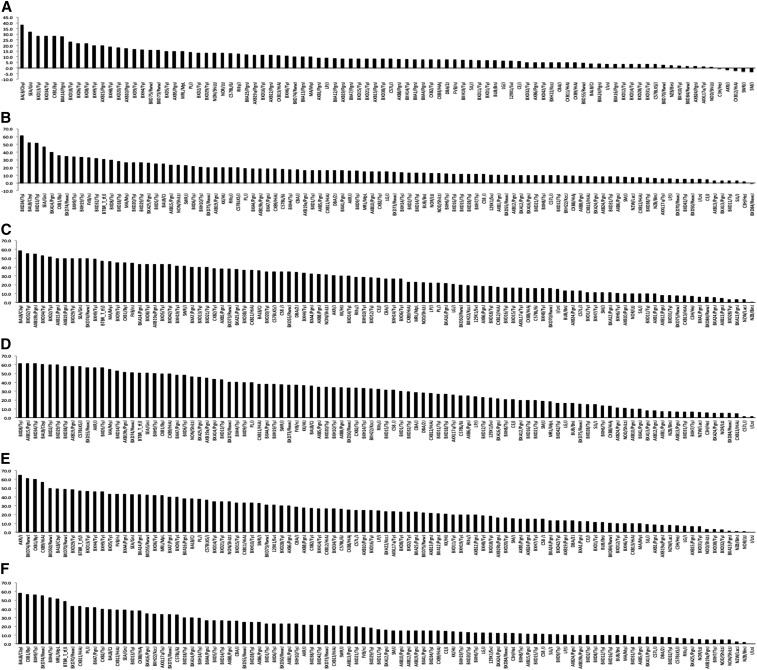
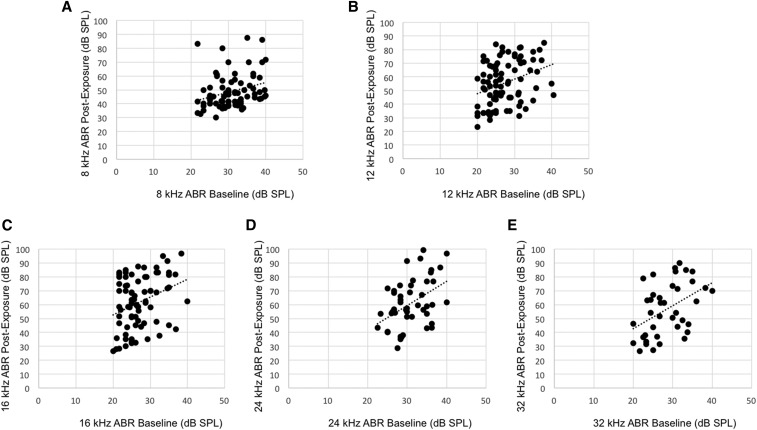
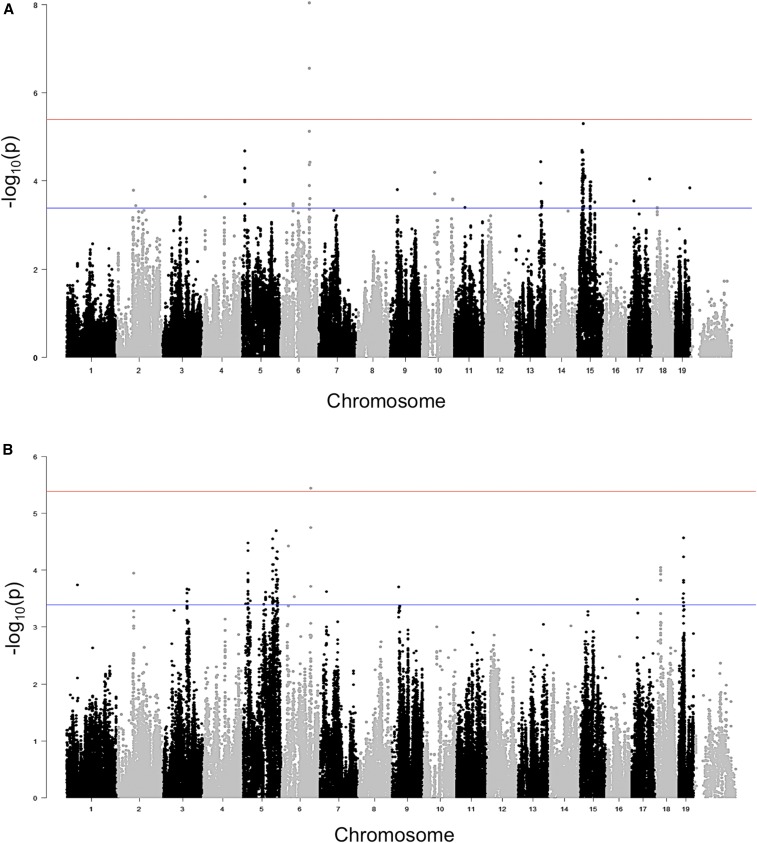
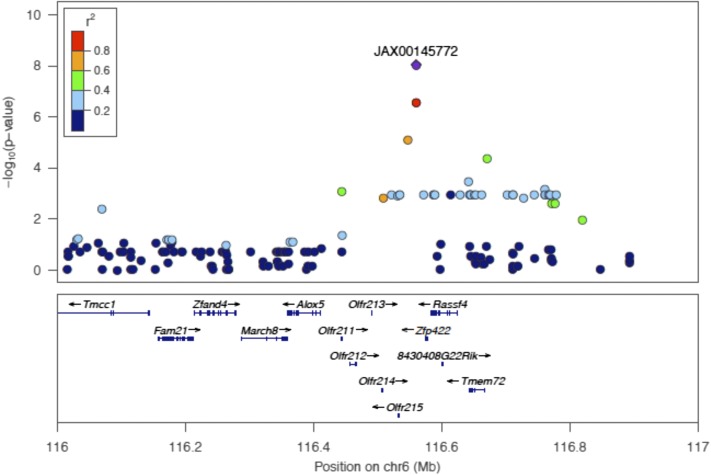
The discovery of environmentally specific genetic effects is crucial to the understanding of complex traits, such as susceptibility to noise-induced hearing loss (NIHL). We describe the first genome-wide association study (GWAS) for NIHL in a large and well-characterized population of inbred mouse strains, known as the Hybrid Mouse Diversity Panel (HMDP). We recorded auditory brainstem response (ABR) thresholds both pre and post 2-hr exposure to 10-kHz octave band noise at 108 dB sound pressure level in 5-6-wk-old female mice from the HMDP (4-5 mice/strain). From the observation that NIHL susceptibility varied among the strains, we performed a GWAS with correction for population structure and mapped a locus on chromosome 6 that was statistically significantly associated with two adjacent frequencies. We then used a "genetical genomics" approach that included the analysis of cochlear eQTLs to identify candidate genes within the GWAS QTL. In order to validate the gene-by-environment interaction, we compared the effects of the postnoise exposure locus with that from the same unexposed strains. The most significant SNP at chromosome 6 (rs37517079) was associated with noise susceptibility, but was not significant at the same frequencies in our unexposed study. These findings demonstrate that the genetic architecture of NIHL is distinct from that of unexposed hearing levels and provide strong evidence for gene-by-environment interactions in NIHL.
Keywords: GWAS; HMDP; NIHL; eQTL; gene-by-environment.
Copyright © 2016 Lavinsky et al.
Figures
Similar articles
-
Noise Exposure and Distortion Product Otoacoustic Emission Suprathreshold Amplitudes: A Genome-Wide Association Study.Audiol Neurootol. 2021;26(6):445-453. doi: 10.1159/000514143. Epub 2021 Jul 19. Audiol Neurootol. 2021. PMID: 34280920 Free PMC article.
-
Genome-wide association study identifies nox3 as a critical gene for susceptibility to noise-induced hearing loss.PLoS Genet. 2015 Apr 16;11(4):e1005094. doi: 10.1371/journal.pgen.1005094. eCollection 2015 Apr. PLoS Genet. 2015. PMID: 25880434 Free PMC article.
-
The Genetics of Variation of the Wave 1 Amplitude of the Mouse Auditory Brainstem Response.J Assoc Res Otolaryngol. 2020 Aug;21(4):323-336. doi: 10.1007/s10162-020-00762-3. Epub 2020 Aug 5. J Assoc Res Otolaryngol. 2020. PMID: 32757112 Free PMC article.
-
[Genetic factors in susceptibility to age- and noise-related hearing loss].Pol Merkur Lekarski. 2006 Oct;21(124):384-8. Pol Merkur Lekarski. 2006. PMID: 17205784 Review. Polish.
-
Genetic influences on susceptibility of the auditory system to aging and environmental factors.Scand Audiol Suppl. 1992;36:1-39. Scand Audiol Suppl. 1992. PMID: 1488615 Review.
Cited by
-
Age-related hearing loss and its potential drug candidates: a systematic review.Chin Med. 2023 Sep 20;18(1):121. doi: 10.1186/s13020-023-00825-6. Chin Med. 2023. PMID: 37730634 Free PMC article. Review.
-
Pathology and mechanisms of cochlear aging.J Neurosci Res. 2020 Sep;98(9):1674-1684. doi: 10.1002/jnr.24439. Epub 2019 May 7. J Neurosci Res. 2020. PMID: 31066107 Free PMC article. Review.
-
Personal Music Players Use and Other Noise Hazards among Children 11 to 12 Years Old.Int J Environ Res Public Health. 2020 Sep 22;17(18):6934. doi: 10.3390/ijerph17186934. Int J Environ Res Public Health. 2020. PMID: 32971992 Free PMC article.
-
The combined effects of occupational exposure to noise and other risk factors - a systematic review.Noise Health. 2019 Jul-Aug;21(101):125-141. doi: 10.4103/nah.NAH_4_18. Noise Health. 2019. PMID: 32719300 Free PMC article.
-
Systems genetics approaches for understanding complex traits with relevance for human disease.Elife. 2023 Nov 14;12:e91004. doi: 10.7554/eLife.91004. Elife. 2023. PMID: 37962168 Free PMC article. Review.
References
-
- Conway H., Simmons J., Talbert T., 1993. The purposes of occupational medical surveillance in US industry and related health findings. J. Occup. Med. 35(7): 670–686. - PubMed
-
- Davis R. R., Newlander J. K., Ling X., Cortopassi G. A., Krieg E. F., et al. , 2001. Genetic basis for susceptibility to noise-induced hearing loss in mice. Hear. Res. 155(1–2): 82–90. - PubMed
-
- Dobie R. A., 2008. The burdens of age-related and occupational noise-induced hearing loss in the United States. Ear Hear. 29(4): 565–577. - PubMed
Publication types
MeSH terms
Grants and funding
LinkOut - more resources
Full Text Sources
Other Literature Sources
Molecular Biology Databases
Miscellaneous