

IFNλ is a potent anti-influenza therapeutic without the inflammatory side effects of IFNα treatment
- PMID: 27520969
- PMCID: PMC5009813
- DOI: 10.15252/emmm.201606413
IFNλ is a potent anti-influenza therapeutic without the inflammatory side effects of IFNα treatment
Abstract
Influenza A virus (IAV)-induced severe disease is characterized by infected lung epithelia, robust inflammatory responses and acute lung injury. Since type I interferon (IFNαβ) and type III interferon (IFNλ) are potent antiviral cytokines with immunomodulatory potential, we assessed their efficacy as IAV treatments. IFNλ treatment of IAV-infected Mx1-positive mice lowered viral load and protected from disease. IFNα treatment also restricted IAV replication but exacerbated disease. IFNα treatment increased pulmonary proinflammatory cytokine secretion, innate cell recruitment and epithelial cell death, unlike IFNλ-treatment. IFNλ lacked the direct stimulatory activity of IFNα on immune cells. In epithelia, both IFNs induced antiviral genes but no inflammatory cytokines. Similarly, human airway epithelia responded to both IFNα and IFNλ by induction of antiviral genes but not of cytokines, while hPBMCs responded only to IFNα. The restriction of both IFNλ responsiveness and productive IAV replication to pulmonary epithelia allows IFNλ to limit IAV spread through antiviral gene induction in relevant cells without overstimulating the immune system and driving immunopathology. We propose IFNλ as a non-inflammatory and hence superior treatment option for human IAV infection.
Keywords: immunopathology; infection; influenza; interferon alpha; interferon lambda.
© 2016 The Authors. Published under the terms of the CC BY 4.0 license.
Figures
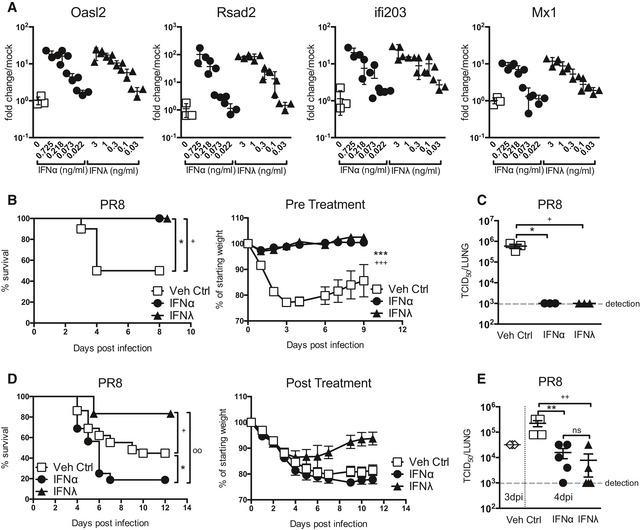
- A
Relative antiviral activity of IFNα (circles) or IFNλ (triangles). AEC cultures were stimulated for 4 h with stated IFN at specified concentrations (ng/ml) and induction of indicated ISGs was assessed by qPCR (data shown are representative of four independent experiments, n = 3–4).
- B, C
Mice were pretreated with equivalent doses of IFNα (1.45 μg/50 μl) or IFNλ (2.6 μg/50 μl) or Veh Ctrl (squares, 50 μl PBS) 24 h prior to infection with PR8; weight loss and survival were assessed throughout infection (B), and viral load (C) assessed at 4 dpi (data shown are representative of two independent experiments, n = 8–10 (B), n = 3 (C)).
- D, E
Mice were infected with PR8 and treated with equivalent doses of IFNα or IFNλ or Veh Ctrl at days 2, 4 and 5 post‐infection; survival and weight loss were monitored (D, data pooled from 4 independent experiments, n = 12–29) and viral load assessed at 4 dpi (E) (data representative of two independent experiments, n = 3–5).
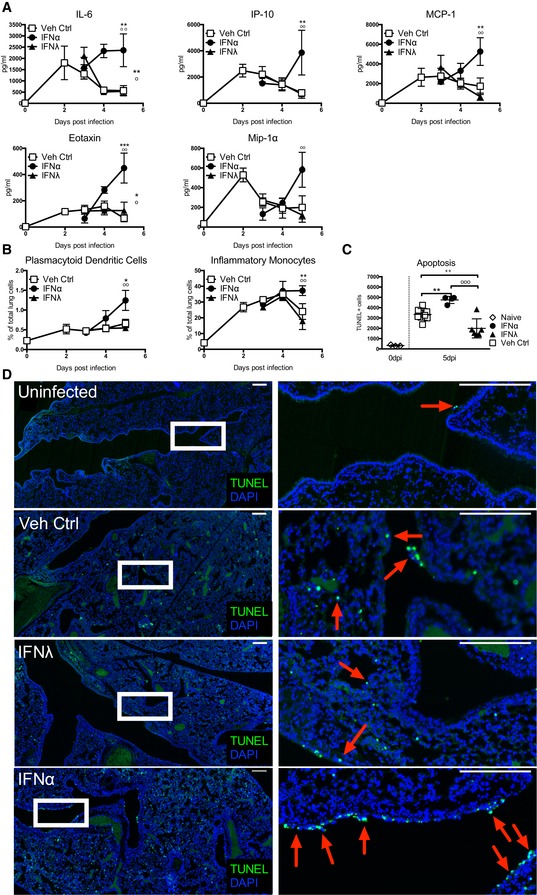
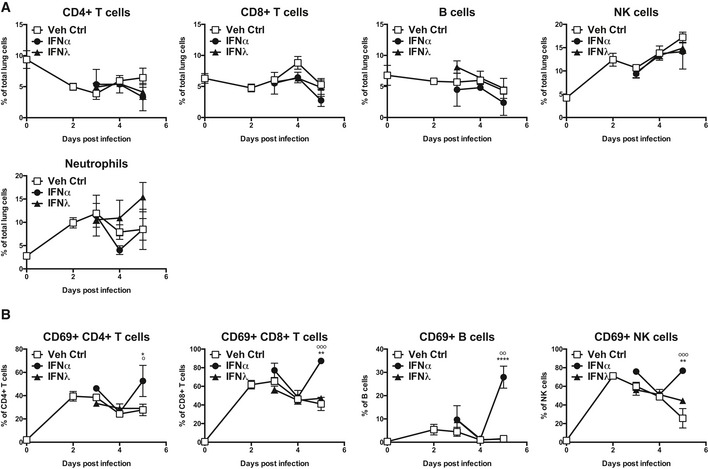
- A, B
Mice were infected with PR8 and treated with IFNα (circles, 1.45 μg/50 μl), IFNλ (triangles, 2.6 μg/50 μl) or Veh Ctrl (squares) as previously stated. Concentrations of stated proinflammatory cytokines in BAL fluid were measured by multiplex cytokine assay (A) and flow cytometric quantification of pDCs and inflammatory monocytes in the lung was performed (B) (data shown are representative of two independent experiments, n = 2–6).
- C, D
Lung sections from control and infected mice treated as indicated were stained by TUNEL for apoptotic cells at 6 dpi. Quantification of TUNEL+ cells in whole lung slides by Icy‐Spot Detector (ICY‐R3M2Y2) (C) (data shown are pooled from three independent experiments, n = 3–8). Red arrowheads indicate TUNEL signal (D). Scale bar, 200 μM (data shown are representative of two independent experiments, n = 3–4).
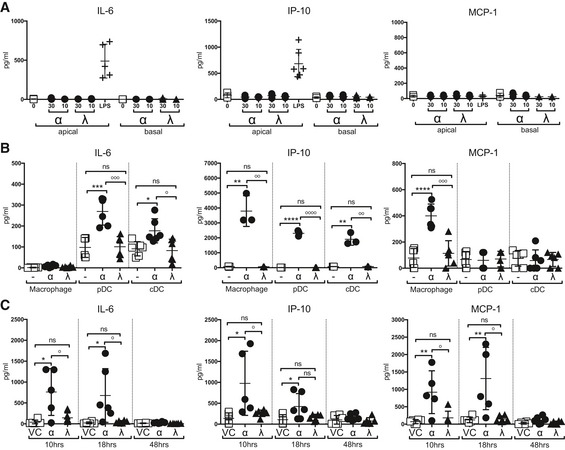
- A, B
IL‐6, IP‐10 and MCP‐1 concentrations were measured by multiplex cytokine assay in AEC culture supernatants (A) and macrophage, pDC and cDC culture supernatants (B) at 24 h post‐stimulation with IFNα4 (0.725 ng/ml) or IFNλ2 (1.3 ng/ml) or LPS (AEC only) (data shown are representative of two independent experiments, n = 3–6).
- C
BAL samples taken from mice treated with IFNα, IFNλ or Veh Ctrl at specified time points (data shown are representative of two independent experiments, n = 5–6).
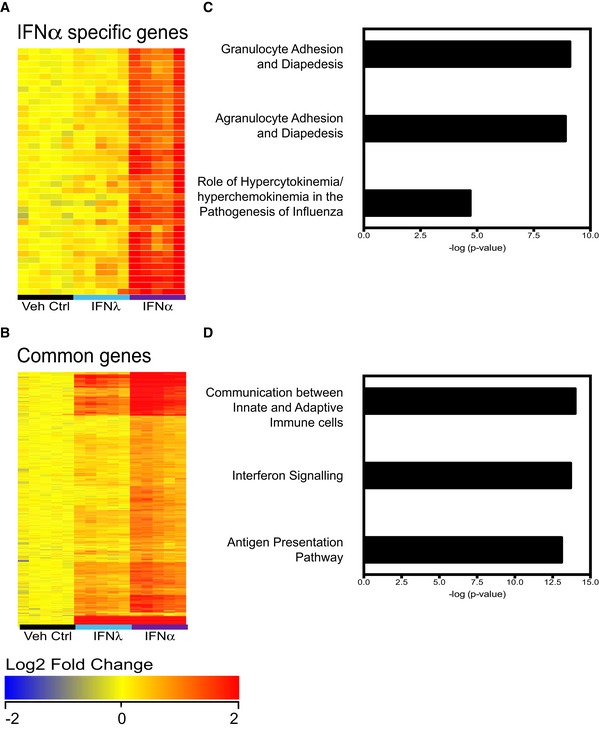
- A–D
Mice were treated with IFNα (1.45 μg/50 μl), IFNλ (2.6 μg/50 μl) or Veh Ctrl (50 μl PBS), and whole lungs were taken at 18 h post‐treatment for global analysis by Illumina.SingleColor.Mouse WG‐6V20R01127 microarrays. Samples (n = 5) were normalized to the median of the vehicle control group and filtered for a fold change of 1.5, yielding 553 genes differently regulated between treatments (one‐way ANOVA, P < 0.01, Benjamini–Hochberg multiple test correction), of which 429 genes are upregulated. K‐means clustering revealed six gene clusters, one of which encompassed genes primarily induced by IFNα4 (A), while the remaining clusters contained genes upregulated by both IFNα4 and IFNλ2 (B). The two clusters of genes were analysed by Ingenuity Pathway Analysis (IPA) (C, D).
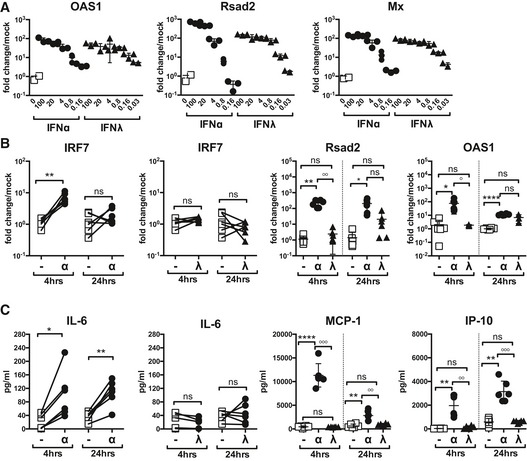
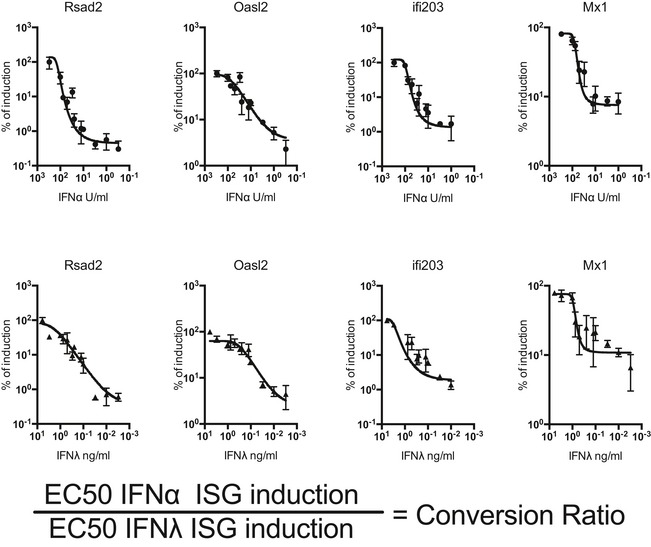
- A
Human AEC cultures were stimulated for 4 h with IFNα (circles) or IFNλ (triangles) at specified concentrations and then assessed for stated ISG induction by qPCR (data are representative of 2 independent experiments, n = 3).
- B, C
ISG induction in human PBMCs was assessed at 4 and 24 h post‐IFNα (21 U/ml) or IFNλ (1.2 ng/ml) stimulation (B). PBMC proinflammatory cytokine secretion was measured by multiplex cytokine assay at 4 and 24 h post‐stimulation with IFNα or IFNλ (C) (data shown are pooled from six independent donors).
References
-
- Agrati C, Gioia C, Lalle E, Cimini E, Castilletti C, Armignacco O, Lauria FN, Ferraro F, Antonini M, Ippolito G et al (2010) Association of profoundly impaired immune competence in H1N1v‐infected patients with a severe or fatal clinical course. J Infect Dis 202: 681–689 - PubMed
-
- Ank N, Iversen MB, Bartholdy C, Staeheli P, Hartmann R, Jensen UB, Dagnaes‐Hansen F, Thomsen AR, Chen Z, Haugen H et al (2008) An important role for type III interferon (IFN‐lambda/IL‐28) in TLR‐induced antiviral activity. J Immunol 180: 2474–2485 - PubMed
-
- Baskin CR, Bielefeldt‐Ohmann H, Tumpey TM, Sabourin PJ, Long JP, Garcia‐Sastre A, Tolnay AE, Albrecht R, Pyles JA, Olson PH et al (2009) Early and sustained innate immune response defines pathology and death in nonhuman primates infected by highly pathogenic influenza virus. Proc Natl Acad Sci USA 106: 3455–3460 - PMC - PubMed
Publication types
MeSH terms
Substances
Grants and funding
LinkOut - more resources
Full Text Sources
Other Literature Sources
Molecular Biology Databases
