. 2016 Sep;90(3):627-37.
doi: 10.1016/j.kint.2016.06.011.

Development of a microphysiological model of human kidney proximal tubule function

Affiliations

Development of a microphysiological model of human kidney proximal tubule function

Elijah J Weber et al. Kidney Int. 2016 Sep.

Abstract

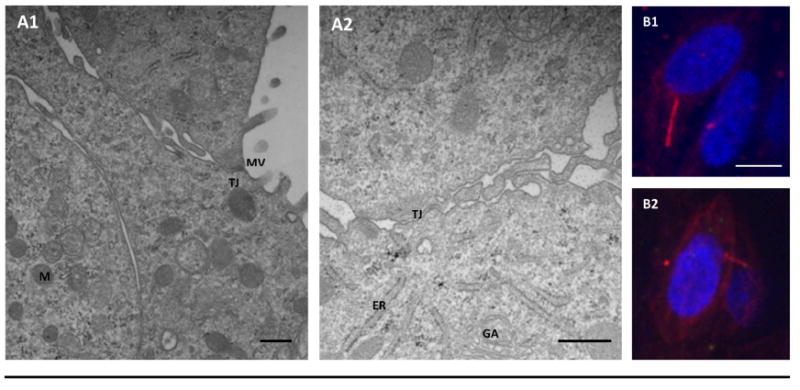
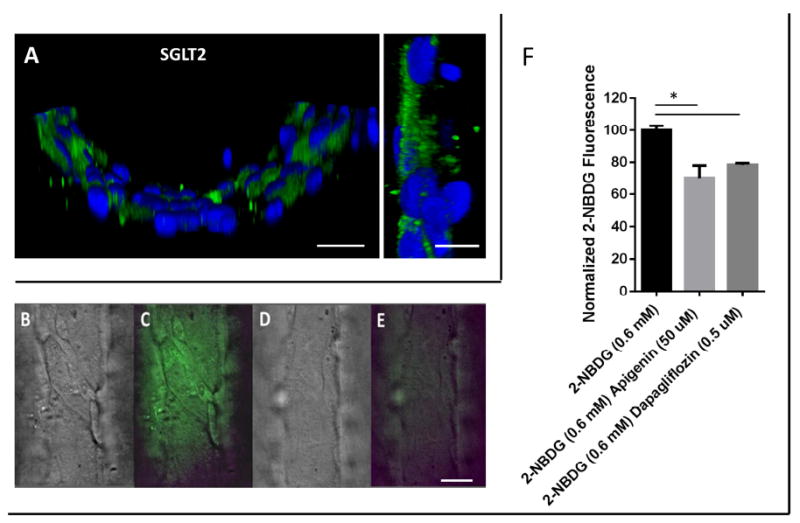
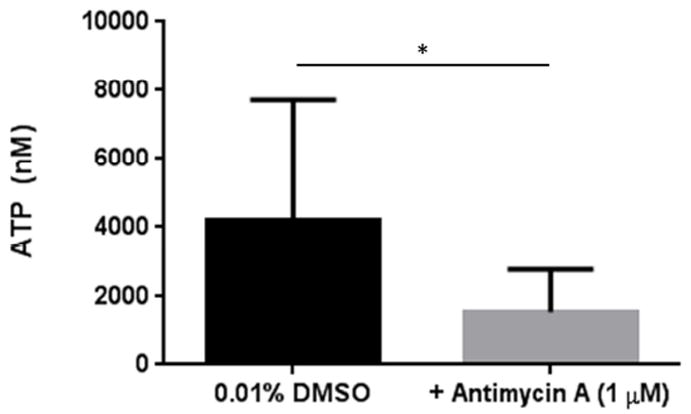
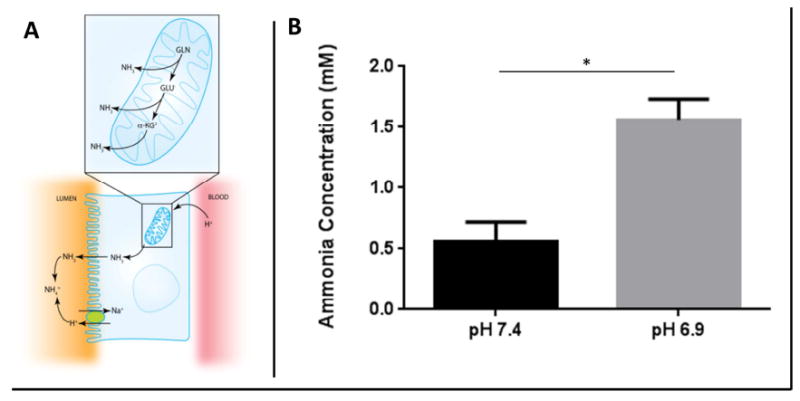
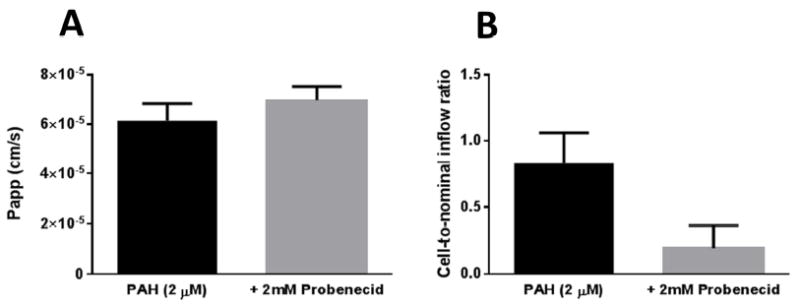
The kidney proximal tubule is the primary site in the nephron for excretion of waste products through a combination of active uptake and secretory processes and is also a primary target of drug-induced nephrotoxicity. Here, we describe the development and functional characterization of a 3-dimensional flow-directed human kidney proximal tubule microphysiological system. The system replicates the polarity of the proximal tubule, expresses appropriate marker proteins, exhibits biochemical and synthetic activities, as well as secretory and reabsorptive processes associated with proximal tubule function in vivo. This microphysiological system can serve as an ideal platform for ex vivo modeling of renal drug clearance and drug-induced nephrotoxicity. Additionally, this novel system can be used for preclinical screening of new chemical compounds prior to initiating human clinical trials.

Keywords: cell polarity; cell survival; proximal tubule.


Conflict of interest statement

Conflict of Interest: The authors have no conflicts to declare.

Figures

Fig. 1
Fig. 1
PTEC viability and basic functionality in human kidney 3D MPS. (A) Scheme depicting construction of human PTEC in MPS. (i) Cell isolation from human kidney cortex. (ii) Cell culture in 2D. (iii) Cell seeding and culture in 3D MPS. (iv)Phase contrast and viability of PTEC in MPS at day 28. (B) 3D projection of MPS matrix shows PTEC tubule structure: surface expression of epithelial cell marker CD13 (red) (B1 and B2 - 400X Magnification); cell self-assembly confirmed by E-Cadherin expression (red) (B3 and B4 - 400X Magnification); proximal tubule origin confirmed by expression of aquaporin 1 (red) (B5 and B6 - 400X Magnification). (C) Polarization confirmed by tight junction formation via apical localization of ZO-1 (C1) (green) and basolateral expression of Na+/K+ ATPase (C2)(green). Tubule diameter is ~120 μm. (scale bars: 1Aii, 200 μM; 1Aiv, 50 μM; 1B-1C, all 20 μM).
Fig. 2
Fig. 2
Ultrastructure of human PTECs in human kidney 3D MPS. (A1 and A2) Transmission electron microscopy depicting ultrastructure of PTECs cultured in MPS device. Cellular structure labels: MV-microvilli, M-mitochondria, TJ-tight junction, ER-endoplasmic reticulum, and GA-Golgi Apparatus. (A1 10,000x, A2 30,000x magnification). (B1 and B2) PTECs in MPS form cilia as seen from 2 representative images of single cells stained for acetylated tubulin in red. (scale bars: A1/2, 500 nM; B1, 5 μM).
Fig. 3
Fig. 3
GGT activity in human kidney 3D MPS. (A) Immunocytochemistry reveals proper apical localization of GGT (green) in juxtaposition to nuclei (blue) within the PTEC tubule. (B) γ-glutamyl transpeptidase (GGT) is functionally essential to cleaving the γ-glutamyl moiety from oxidized glutathione and can be inhibited by acivicin. (C) GGT activity as determined by oxidized glutathione abundance in the presence and absence of inhibitor, acivicin (n = 4 MPS devices) (*, P < 0.001, 2-tailed t-test). (scale bars: A, 20 μM-tubule & 10 μM wall).
Fig. 4
Fig. 4
Glucose Reabsorption in human kidney 3D MPS. (A) Glucose is actively reabsorbed from the urine via SGLT2 located on the apical membrane in the PTEC tubule. Immunocytochemistry reveals proper apical localization of SGLT2 (green) in juxtaposition to nuclei (blue). DIC images showing the structure of PTECs in the MPS in the presence and absence of SGLT2 inhibitor, apigenin (B and D). Fluorescent images showing the distribution of the fluorescent glucose analog, NBDG (C and E). NBDG was actively reabsorbed in the absence of inhibitor (C) and was not absorbed in the presence of inhibitor (E). (F) Quantification of cell-associated fluorescent signal following subtraction of auto fluorescence, demonstrating significant reduction of glucose uptake in the presence of inhibitors apigenin and dapaglifozin (n = 3 MPS devices/ group) (*, P < 0.001, unpaired t-test). (scale bars: A, 20 μM tubule and 10 μM wall; E, 50 μM).
Fig. 5
Fig. 5
Cellular ATP content in control and antimycin A treated (1 μM, 24 h) MPS. (n = 3 MPS devices/ group) (*, P=0.05, 2-tailed t-test),
Fig. 6
Fig. 6
Ammoniagenesis in human kidney 3D MPS. (A) The physiological response to a drop in either blood or luminal pH resulting in the generation and secretion of ammonia in the tubular outflow. (B) With the MPS, luminal media was initially at pH 7.4 and then switched to pH 6.9. Secreted ammonia in the outflow was quantified spectrophotometrically from 4 separate devices after 4 h and was significantly different when exposed to acidic conditions. (*, P = 0.05, 2-tailed t-test)
Fig. 7
Fig. 7
(A) Formation clearance of the 1α,25-(OH)2 Vit D3 (calcitriol), 4β,25-(OH)2 Vit D3 and 24,25-(OH)2 Vit D3 over 3 days exposure of PTEC cultured in MPS to 1 μM 25-OH Vit D3 (calcidiol). Clearance values are plotted at midpoint of collection interval. Sequential metabolism was assumed to be negligible. (B) Formation clearance of the 24,25-(OH)2-Vit D3 was greater in MPS-seeded PTEC cultured in media with both 0.5 μM 1α,25-(OH)2 -Vit D3 (calcitriol) and 1 μM 25-OH-Vit D3 (calcidiol) than those exposed to 1 μM calcidiol alone. Clearance values plotted at midpoint of collection interval. Sequential metabolism was assumed to be negligible. Baseline data point (×) for formation clearance was determined from experiment presented in (A). Effect of calcitriol on gene expression of (C) CYP24A1, (D) CYP27B1 and (E) VDR in MPS-seeded PTEC. Relative accumulation of CYP24A1 mRNA transcripts was greater in MPS-seeded PTEC cultured in media with both 1α,25-(OH)2 -Vit D3 (calcitriol) and 25-OH-Vit D3 (calcidiol) than those exposed to calcidiol alone. Induction of CYP24A1 mRNA occurred rapidly (5 hours) and persisted for the duration of treatment (3 days). No detectable (ND) transcripts of CYP24A1 were observed in the 5 hour “Calcidiol Only” group. There were no substantial changes in CYP27B1 and VDR mRNA expression over the duration of treatment. All genes of interest were standardized to GAPDH.
Fig. 8
Fig. 8
Comparison of trans-epithelial transport of PAH across PTEC monolayers in a conventional 2D Transwell™ and a flow-directed 3D MPS. (A) In a Transwell ™ monolayer, probenecid had no effect as depicted by no change in the mean PAH Papp values between inhibitor and control group. Papp values were derived as explained in SI Methods. (B) In a flow-directed 3D MPS, probenecid reduced the secretion of PAH by approximately 4-fold.
Fig. 9
Fig. 9
Trans-epithelial transport of uremic solute indoxyl sulfate in a flow directed human PTEC 3D MPS. (A) Indoxyl sulfate secretion in MPS device, inhibitable by probenecid. (B) PAH-Indoxyl sulfate interaction as demonstrated by inhibition of PAH secretion by 2 mM indoxyl sulfate.

References

    1. Morrissey KM, Stocker SL, Wittwer MB, Xu L, Giacomini KM. Renal transporters in drug development. Annu Rev Pharmacol Toxicol. 2013;53:503–29. - PubMed
    1. Blackburn JG, Hazen-Martin DJ, Detrisac CJ, Sens DA. Electrophysiology and ultrastructure of cultured human proximal tubule cells. Kidney Int. 1988 Feb;33(2):508–16. - PubMed
    1. Brown CD, Sayer R, Windass AS, Haslam IS, De Broe ME, D’Haese PC, et al. Characterisation of human tubular cell monolayers as a model of proximal tubular xenobiotic handling. Toxicology and applied pharmacology. 2008 Dec 15;233(3):428–38. - PubMed
    1. Lote CJ. Principles of renal physiology. 4. Dordrecht ; London: Kluwer Academic; 2000.
    1. Kelly EJ, Wang Z, Voellinger JL, Yeung CK, Shen DD, Thummel KE, et al. Innovations in preclinical biology: ex vivo engineering of a human kidney tissue microperfusion system. Stem cell research & therapy. 2013;4(Suppl 1):S17. - PMC - PubMed

Publication types