

Changes in the Lethality of Frailty Over 30 Years: Evidence From Two Cohorts of 70-Year-Olds in Gothenburg Sweden
- PMID: 27522060
- PMCID: PMC5458400
- DOI: 10.1093/gerona/glw160
Changes in the Lethality of Frailty Over 30 Years: Evidence From Two Cohorts of 70-Year-Olds in Gothenburg Sweden
Abstract
Background: With aging, health deficits accumulate: people with few deficits for their age are fit, and those with more are frail. Despite recent reports of improved health in old age, how deficit accumulation is changing is not clear. Our objectives were to evaluate changes over 30 years in the degree of deficit accumulation and in the relationship between frailty and mortality in older adults.
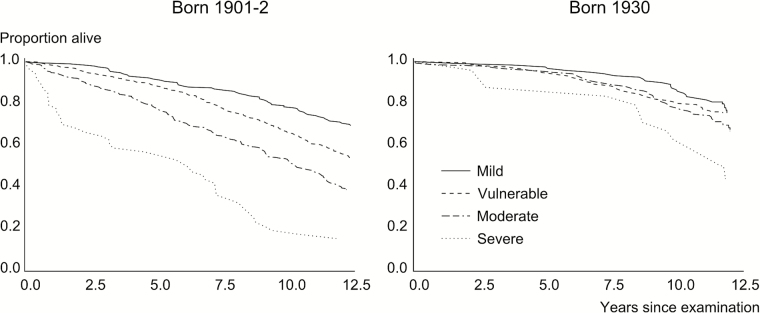
Methods: We analyzed data from two population based, prospective longitudinal cohorts, assembled in 1971-1972 and 2000-2001, respectively. Residents of Gothenburg Sweden, systematically drawn from the Swedish population registry. The 1901-1902 cohort (N = 973) had a response rate of 84.8%; the 1930 cohort (N = 500) had a response rate of 65.1%. A frailty index using 36 deficits was calculated using data from physical examinations, assessments of physical activity, daily, sensory and social function, and laboratory tests. We evaluated mortality over 12.5 years in relation to the frailty index.
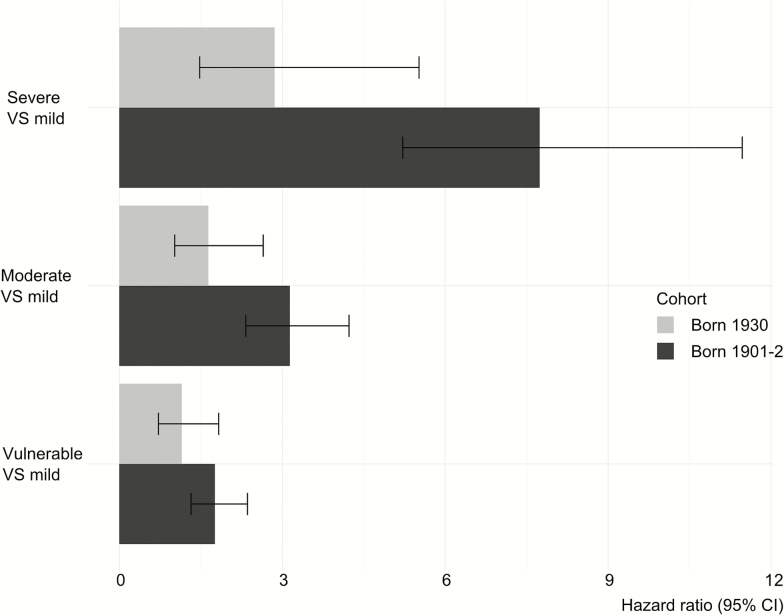
Results: Mean frailty levels were the same (x¯ = 0.20, p = .37) in the 1901-1902 cohort as in the 1930 cohort. Although the frailty index was linked to the risk of death in both cohorts, the hazards ratio decreased from 1.67 per 0.1 increment in the frailty index for the first cohort to 1.32 for the second cohort (interaction term p = .005).
Discussion: Although frailty was as common at age 70 as before, its lethality appears to be less. Just why this is so should be explored further.
Keywords: Cohort effects; Deficit accumulation; Frail older adults; Frailty index; Mortality.
© The Author 2016. Published by Oxford University Press on behalf of The Gerontological Society of America. All rights reserved. For permissions, please e-mail: journals.permissions@oup.com.
Figures
References
-
- Manton KG. Recent declines in chronic disability in the elderly U.S. population: risk factors and future dynamics. Annu Rev Public Health. 2008;29:91–113. doi:10.1146/annurev.publhealth.29.020907.090812 - PubMed
-
- Shamliyan T, Talley KM, Ramakrishnan R, et al. Association of frailty with survival: a systematic literature review. Ageing Res Rev. 2013;12(2):719–736. doi:10.1016/j.arr.2012.03.001 - PubMed
-
- Rockwood K, Mitnitski A, Song X, et al. Long term risks of death and institutionalization of elderly people in relation to deficit accumulation at age 70. J Am Geriatr Soc. 2006;54(6):975–979. doi:10.1111/j.1532-5415.2006.00738.x - PubMed
MeSH terms
LinkOut - more resources
Full Text Sources
Other Literature Sources
