Spatial Mechanisms within the Dorsal Visual Pathway Contribute to the Configural Processing of Faces
- PMID: 27522076
- PMCID: PMC6248673
- DOI: 10.1093/cercor/bhw224
Spatial Mechanisms within the Dorsal Visual Pathway Contribute to the Configural Processing of Faces
Abstract
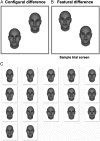
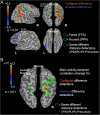
Human face recognition is often attributed to configural processing; namely, processing the spatial relationships among the features of a face. If configural processing depends on fine-grained spatial information, do visuospatial mechanisms within the dorsal visual pathway contribute to this process? We explored this question in human adults using functional magnetic resonance imaging and transcranial magnetic stimulation (TMS) in a same-different face detection task. Within localized, spatial-processing regions of the posterior parietal cortex, configural face differences led to significantly stronger activation compared to featural face differences, and the magnitude of this activation correlated with behavioral performance. In addition, detection of configural relative to featural face differences led to significantly stronger functional connectivity between the right FFA and the spatial processing regions of the dorsal stream, whereas detection of featural relative to configural face differences led to stronger functional connectivity between the right FFA and left FFA. Critically, TMS centered on these parietal regions impaired performance on configural but not featural face difference detections. We conclude that spatial mechanisms within the dorsal visual pathway contribute to the configural processing of facial features and, more broadly, that the dorsal stream may contribute to the veridical perception of faces.
Trial registration: ClinicalTrials.gov NCT00001360.
Keywords: TMS; fMRI; face perception; spatial perception.
Published by Oxford University Press 2016.
Figures


Similar articles
-
Double dissociation of configural and featural face processing on P1 and P2 components as a function of spatial attention.Psychophysiology. 2016 Aug;53(8):1165-73. doi: 10.1111/psyp.12669. Epub 2016 May 11. Psychophysiology. 2016. PMID: 27167853
-
The Fusiform and Occipital Face Areas Can Process a Nonface Category Equivalently to Faces.J Cogn Neurosci. 2018 Oct;30(10):1499-1516. doi: 10.1162/jocn_a_01288. Epub 2018 Jun 7. J Cogn Neurosci. 2018. PMID: 29877768
-
Featural and configural face processing strategies: evidence from a functional magnetic resonance imaging study.Neuroreport. 2008 Feb 12;19(3):287-91. doi: 10.1097/WNR.0b013e3282f556fe. Neuroreport. 2008. PMID: 18303568
-
A hierarchy of visual processing deficits in body dysmorphic disorder: a conceptual review and empirical investigation.Cogn Neuropsychiatry. 2024 Mar;29(2):116-140. doi: 10.1080/13546805.2024.2326243. Epub 2024 Apr 2. Cogn Neuropsychiatry. 2024. PMID: 38563811 Review.
-
Distributed and interactive brain mechanisms during emotion face perception: evidence from functional neuroimaging.Neuropsychologia. 2007 Jan 7;45(1):174-94. doi: 10.1016/j.neuropsychologia.2006.06.003. Epub 2006 Jul 18. Neuropsychologia. 2007. PMID: 16854439 Review.
Cited by
-
Contributions of low- and high-level contextual mechanisms to human face perception.PLoS One. 2023 May 2;18(5):e0285255. doi: 10.1371/journal.pone.0285255. eCollection 2023. PLoS One. 2023. PMID: 37130144 Free PMC article.
-
Visual system structural and functional connections during face viewing in body dysmorphic disorder.bioRxiv [Preprint]. 2024 Jul 16:2024.07.12.603273. doi: 10.1101/2024.07.12.603273. bioRxiv. 2024. PMID: 39071433 Free PMC article. Preprint.
-
Configural but Not Featural Face Information Is Associated With Automatic Processing.Front Hum Neurosci. 2022 Apr 13;16:884823. doi: 10.3389/fnhum.2022.884823. eCollection 2022. Front Hum Neurosci. 2022. PMID: 35496070 Free PMC article.
-
An expanded neural framework for shape perception.Trends Cogn Sci. 2023 Mar;27(3):212-213. doi: 10.1016/j.tics.2022.12.001. Epub 2023 Jan 10. Trends Cogn Sci. 2023. PMID: 36635181 Free PMC article. No abstract available.
-
Protracted Developmental Trajectory of Shape Processing along the Two Visual Pathways.J Cogn Neurosci. 2019 Oct;31(10):1589-1597. doi: 10.1162/jocn_a_01434. Epub 2019 Jun 10. J Cogn Neurosci. 2019. PMID: 31180266 Free PMC article.
References
-
- Avidan G, Hasson U, Malach R, Behrmann M. 2005. Detailed exploration of face-related processing in congenital prosopagnosia: 2. Functional neuroimaging findings. J. Cognitive Neurosci. 17:1150–67. - PubMed
-
- Barton JJ. 2008. Structure and function in acquired prosopagnosia: lessons from a series of 10 patients with brain damage. J Neuropsychol. 2:197–225. - PubMed
-
- Bellugi U, Lichtenberger L, Jones W, Lai Z, St George M. 2000. I. The neurocognitive profile of Williams Syndrome: a complex pattern of strengths and weaknesses. J Cogn Neurosci. 12:7–29. - PubMed
-
- Busigny T, Graf M, Mayer E, Rossion B. 2010. Acquired prosopagnosia as a face-specific disorder: ruling out the general visual similarity account. Neuropsychologia. 48:2051–2067. - PubMed
Publication types
MeSH terms
Associated data
LinkOut - more resources
Full Text Sources
Other Literature Sources
Medical

