

Phase Dependency of the Human Primary Motor Cortex and Cholinergic Inhibition Cancelation During Beta tACS
- PMID: 27522077
- PMCID: PMC5028010
- DOI: 10.1093/cercor/bhw245
Phase Dependency of the Human Primary Motor Cortex and Cholinergic Inhibition Cancelation During Beta tACS
Abstract
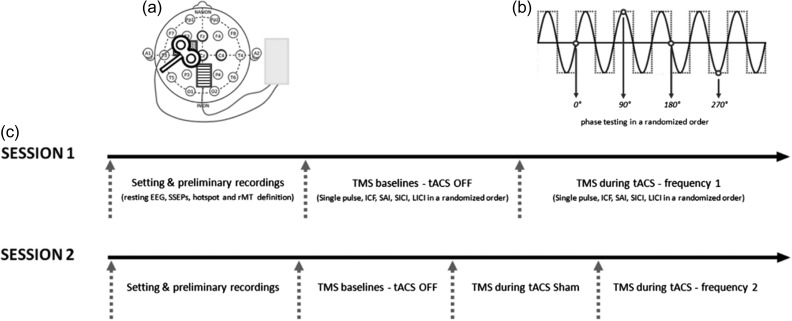
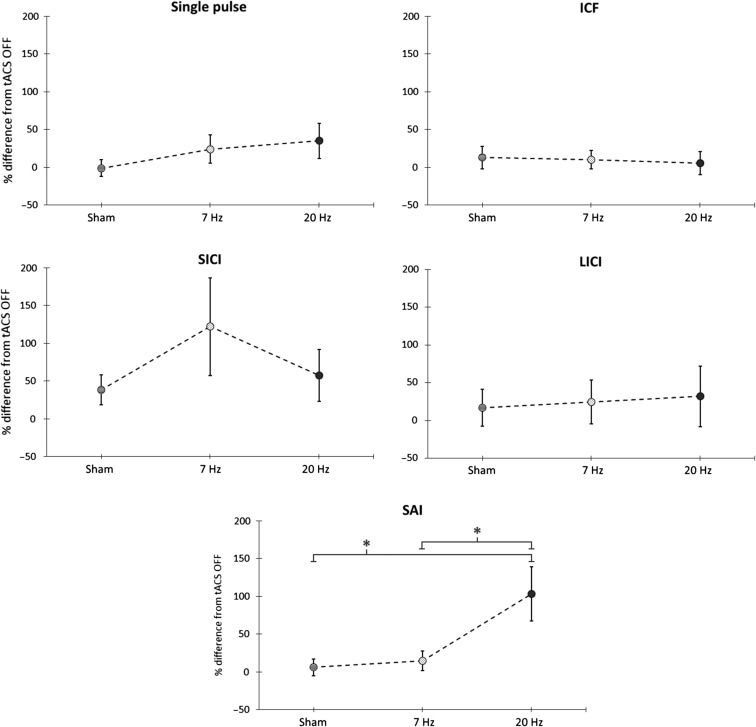
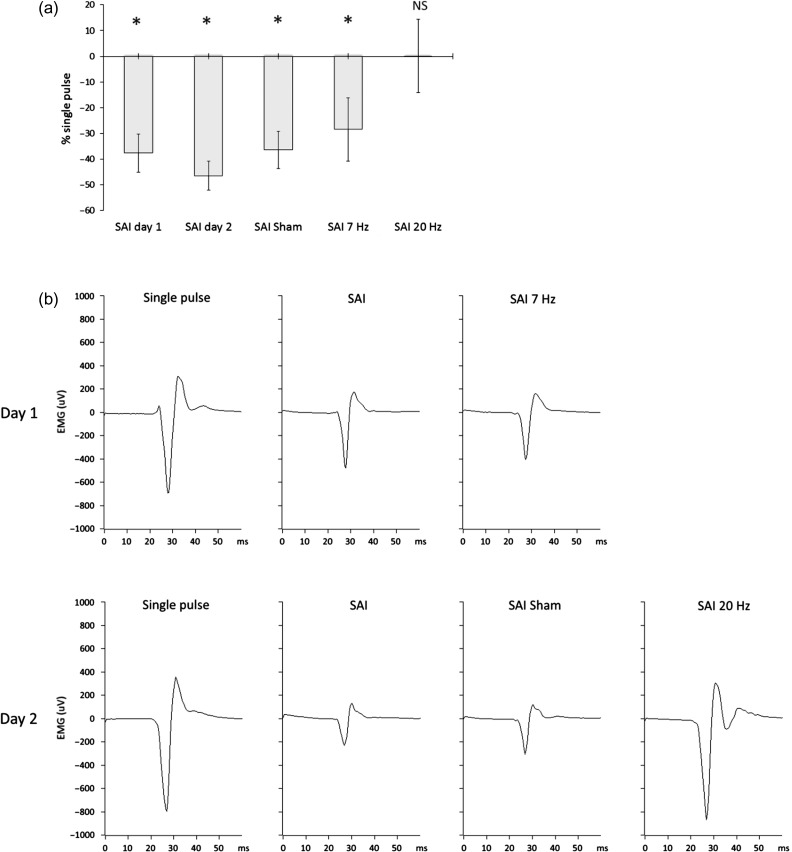
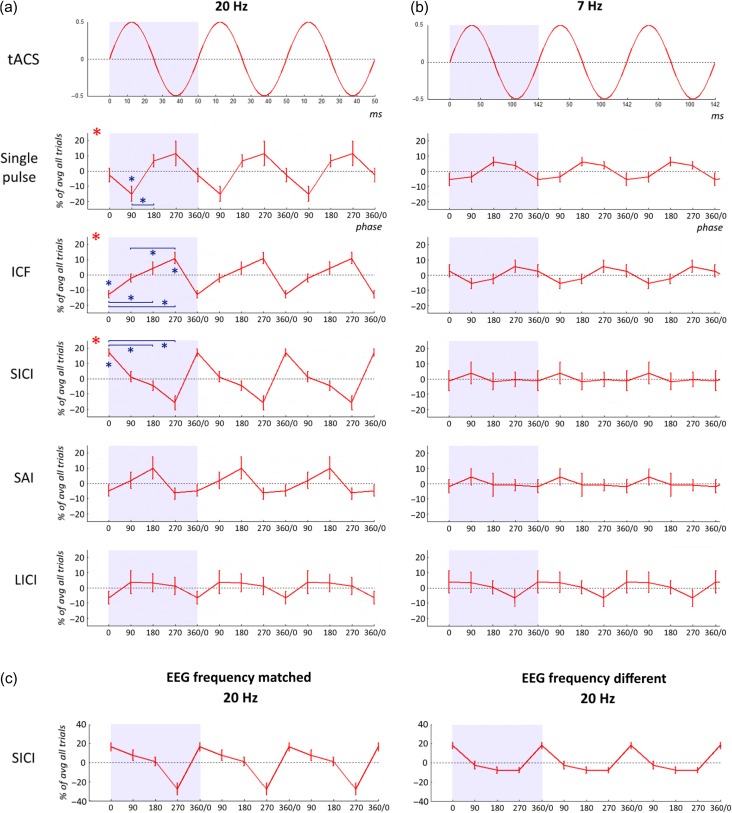
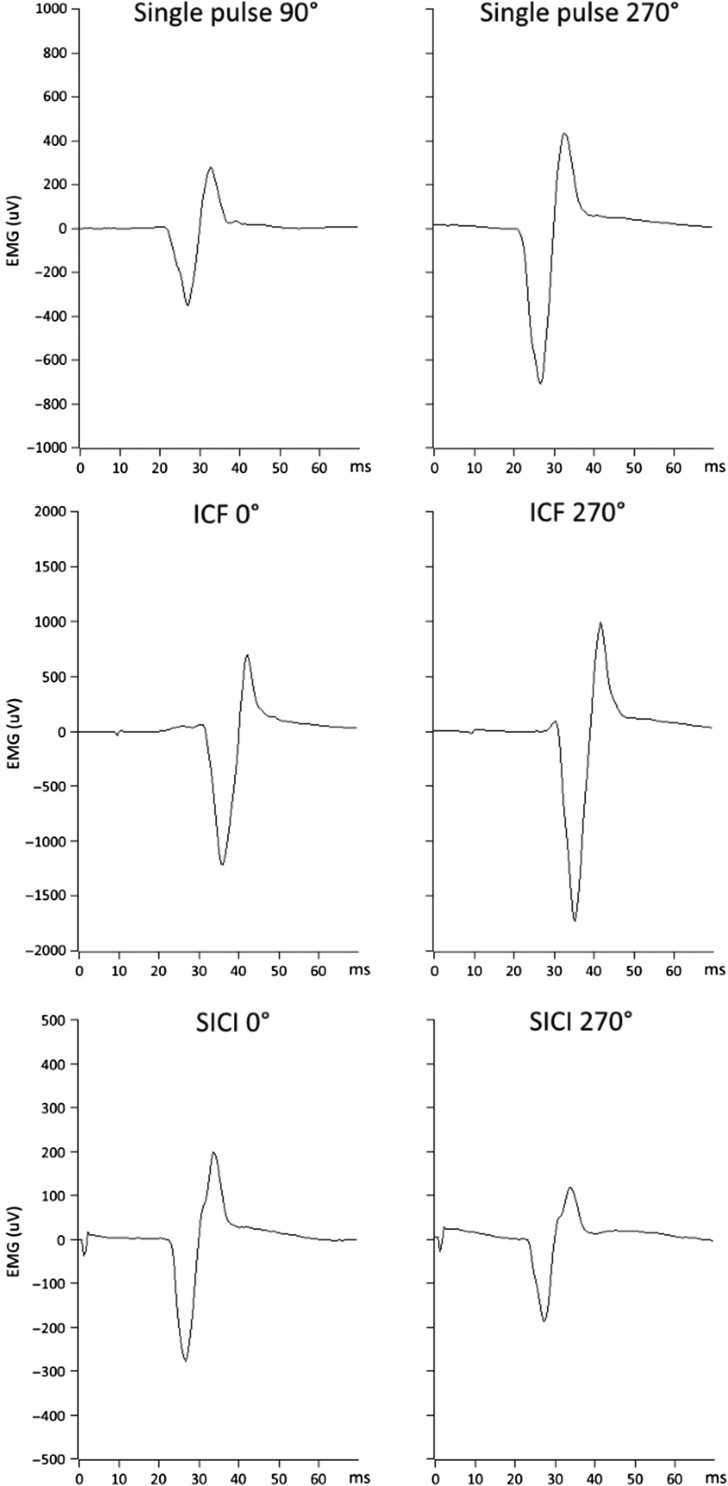
The human motor cortex has a tendency to resonant activity at about 20 Hz so stimulation should more readily entrain neuronal populations at this frequency. We investigated whether and how different interneuronal circuits contribute to such resonance by using transcranial magnetic stimulation (TMS) during transcranial alternating current stimulation (tACS) at motor (20 Hz) and a nonmotor resonance frequency (7 Hz). We tested different TMS interneuronal protocols and triggered TMS pulses at different tACS phases. The effect of cholinergic short-latency afferent inhibition (SAI) was abolished by 20 Hz tACS, linking cortical beta activity to sensorimotor integration. However, this effect occurred regardless of the tACS phase. In contrast, 20 Hz tACS selectively modulated MEP size according to the phase of tACS during single pulse, GABAAergic short-interval intracortical inhibition (SICI) and glutamatergic intracortical facilitation (ICF). For SICI this phase effect was more marked during 20 Hz stimulation. Phase modulation of SICI also depended on whether or not spontaneous beta activity occurred at ~20 Hz, supporting an interaction effect between tACS and underlying circuit resonances. The present study provides in vivo evidence linking cortical beta activity to sensorimotor integration, and for beta oscillations in motor cortex being promoted by resonance in GABAAergic interneuronal circuits.
Keywords: SAI, tACS; TMS; beta; phase.
© The Author 2016. Published by Oxford University Press.
Figures
Similar articles
-
Neural mechanisms underlying the after-effects of repetitive paired-pulse TMS with Β tACS on the human primary motor cortex.Sci Rep. 2025 Mar 1;15(1):7286. doi: 10.1038/s41598-025-92444-4. Sci Rep. 2025. PMID: 40025222 Free PMC article.
-
LTD-like plasticity of the human primary motor cortex can be reversed by γ-tACS.Brain Stimul. 2019 Nov-Dec;12(6):1490-1499. doi: 10.1016/j.brs.2019.06.029. Epub 2019 Jul 3. Brain Stimul. 2019. PMID: 31289014
-
Detecting cortical circuits resonant to high-frequency oscillations in the human primary motor cortex: a TMS-tACS study.Sci Rep. 2020 May 6;10(1):7695. doi: 10.1038/s41598-020-64717-7. Sci Rep. 2020. PMID: 32376946 Free PMC article. Clinical Trial.
-
Effects of 10 Hz and 20 Hz Transcranial Alternating Current Stimulation on Automatic Motor Control.Brain Stimul. 2016 Jul-Aug;9(4):518-24. doi: 10.1016/j.brs.2016.01.001. Epub 2016 Mar 18. Brain Stimul. 2016. PMID: 27038707
-
Probing phase- and frequency-dependent characteristics of cortical interneurons using combined transcranial alternating current stimulation and transcranial magnetic stimulation.J Neurophysiol. 2017 Jun 1;117(6):2085-2087. doi: 10.1152/jn.00060.2017. Epub 2017 Feb 22. J Neurophysiol. 2017. PMID: 28228580 Free PMC article. Review.
Cited by
-
Frequency-dependent spike-pattern changes in motor cortex during thalamic deep brain stimulation.J Neurophysiol. 2020 Nov 1;124(5):1518-1529. doi: 10.1152/jn.00198.2020. Epub 2020 Sep 23. J Neurophysiol. 2020. PMID: 32965147 Free PMC article.
-
The Influence of Conscious and Unconscious Body Threat Expressions on Motor Evoked Potentials Studied With Continuous Flash Suppression.Front Neurosci. 2018 Jul 16;12:480. doi: 10.3389/fnins.2018.00480. eCollection 2018. Front Neurosci. 2018. PMID: 30061812 Free PMC article.
-
Probing the Link Between Perception and Oscillations: Lessons from Transcranial Alternating Current Stimulation.Neuroscientist. 2020 Feb;26(1):57-73. doi: 10.1177/1073858419828646. Epub 2019 Feb 7. Neuroscientist. 2020. PMID: 30730265 Free PMC article. Review.
-
Movement-related beta oscillations show high intra-individual reliability.Neuroimage. 2017 Feb 15;147:175-185. doi: 10.1016/j.neuroimage.2016.12.025. Epub 2016 Dec 10. Neuroimage. 2017. PMID: 27965146 Free PMC article.
-
A Fast EEG Forecasting Algorithm for Phase-Locked Transcranial Electrical Stimulation of the Human Brain.Front Neurosci. 2017 Jul 20;11:401. doi: 10.3389/fnins.2017.00401. eCollection 2017. Front Neurosci. 2017. PMID: 28775678 Free PMC article.
References
-
- Alegre M, Labarga A, Gurtubay IG, Iriarte J, Malanda A, Artieda J. 2002. Beta electroencephalograph changes during passive movements: sensory afferences contribute to beta event-related desynchronization in humans. Neurosci Lett. 331:29–32. - PubMed
-
- Bikmullina R, Kicic D, Carlson S, Nikulin VV. 2009. Electrophysiological correlates of short-latency afferent inhibition: a combined EEG and TMS study. Exp Brain Res. 194:517–526. - PubMed
-
- Buzsaki G, Draguhn A. 2004. Neuronal oscillations in cortical networks. Science. 304:1926–1929. - PubMed
MeSH terms
Grants and funding
LinkOut - more resources
Full Text Sources
Other Literature Sources
