. 2016 Oct;10(8):1305-16.
doi: 10.1016/j.molonc.2016.07.001. Epub 2016 Jul 12.

Plasma protein profiling in a stage defined pancreatic cancer cohort - Implications for early diagnosis

Affiliations

Plasma protein profiling in a stage defined pancreatic cancer cohort - Implications for early diagnosis

Anna Sandström Gerdtsson et al. Mol Oncol. 2016 Oct.

Abstract

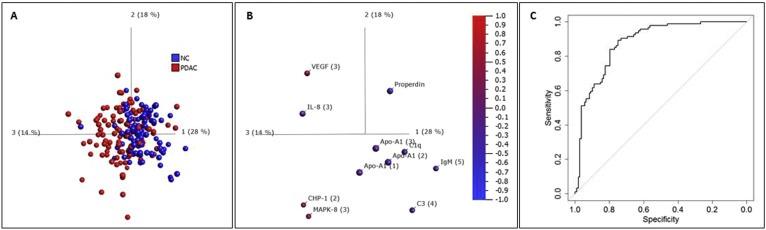
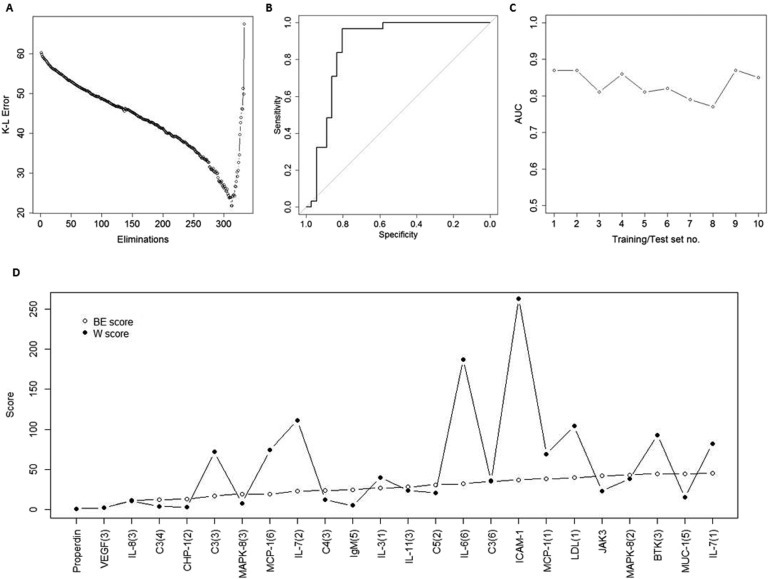
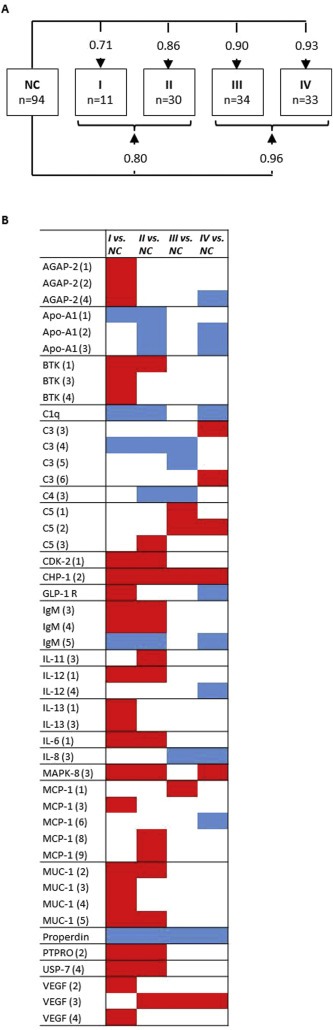
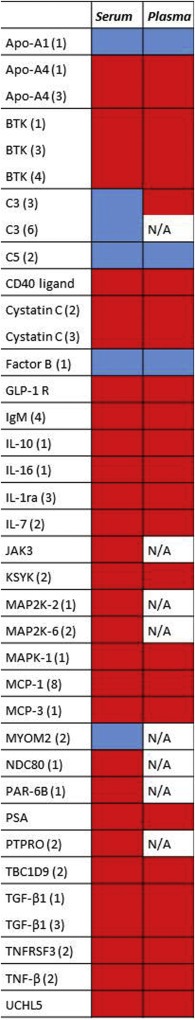
Pancreatic ductal adenocarcinoma (PDAC) is a disease where detection preceding clinical symptoms significantly increases the life expectancy of patients. In this study, a recombinant antibody microarray platform was used to analyze 213 Chinese plasma samples from PDAC patients and normal control (NC) individuals. The cohort was stratified according to disease stage, i.e. resectable disease (stage I/II), locally advanced (stage III) and metastatic disease (stage IV). Support vector machine analysis showed that all PDAC stages could be discriminated from controls and that the accuracy increased with disease progression, from stage I to IV. Patients with stage I/II PDAC could be discriminated from NC with high accuracy based on a plasma protein signature, indicating a possibility for early diagnosis and increased detection rate of surgically resectable tumors.

Keywords: Antibody microarrays; Biomarker signatures; Early detection; Pancreatic cancer; Recombinant antibodies.


Figures

Figure 1
Figure 1
Discrimination of PDAC vs. NC. (A) Principal component analysis (PCA) of PDAC (red) and NC (blue). The data was filtered to q < 0.1 using ANOVA; (B) Relative protein levels demonstrated by the 11 antibodies that remained after filtering in a PCA plot synchronized to the one in (A). Red = up‐regulated levels, blue = down‐regulated levels in PDAC vs. NC; (C) ROC‐curve with AUC of 0.88 from SVM analysis with leave‐one‐out cross‐validation of PDAC vs. NC based on unfiltered data (using data from all antibodies).
Figure 2
Figure 2
Identification of plasma protein signatures for PDAC. A training set and a test set was generated by randomized selection of 2/3 of samples from each group (PDAC and NC) to the training set, and the remaining 1/3 of samples to the test set. The training set was used to define a condensed signature for discriminating PDAC from NC. (A) Filtering of variables was conducted by a SVM‐based stepwise backward elimination of the antibodies in the training set. In each iterative step, the Kullback–Liebler (K–L) error of the classification was determined and plotted. The antibodies that remained in the elimination process when the classification error reached its minimum value were used as a unique signature for constructing a new model in the training set; (B) ROC‐curve resulting from the signature model from the training set, “frozen” and directly applied onto the previously unseen test set samples; (C) The procedure was repeated to a total of ten times, in ten different sets of randomly created training and test sets. The area under the ROC‐curve (AUC values) generated by the frozen biomarker signature models in each corresponding test set were plotted; (D) The antibody score derived from the overall ranking in the backward elimination (BE) process (open circles) was compared to the score based on the Wilcoxon (W) test ranking (filled circles).
Figure 3
Figure 3
Discrimination of PDAC stages vs. controls. (A) AUC‐values from SVM analysis with leave‐one‐out cross validation using unfiltered data (all antibodies), comparing NC to patients grouped according to their PDAC stage. (B) Antibodies with Wilcoxon p < 0.05 in one or more PDAC stages vs NC. Red = up‐regulated, blue = down‐regulated in PDAC vs NC, white = no significant difference.
Figure 4
Figure 4
Differentiation of primary tumor location and comparison to a previous study in serum (Gerdtsson et al., 2015). Red = up‐regulated, blue = down‐regulated in Head vs Body/Tail tumors, N/A = antibody not included in study.

References

    1. Alonzo, T.A. , Pepe, M.S. , Moskowitz, C.S. , 2002. Sample size calculations for comparative studies of medical tests for detecting presence of disease. Stat. Med. 21, 835–852. - PubMed
    1. Bauden, M. , Pamart, D. , Ansari, D. , Herzog, M. , Eccleston, M. , Micallef, J. , Andersson, B. , Andersson, R. , 2015. Circulating nucleosomes as epigenetic biomarkers in pancreatic cancer. Clin. Epigenetics 7, 106 - PMC - PubMed
    1. Bellone, G. , Smirne, C. , Mauri, F.A. , Tonel, E. , Carbone, A. , Buffolino, A. , Dughera, L. , Robecchi, A. , Pirisi, M. , Emanuelli, G. , 2006. Cytokine expression profile in human pancreatic carcinoma cells and in surgical specimens: implications for survival. Cancer Immunol. Immunother. 55, 684–698. - PMC - PubMed
    1. Borrebaeck, C.A. , Wingren, C. , 2011. Recombinant antibodies for the generation of antibody arrays. Methods Mol. Biol. 785, 247–262. - PubMed
    1. Brand, R.E. , Nolen, B.M. , Zeh, H.J. , Allen, P.J. , Eloubeidi, M.A. , Goldberg, M. , Elton, E. , Arnoletti, J.P. , Christein, J.D. , Vickers, S.M. , Langmead, C.J. , Landsittel, D.P. , Whitcomb, D.C. , Grizzle, W.E. , Lokshin, A.E. , 2011. Serum biomarker panels for the detection of pancreatic cancer. Clin. Cancer Res. 17, 805–816. - PMC - PubMed