. 2016 Sep 7;91(5):1154-1169.
doi: 10.1016/j.neuron.2016.07.032. Epub 2016 Aug 11.

Hunger-Dependent Enhancement of Food Cue Responses in Mouse Postrhinal Cortex and Lateral Amygdala

Affiliations

Hunger-Dependent Enhancement of Food Cue Responses in Mouse Postrhinal Cortex and Lateral Amygdala

Christian R Burgess et al. Neuron. .

Abstract

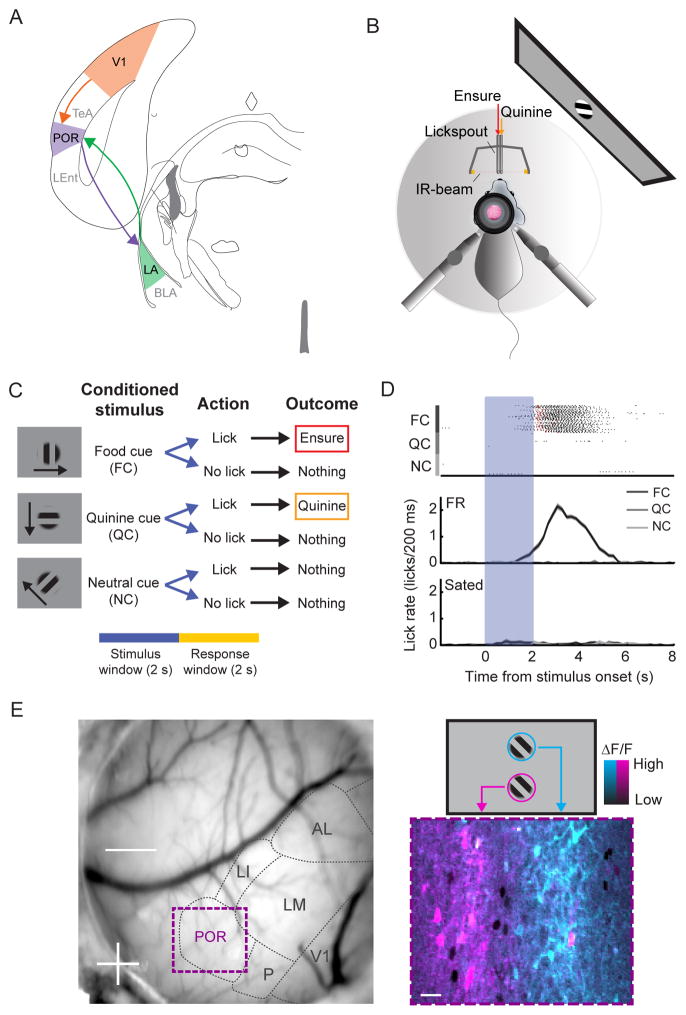
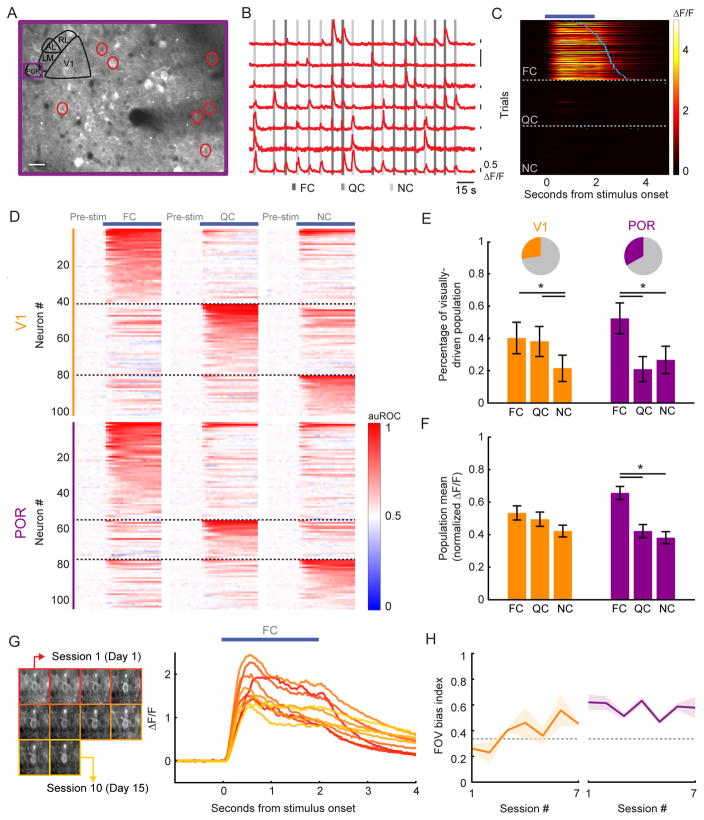
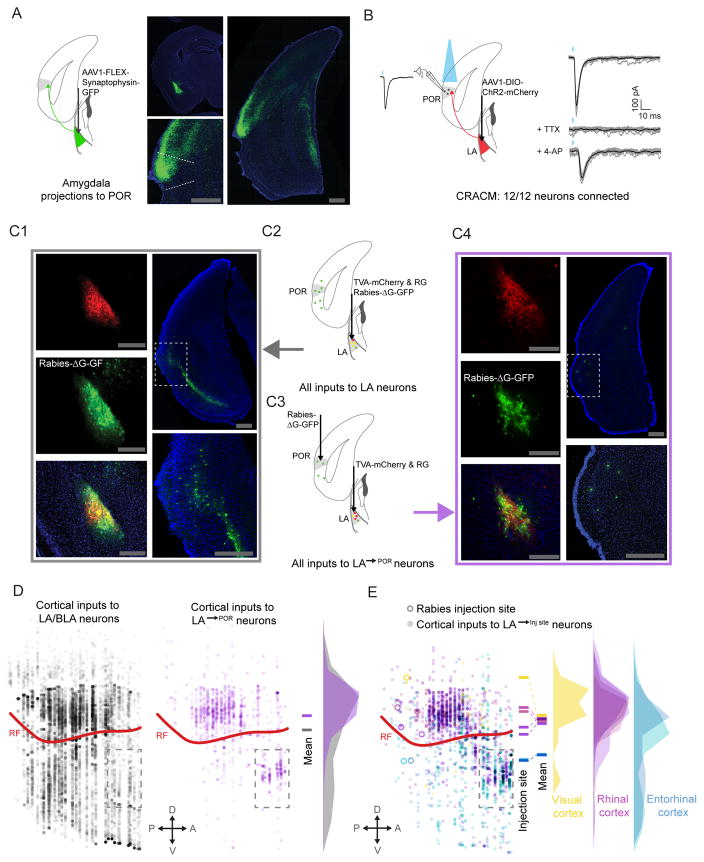
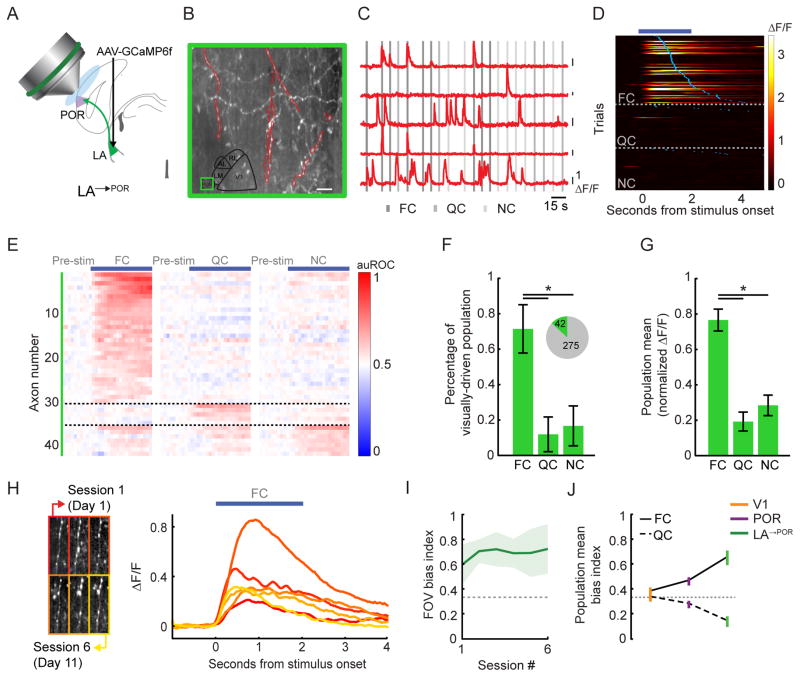
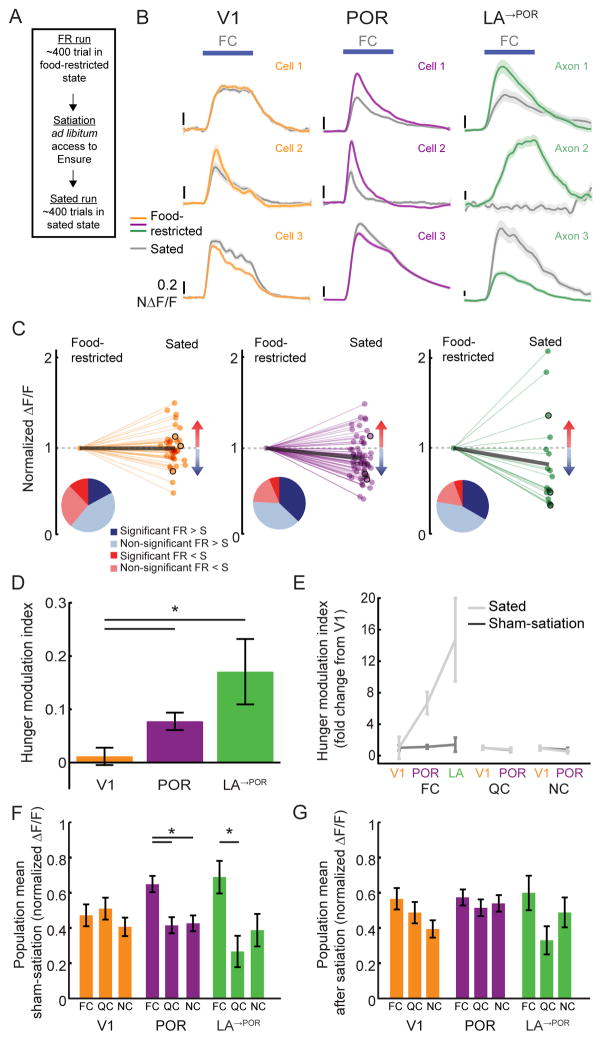
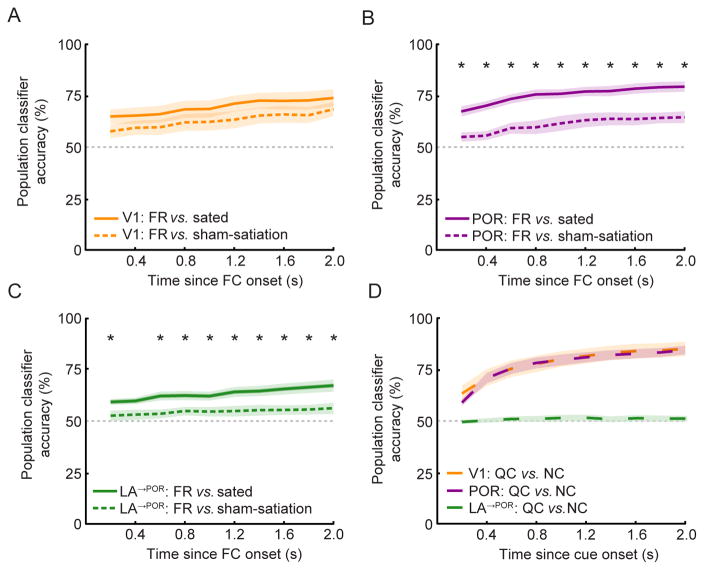
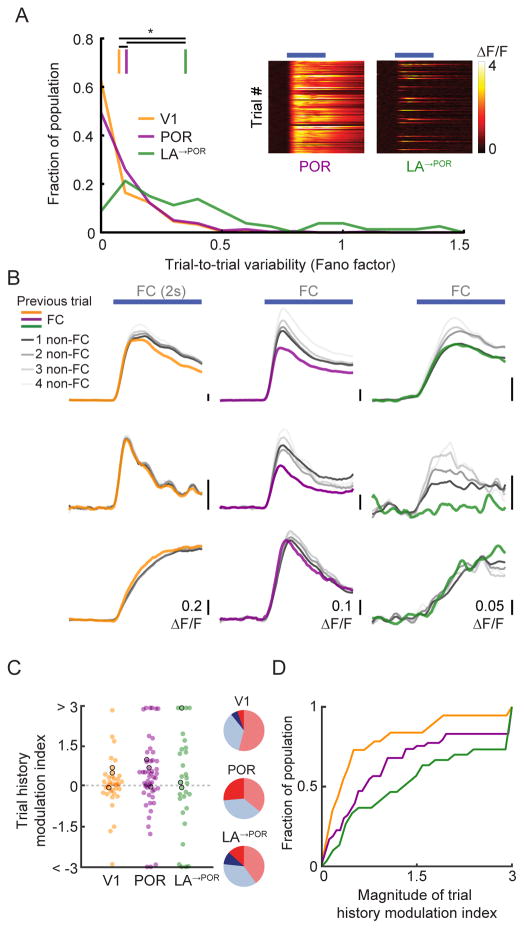
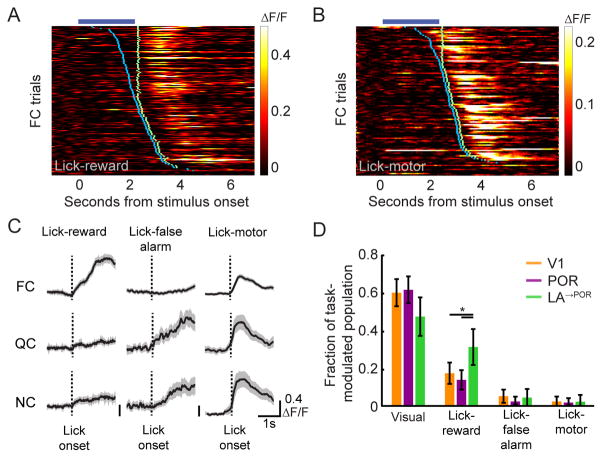
The needs of the body can direct behavioral and neural processing toward motivationally relevant sensory cues. For example, human imaging studies have consistently found specific cortical areas with biased responses to food-associated visual cues in hungry subjects, but not in sated subjects. To obtain a cellular-level understanding of these hunger-dependent cortical response biases, we performed chronic two-photon calcium imaging in postrhinal association cortex (POR) and primary visual cortex (V1) of behaving mice. As in humans, neurons in mouse POR, but not V1, exhibited biases toward food-associated cues that were abolished by satiety. This emergent bias was mirrored by the innervation pattern of amygdalo-cortical feedback axons. Strikingly, these axons exhibited even stronger food cue biases and sensitivity to hunger state and trial history. These findings highlight a direct pathway by which the lateral amygdala may contribute to state-dependent cortical processing of motivationally relevant sensory cues.


Figures

Figure 1
Figure 1. In vivo two-photon imaging of head-fixed mice during a Go/NoGo visual discrimination task
A. Schematic of a V1 - POR - LA circuit. B. Schematic of setup for in vivo two-photon imaging in a mouse performing a Go/NoGo visual discrimination task. Licking is tracked via an IR beam positioned in front of the mouse. Ensure and quinine are delivered via adjacent lickspouts. C. The task consists of three square-wave gratings drifting in different directions. The cues are presented for 2 s, followed by a 2 s response window. If mice respond with a lick following offset of (i) the food cue (FC), they receive Ensure, (ii) the quinine cue (QC), they receive quinine, and (iii) the neutral cue (NC), they receive nothing. D. Mice learned to lick following the FC but not following the NC or QC (top: individual licks denoted in black, Ensure delivery in red, quinine delivery in orange). Food-restricted mice performed at a high level. Following satiation, mice refrained from licking and received far fewer food rewards. E. Left: Image of the mouse brain through a cranial window with visual areas demarcated based on intrinsic autofluorescence signal retinotopic mapping, which guided the injection of AAV-GCaMP6f into either V1 or POR. Further retinotopic mapping was done using two-photon calcium imaging of GCaMP6 responses. Bottom right: pseudocolor image of average cellular responses (ΔF/F) to stimuli presented either at the top (blue) or bottom (pink) of the screen (see also schematic, top right). See also Figure S1.
Figure 2
Figure 2. POR, but not V1, demonstrates a response bias to food-associated cues in food-restricted mice
A. Example two-photon image of GCaMP6f expression in POR. Depth: 130 μm. B. ΔF/F traces from example neurons circled in A. A 50% change in fluorescence (0.5 ΔF/F) is denoted via each black vertical line. Many neurons were responsive to specific visual cues (shaded gray vertical lines). C. Heatmap of single trial cue-evoked response timecourses (ΔF/F) from an example POR neuron, sorted by visual cue and by latency to first lick (blue ticks). Dark blue bar denotes duration of cue presentation. D. Normalized auROC timecourses (auROC: area under the receiver operating characteristic) for all significantly driven neurons recorded in V1 and POR. Neurons were sorted according to their preferred cue. E. Of all recorded cells, 27% in V1 and 33% in POR had a significant cue-evoked response (pie charts). Of these responsive neurons, a significant proportion preferred the FC vs. the QC in POR, but not in V1. Errorbars: 95% confidence intervals. F. By normalizing cellular tuning curves to the largest response and averaging across all responsive neurons, we observed a bias in the mean population response to the FC in POR, but not in V1. Errorbars: SEM across cells. G. Stable mean food cue-evoked timecourses (right) for one example neuron that was recorded in 10 imaging sessions over 15 days (left). H. During each imaging session for each well-trained mouse, we calculated a FC bias index (dashed line at 0.33: no bias towards the food cue) across the field-of-view (FOV). We observed a strong bias towards the FC that was stable across daily sessions in populations of neurons recorded in POR (right) but not in V1 (left). Errorbars: SEM across animals. *p<0.001, 2-way ANOVA; FC: food cue; QC: quinine cue; NC: neutral cue. Tests on proportions: Tukey’s HSD. See also Figures S2–S4.
Figure 3
Figure 3. Reciprocal excitatory connectivity between POR and LA
A. Anterograde viral tracing, using cre-dependent AAV-synaptophysin-GFP, demonstrated dense input from LA to POR. B. In vitro ChR2-assisted circuit mapping (CRACM) demonstrated a strong, functional excitatory connection from LA to L2/3 pyramidal neurons in POR (n=12/12). TTX (1 μM) and 4-AP (100 μM) were added to the bath solution in order to confirm monosynaptic connectivity. C. Rabies-based retrograde tracing was used to characterize inputs to glutamatergic LA neurons, and specifically to LA→POR neurons. TVA and rabies glycoprotein were selectively expressed in glutamatergic cells in LA (C1, top left) and G-deleted rabies virus was then injected into either LA (C1, middle and bottom left) or POR, causing LA→POR neurons to selectively be infected (C3 and C4, middle left and bottom left). Rabies-tracing (C2) of inputs to all glutamatergic LA neurons showed strong input from many areas in lateral cortex (C1, right). Projection-specific rabies tracing (C3–C4) of inputs specific to LA→POR neurons also revealed inputs from lateral cortex neurons. Many of these inputs appeared to be from rhinal cortices (C4, right), suggesting a disynaptic, reciprocal excitatory loop from POR to LA and back to POR. D. Using multi-synapse rabies tracing and whole-brain reconstruction and alignment methods, we confirmed that LA neurons that project to POR received input from a narrower band of neurons in cortex (purple discs), with the greatest density just above the rhinal fissure, in rhinal cortex. Rabies tracing of inputs to all glutamatergic LA neurons (C1–2) demonstrated a larger number and broader distribution of cortical input neurons (gray discs), although the greatest density was still in rhinal cortex. E. LA projections to different targets in lateral cortex received greater input from cortical regions near the target, suggesting the presence of local, disynaptic reciprocal loops in cortex. Neurons in the immediate vicinity of the LA (dashed rectangle below rhinal fissure) were excluded from analyses in D and E. POR: postrhinal cortex; LA: lateral amygdala; BLA: basolateral amygdala; V1: primary visual cortex; LEnt: lateral entorhinal cortex; rf: rhinal fissure; scale bar: 500 μm. See also Figure S5.
Figure 4
Figure 4. LA feedback axons in POR demonstrate a strong response bias to food-associated cues in food-restricted mice
A. Schematic demonstrating in vivo two-photon calcium imaging of LA axons in POR (LA→POR). B. Example two-photon image in POR, with a subset of LA→POR axons outlined in red. C. ΔF/F traces from those LA→POR axons outlined in B. A 100% change in fluorescence (ΔF/F) is denoted via each black vertical line. D. Heatmap of single trial cue-evoked response timecourses (ΔF/F) from an example FC-responsive LA→POR axon, sorted by visual cue and by latency to first lick (blue ticks). Dark blue bar denotes duration of cue presentation. E. Normalized auROC timecourses for all significantly driven LA→POR axons. Each neuron’s responses to all three cues are shown. Neurons are sorted by their preferred cue. Note the high proportion of FC-preferring neurons. F. We observed a significant visual cue-evoked response in 13% of all recorded LA→POR axons (pie charts). Most axons preferred the FC vs. the NC or QC. Errorbars: 95% confidence intervals. G. By normalizing cellular tuning curves to the largest response and averaging across all responsive LA→POR axons, we observed a strong bias towards the food cue. Errorbars: SEM across cells. H. Stable mean FC-evoked timecourses (right) for one example axon, recorded across 6 imaging sessions (left). I. During each imaging session for each well-trained mouse, we calculated a FC bias index (dashed line at 0.33: no bias towards the food cue) across the field-of-view (FOV). We observed a reliable population bias towards the FC in LA→POR axons across sessions. Errorbars: SEM across animals. J. Emergence of FC bias from V1 to POR to LA→POR. Errorbars: SEM across cells. * p<0.001, Kruskal-Wallis; FC: food cue; QC: quinine cue; NC: neutral cue. Tests on proportions: Tukey’s HSD. See also Figure S6.
Figure 5
Figure 5. Food cue responses in POR and LA are modulated by hunger state
A. After food-restricted (FR) mice performed ~400 trials of the Go/NoGo visual discrimination task, they were given free access to Ensure (while still head-fixed). Once mice were sated, they received ~400 additional trials (sated hit rate <25%; Figure S1B). In “sham-satiation” sessions, a similar ~45 minute period of time elapsed between early and late sets of trials, during which no Ensure was delivered (Figure S1A). B. Example traces from V1, POR, and LA→POR neuron responses in FR (colored lines) and sated (gray lines) mice. C. Normalized FC response magnitudes for those neurons that had a significant response to the FC and that were recorded in both FR and sated states. Values less than 1 indicate decreased responses when the mouse was sated. Pie charts illustrate proportions of neurons with responses that were increased (red), decreased (blue), significantly increased (dark red), or significantly decreased (dark blue) by satiation. Data from example neurons from (B) are outlined in black. Thick gray lines: population averages. D. The average hunger modulation index of FC responses was significantly greater in POR and LA→POR neurons than in V1 neurons. E. The increase in hunger-modulation index values in POR and LA→POR neurons (relative to the index value in V1 neurons) observed for the FC was not observed for the QC or NC, or for any cue in sham-satiation sessions. F. The FC bias in the population mean response in POR and LA (Figures 2F, 4G) persists following the sham-satiation condition. G. The FC bias was absent following satiation. Errorbars: SEM across cells. * p<0.05 2-way ANOVA; FC: food cue; QC: quinine cue; NC: neutral cue.
Figure 6
Figure 6. Differential decoding of hunger state vs. cue identity from single-trial ensemble activity across areas
A–C. Using single-trial FC responses in simultaneously-recorded populations of neurons, we could correctly predict hunger state with greater than chance (50%) accuracy using a simple linear classifier. In LA→POR (C) and POR (B) populations, the classifier performed significantly better in differentiating trials between food-restricted vs. sated conditions than between food-restricted vs. sham-satiation conditions, while this was not the case in V1 (A), suggesting that hunger state is more strongly represented in POR and LA→POR than in V1 populations. D. By contrast, when discriminating between the identity of two non-rewarded visual cues (QC vs. NC), the same classifier performed equally well using population responses of V1 or POR neurons, but at chance levels using population responses of LA→POR neurons (due to the low number of QC/NC responsive cells in LA). * p<0.005, Wilcoxon Rank-Sum, Bonferroni corrected; Errorbars: SEM. FC: food cue; QC: quinine cue; NC: neutral cue.
Figure 7
Figure 7. Trial history strongly modulates food cue responses in POR and LA
A. Fano factor, a measure of trial-to-trial variability, increased from V1 to POR to LA→POR. Insets show single-trial food cue response timecourses from an example POR neuron (left) and LA→POR axon (right) in individual sessions. B. Single-trial FC responses of V1, POR, and LA→POR neurons often depended on trial history. Colored lines represent responses to a FC when preceded by another FC, grayscale lines represent responses to the FC when preceded by one (dark) or many (lighter) non-FCs (QC or NC). C. Neurons in all three areas showed modulation of FC responses based on trial history, with greater proportions exhibiting large trial history effects in POR and LA→POR vs. V1. A positive trial history modulation index value indicates greater FC response when preceded by a non-FC. Pie charts show fraction of neurons with positive (red), negative (blue), significantly positive (dark red) or significantly negative (dark blue) index values. Neurons outlined in black are example neurons from (B). For display purposes, all values >3 or <-3 were set to 3 and −3, respectively. D. Cumulative distributions of the magnitude of index values, confirming that, as with hunger modulation, V1 neurons showed far less modulation by trial history than POR and LA→POR neurons (p=0.03, V1 vs. POR; p<0.001 V1 vs. LA→POR; Kruskal-Wallis).
Figure 8
Figure 8. LA→POR axons respond to reward in addition to visual cues
A–B. An example LA→POR axon that responds post-Ensure delivery, but not to presentation of the FC (A), and an example POR neuron that responds post-licking, but not to presentation of the FC (B). Blue tick marks denote the onset of licking on each trial, while green ticks denote Ensure delivery. C. Using a general linear model (GLM), we classified subsets of non-cue-responsive yet task-modulated cells, as illustrated by three example neurons from POR (left column), LA (middle column), and V1 (right column). ‘Lick-reward’ cells selectively increased their activity at lick onset on those trials where the animal correctly licked to presentation of a FC (but not following licking to the QC or NC). ‘Lick-false alarm’ cells only increased their activity at onset of licking in trials where the animal incorrectly licked to presentation of a QC or NC. ‘Lick-motor’ cells increased their activity to licking, irrespective of trial type. Errorbars: SEM. D. While some neurons in V1 and in POR demonstrated non-cue-responsive, task-related responses, a greater proportion of LA→POR axons were classified as ‘lick-reward.’ Errorbars: 95% confidence intervals. We also observed a small incidence of ‘multiplexed’ cells responsive to both visual and licking events (Figure S6D). * p<0.05, Tukey’s HSD. FC: food cue; QC: quinine cue; NC: neutral cue. See also Figures S7–8.

References

    1. Aitken TJ, Greenfield VY, Wassum KM. Nucleus accumbens core dopamine signaling tracks the need-based motivational value of food-paired cues. J Neurochem 2015 - PMC - PubMed
    1. Andermann ML, Kerlin AM, Roumis DK, Glickfeld LL, Reid RC. Functional specialization of mouse higher visual cortical areas. Neuron. 2011;72:1025–1039. - PMC - PubMed
    1. Aponte Y, Atasoy D, Sternson SM. AGRP neurons are sufficient to orchestrate feeding behavior rapidly and without training. Nat Neurosci. 2011;14:351–355. - PMC - PubMed
    1. Atiani S, David SV, Elgueda D, Locastro M, Radtke-Schuller S, Shamma SA, Fritz JB. Emergent selectivity for task-relevant stimuli in higher-order auditory cortex. Neuron. 2014;82:486–499. - PMC - PubMed
    1. Badre D, Frank MJ, Moore CI. Interactionist Neuroscience. Neuron. 2015;88:855–860. - PubMed

LinkOut - more resources