. 2016 Nov 15:142:394-406.
doi: 10.1016/j.neuroimage.2016.08.016. Epub 2016 Aug 11.

Denoising of diffusion MRI using random matrix theory

Affiliations

Denoising of diffusion MRI using random matrix theory

Jelle Veraart et al. Neuroimage. .

Abstract

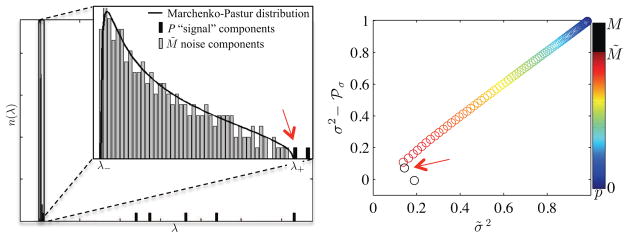
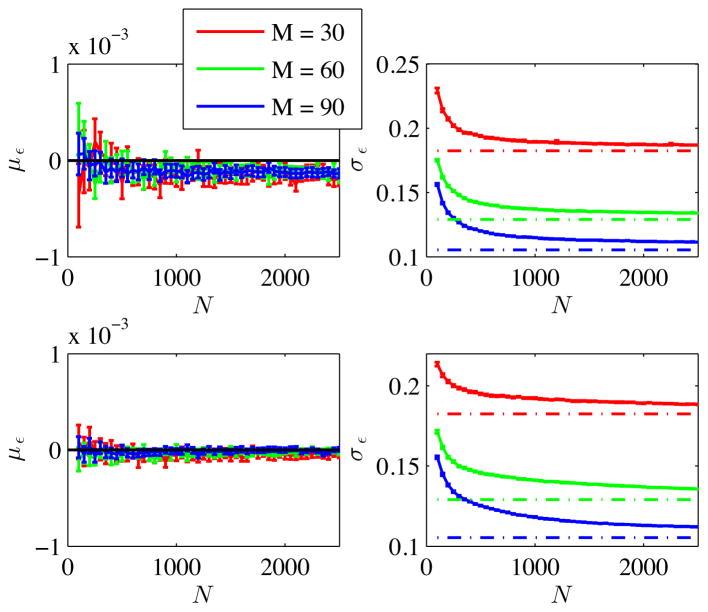
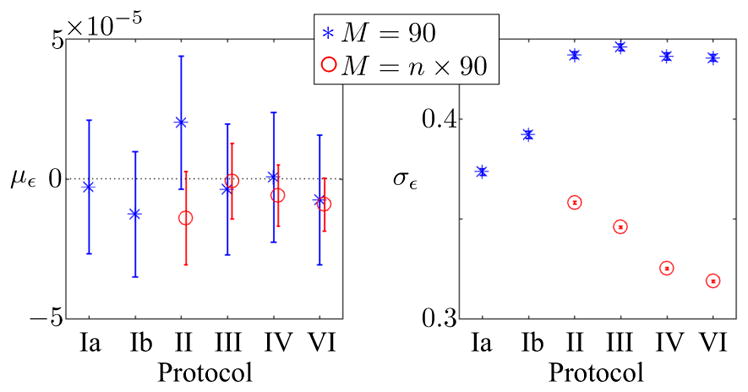
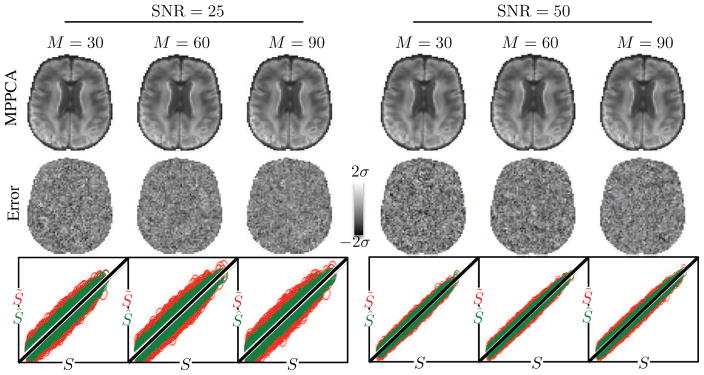
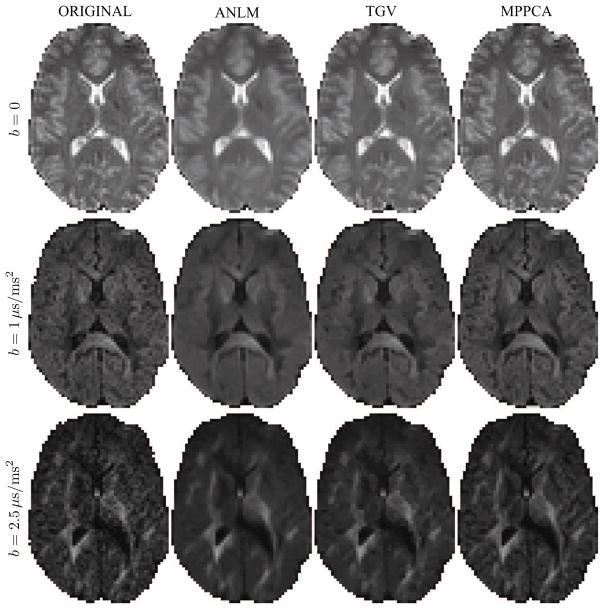
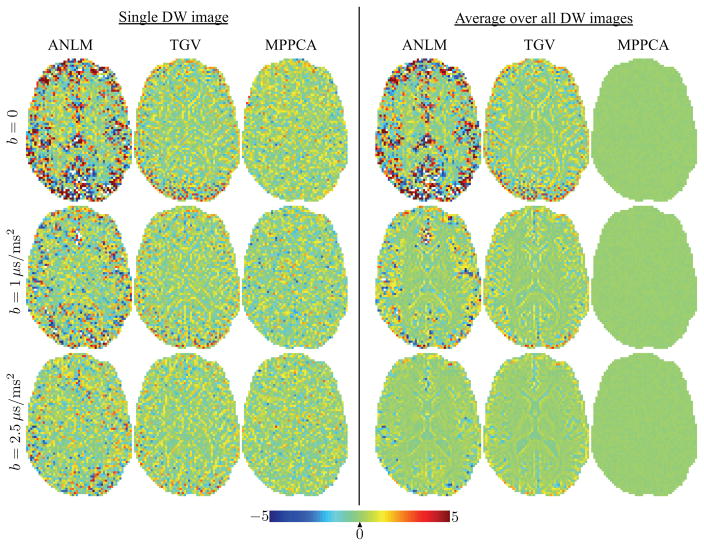
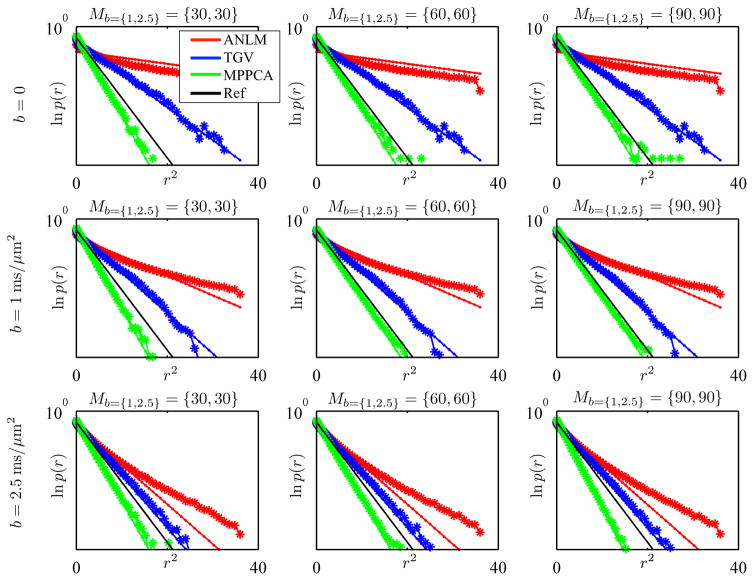
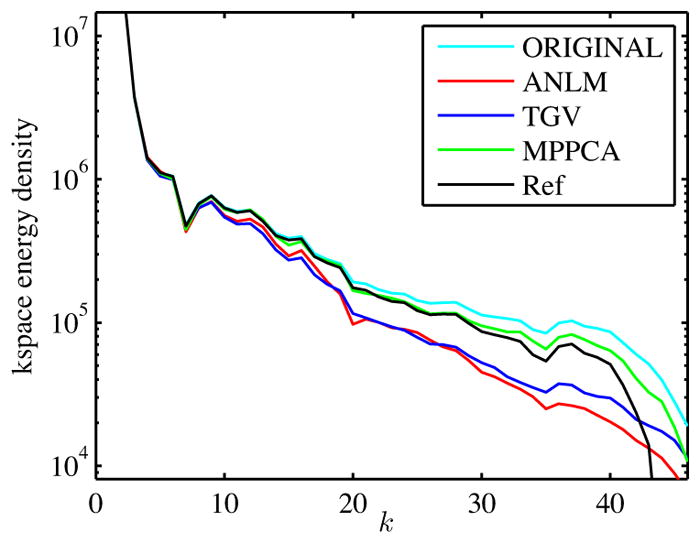
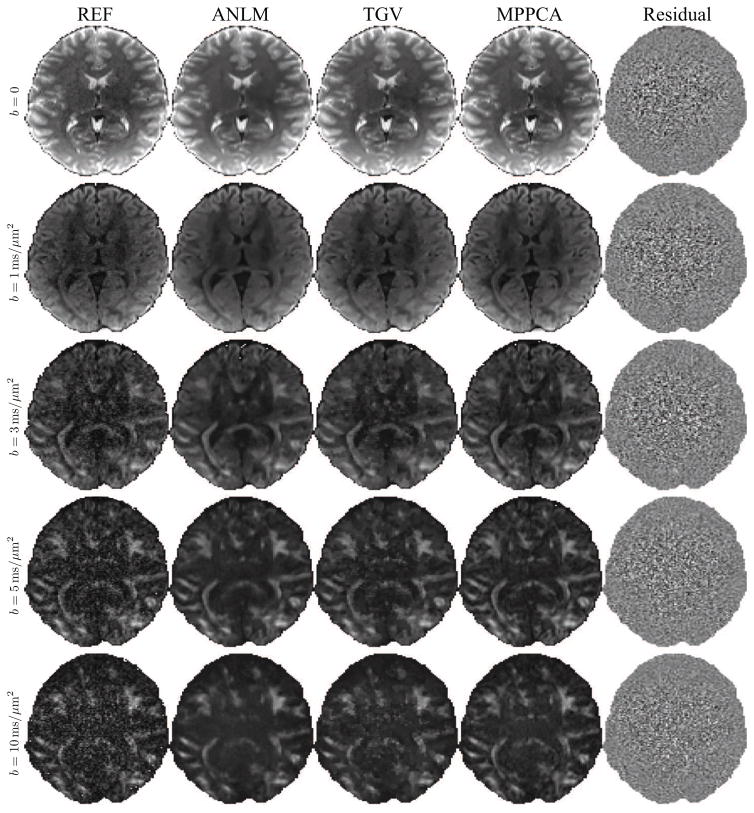
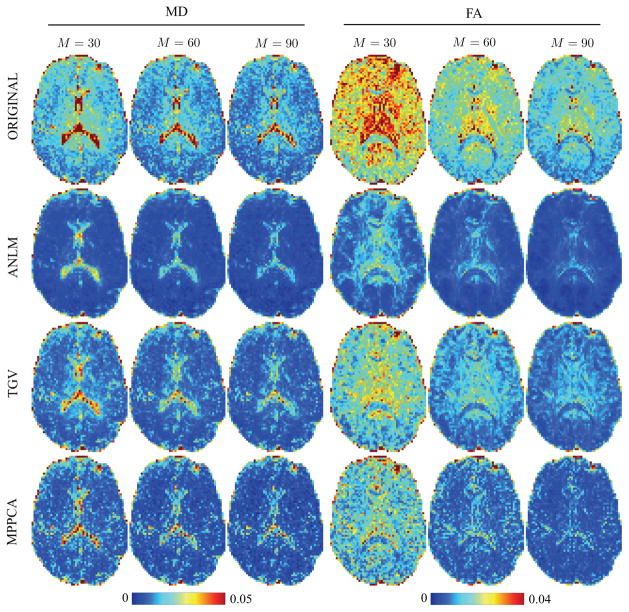
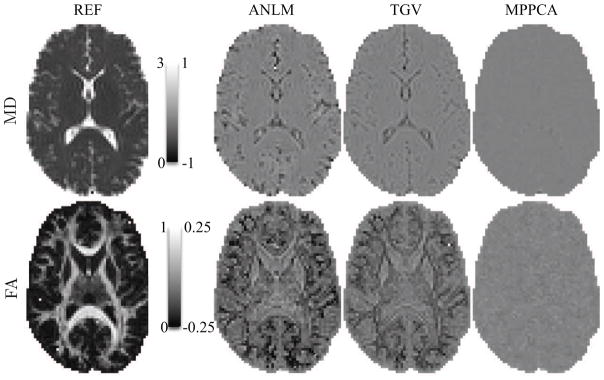
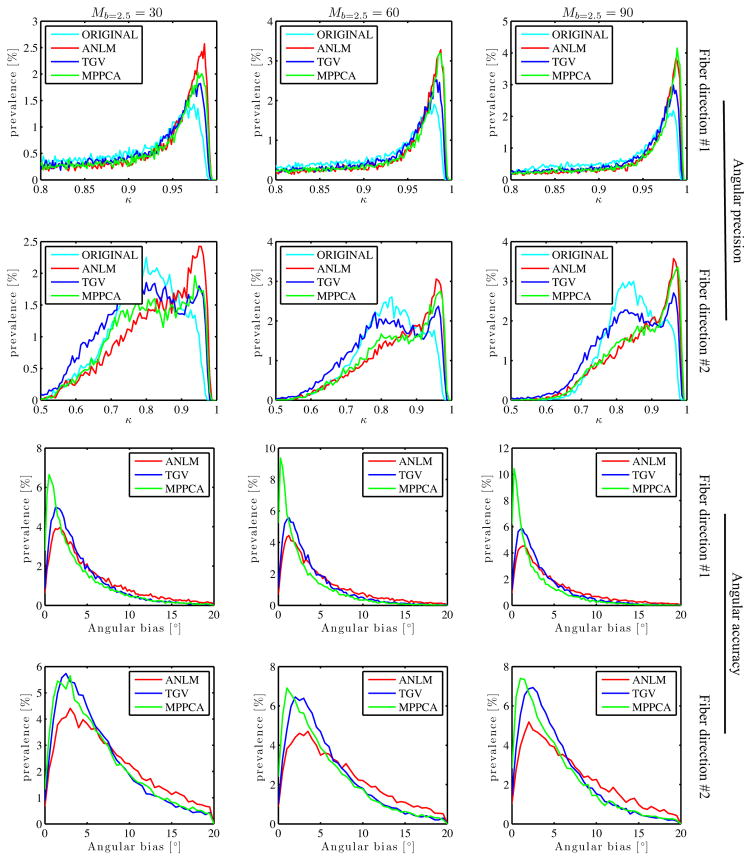
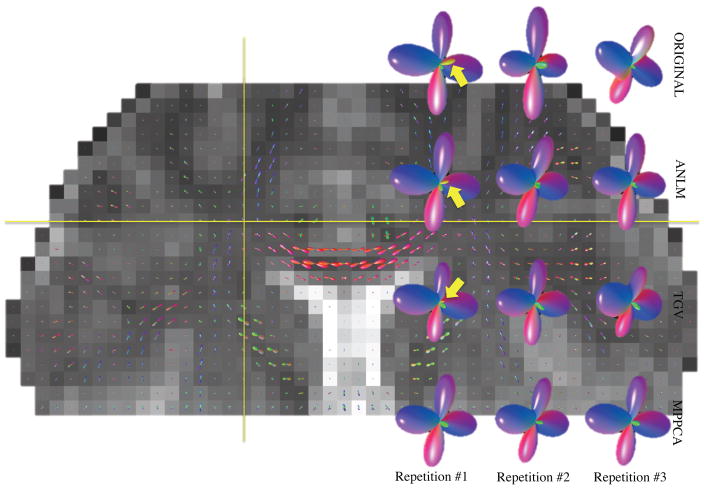
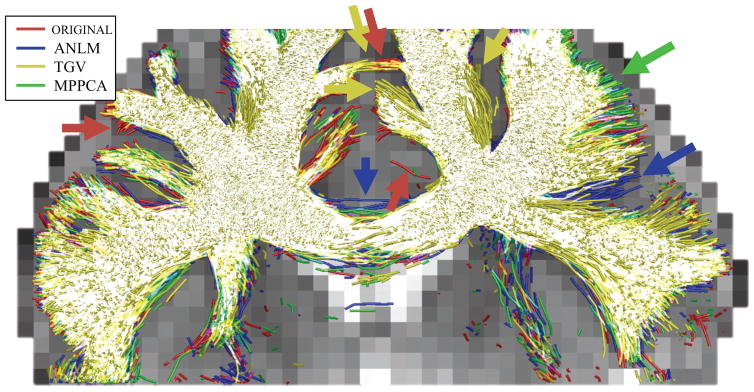
We introduce and evaluate a post-processing technique for fast denoising of diffusion-weighted MR images. By exploiting the intrinsic redundancy in diffusion MRI using universal properties of the eigenspectrum of random covariance matrices, we remove noise-only principal components, thereby enabling signal-to-noise ratio enhancements. This yields parameter maps of improved quality for visual, quantitative, and statistical interpretation. By studying statistics of residuals, we demonstrate that the technique suppresses local signal fluctuations that solely originate from thermal noise rather than from other sources such as anatomical detail. Furthermore, we achieve improved precision in the estimation of diffusion parameters and fiber orientations in the human brain without compromising the accuracy and spatial resolution.

Keywords: Accuracy; Marchenko-Pastur distribution; PCA; Precision.


Figures

Figure 1
Figure 1
(left) The upper edge λ+ of the Marchenko-Pastur distribution, a universal signature of noise in sample covariance matrices, distinguishes between noise- and significant signal-carrying principal components. (right) Validitiy of Eq. [8] as function of p nullified eigenvalues (color encoding). if p > M̃, suppressed signal leaks into the residuals and, as such, the variability of the residual map, σ̃2, start to deviate from σ2 − ℘σ with σ2 being the noise variance and ℘σ the noise variance accumulated in the p omitted eignvalues. Simulated data (cf. Data) with M = 90 and N = 250 was used to generate the graphs.
Figure 2
Figure 2
The bias [%] in the estimation of the noise-free signal is shown as function of N for different values for M and SNR (top row: SNR=25, bottom row: SNR=50). After Rician correction, the maximal error reduced to ~ 0.01%. The remaining noise standard deviation, normalized by σP^, converges to 1/M (dashed line).
Figure 3
Figure 3
The 95% confidence intervals of the mean error (με, [%]) in the estimation of the noise-free signal for the different diffusion encoding schemes show that MPPCA lacks a significant bias in single- and n-shell protocols. The remaining noise standard deviation, normalized by σ, is significantly higher for the multi-shell protocols if M is kept constant (blue). This observation indicates that more principal components are needed to approximate the diffusion weighted signal as function of the b-value in a linear basis if M is spread across a few shells and, as such, P increases. Nonetheless, MPPCA boosts SNR without compromising the accuracy for all evaluated protocols. Moreover, analyzing multiple shells (M = n × 90; red) simultaneously when the number of directions per shell is fixed improves the performance of MPPCA because the increase in M is generally larger than the associated increase in P.
Figure 4
Figure 4
(top row) A randomly chosen DW image after denoising the simulated whole brain data with M=30, 60, and 90 using MPPCA for SNR=25 and 50. (middle row) The corresponding error maps, computed as the difference between the denoised images, corrected for Rician noise bias, and the noise-free ground truth data, do not show anatomical features. (bottom row) Scatter plots show the noise-free simulated data (S ) against the corresponding noisy data points ( ; red) and against the corresponding denoised and Rician corrected data points ( ; green)
Figure 5
Figure 5
Denoised diffusion-weighted images for different b-values. Although the noise reduction is clearly visible in all denoising techniques, ANLM and TGV introduce image blur and/or reconstruction artifacts.
Figure 6
Figure 6
(left panel) The σ-normalized residual maps between the denoised diffusion-weighted images from Fig. 5 and the original data. (right panel) The presence of anatomical structure in ANLM and TGV anatomical maps indicates interference of the denoising algorithm with the “signal”. The effect becomes more visible after averaging the residual maps of the Mb>0 = 60 images per b value.
Figure 7
Figure 7
The logarithm of the distribution of normalized residuals p(r) as a function of r2 for different b-values, Mb>0, and methods as observed (*) and best fitting normal distribution (solid line). The standard normal distribution is shown for reference (black line). ANLM and TGV clearly over-do the denoising (i.e. standard deviation >1) by interfering with the underlying signal.
Figure 8
Figure 8
k-space energy density as function of the distance to the k-space center. ANLM and TGV have a low-pass filtering effect resulting in spatial resolution loss. MPPCA overshoots the predicted k-space density (black), i.e. Ref = Original - NΩ;σ2. This observation indicated incomplete noise suppression.
Figure 9
Figure 9
Denoised single DW images for different methods and b-values and the corresponding residuals maps for MPPCA.
Figure 10
Figure 10
Effect of denoising on the variability in the estimated MD [μm2/ms] and FA as function of the denoising method and the number of measurements M
Figure 11
Figure 11
Effect of denoising on the bias in the estimation of MD [μm2/ms] and FA. MD and FA maps, derived from a concatenation of the 3 repetitions of all DW data up to b = 1msm2, are shown for reference.
Figure 12
Figure 12
The effect of denoising on the angular precision, probed by a coherence metric κ, and the angular accuracy of the primary and secondary diffusion directions are shown as function of the number of measurements M and the denoising technique.
Figure 13
Figure 13
Effect of denoising on the fiber ODF for a voxel with a three-fiber crossing (crosshair). Studying the three repetitions of the Mb=2.5 = 60 data subsets separately shows that MPPCA consistently improves the estimation of the third peak. Other methods show low coherence of the third direction and often a spurious fourth peak.
Figure 14
Figure 14
Overlay of all tractograms derived from a single repetition of the Mb=2.5 = 60 data subset before and after denoising with the different techniques. Tractography was seeded in the corpus callosum. The cores of the major fiber bundles overlap well (white color). However, changing noise characteristics and possibly signal suppression introduced by ANLM and TGV have very different local and global effects on the tractogram that are often indistinguishable from anatomy (arrows) because of their plausible appearance.

References

    1. Ahmed A, Hu YF, Noras JM. Noise variance estimation for spectrum sensing in cognitive radio networks. AASRI Procedia. 2014;9:37–43.
    1. Aja-Fernández S, Tristán-Vega A, Hoge WS. Statistical noise analysis in GRAPPA using a parametrized noncentral Chi approximation model. Magnetic Resonance in Medicine. 2011;65(4):1195–1206. - PMC - PubMed
    1. Basser PJ, Mattiello J, LeBihan D. MR diffusion tensor spectroscopy and imaging. Biophysical journal. 1994;66(1):259–267. - PMC - PubMed
    1. Basser PJ, Pajevic S. Statistical artifacts in diffusion tensor MRI (DT-MRI) caused by background noise. Magnetic Resonance in Medicine. 2000;44(1):41–50. - PubMed
    1. Blackledge MD, Leach MO, Collins DJ, Koh DM. Computed diffusion-weighted mr imaging may improve tumor detection. Radiology. 2011;261(2):573–581. - PubMed

MeSH terms