. 2016 Aug 25;166(5):1215-1230.e20.
doi: 10.1016/j.cell.2016.07.019. Epub 2016 Aug 11.

The Deubiquitinase OTULIN Is an Essential Negative Regulator of Inflammation and Autoimmunity

Affiliations

The Deubiquitinase OTULIN Is an Essential Negative Regulator of Inflammation and Autoimmunity

Rune Busk Damgaard et al. Cell. .

Abstract

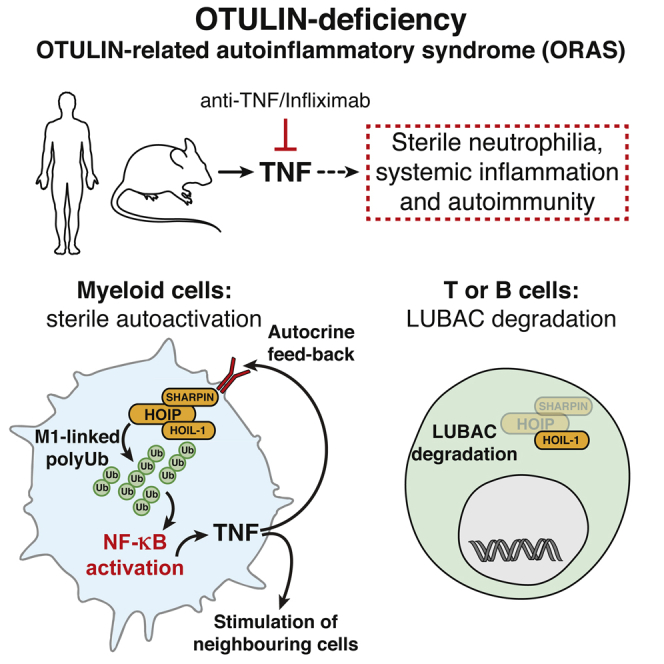
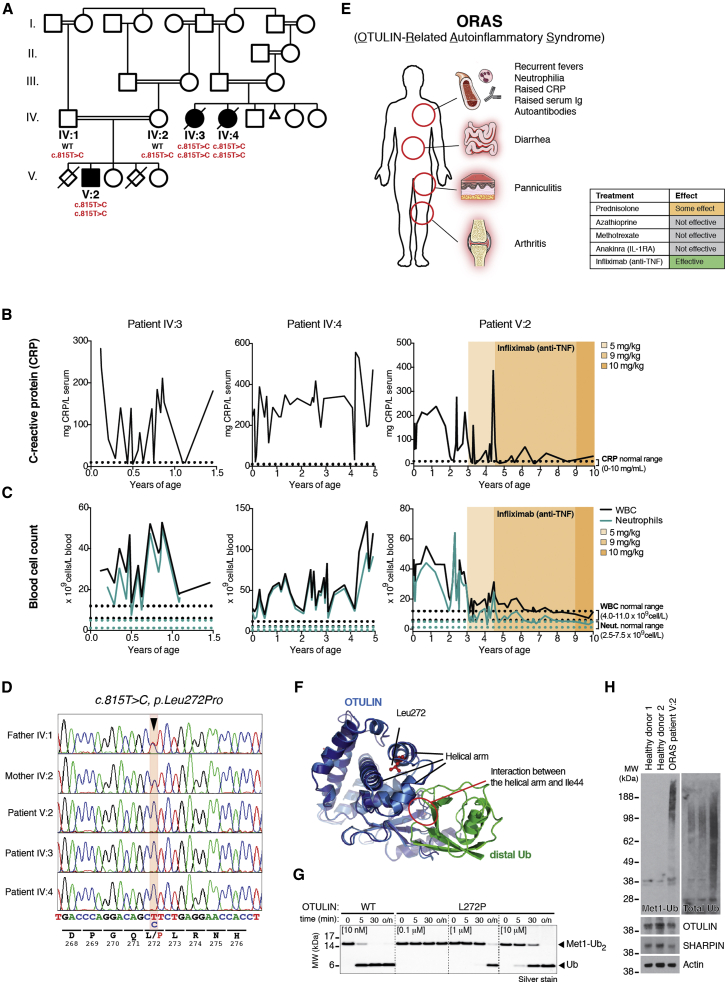
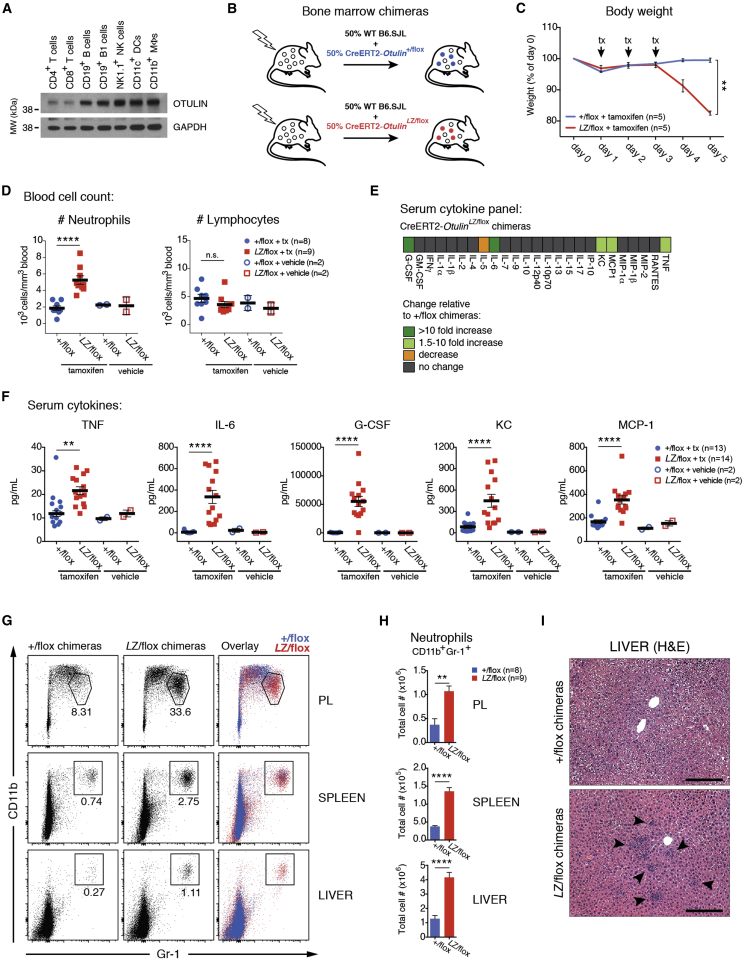
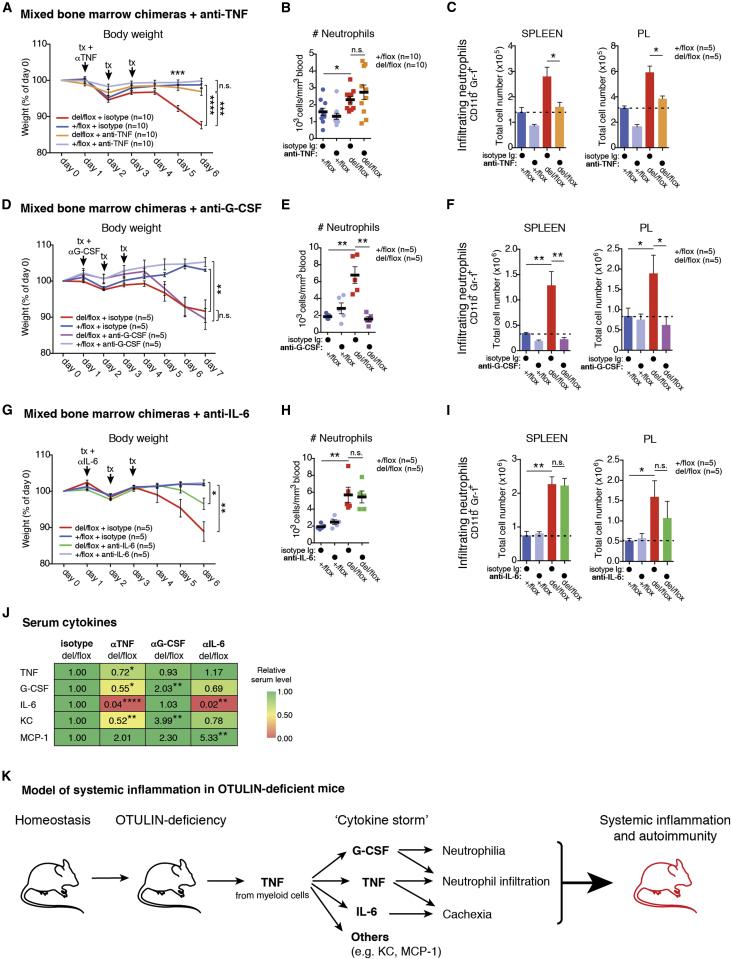
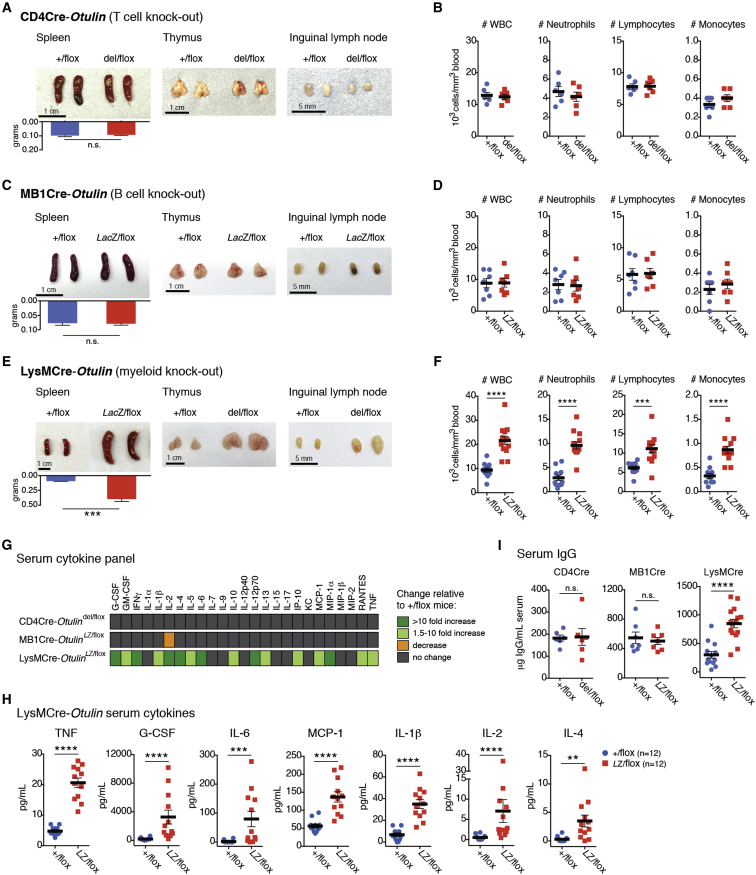
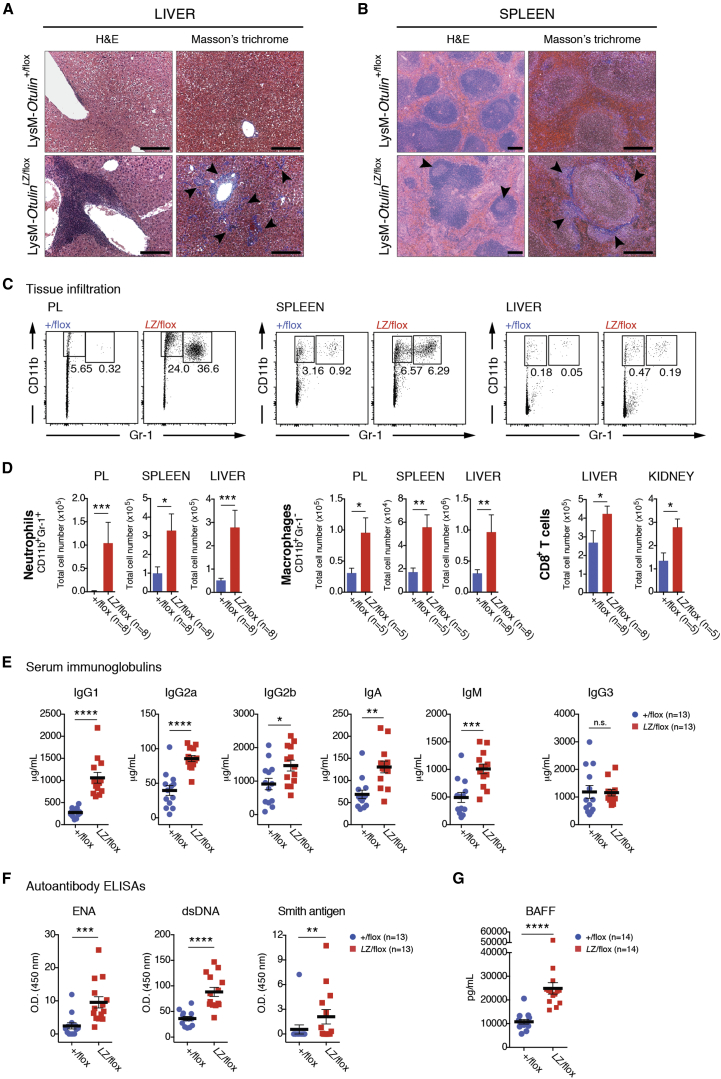
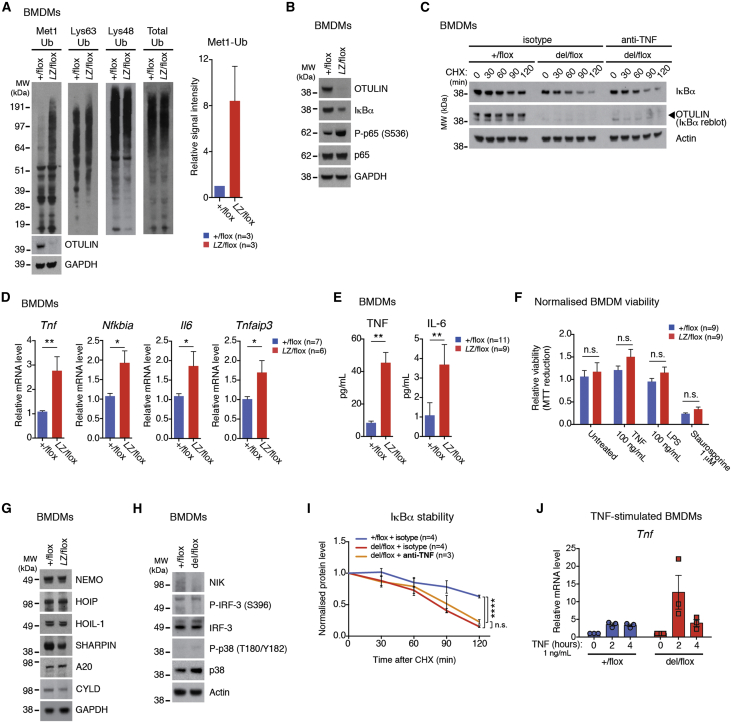
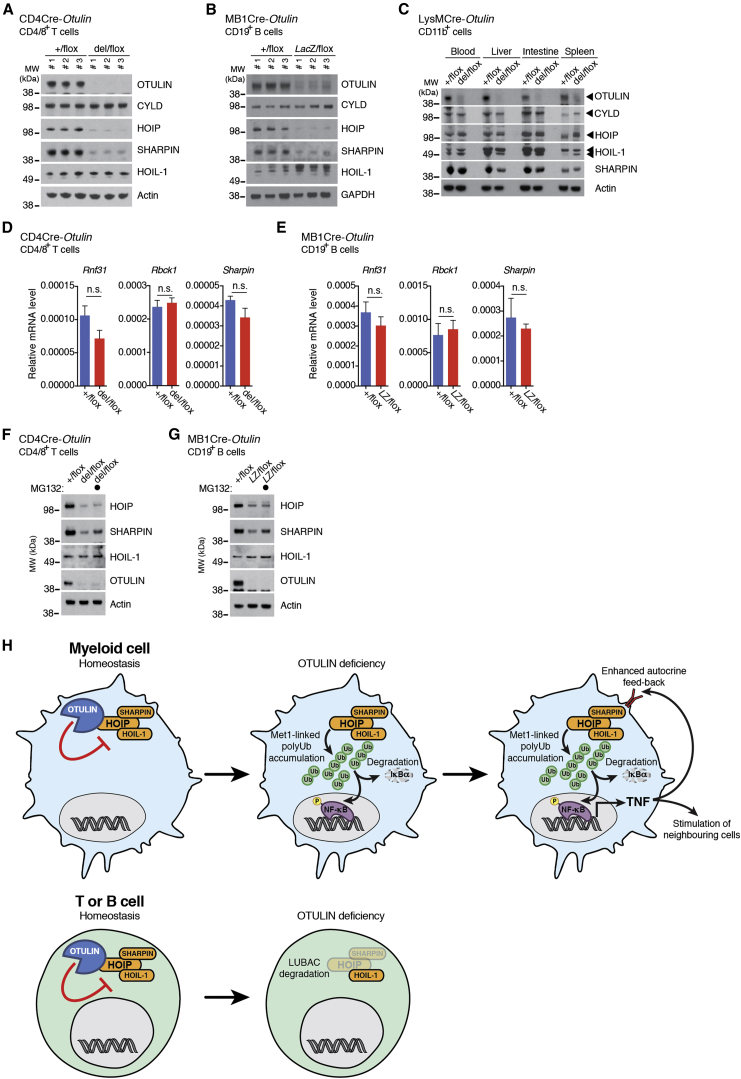
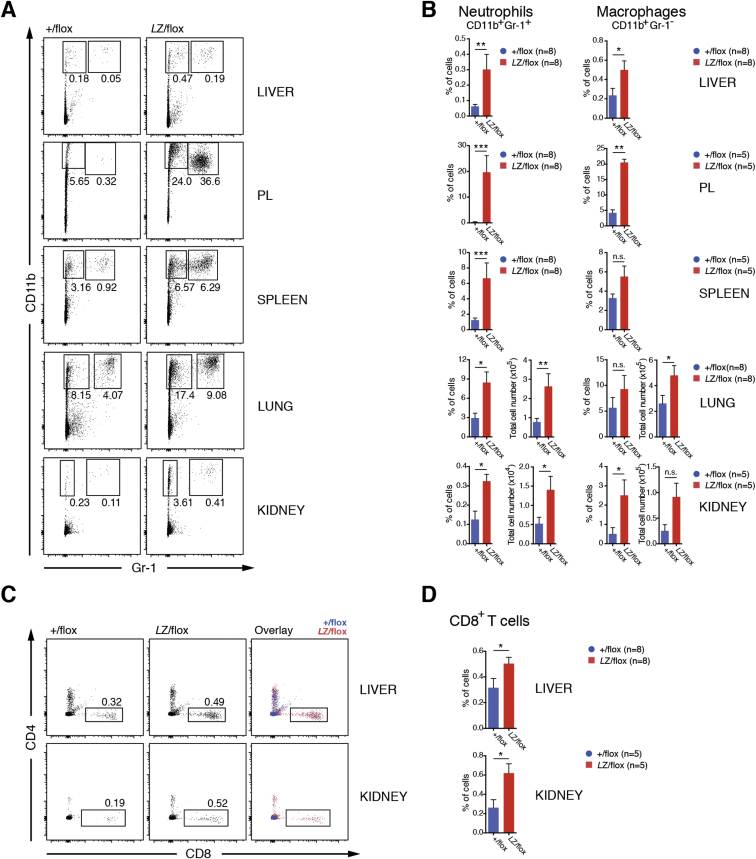
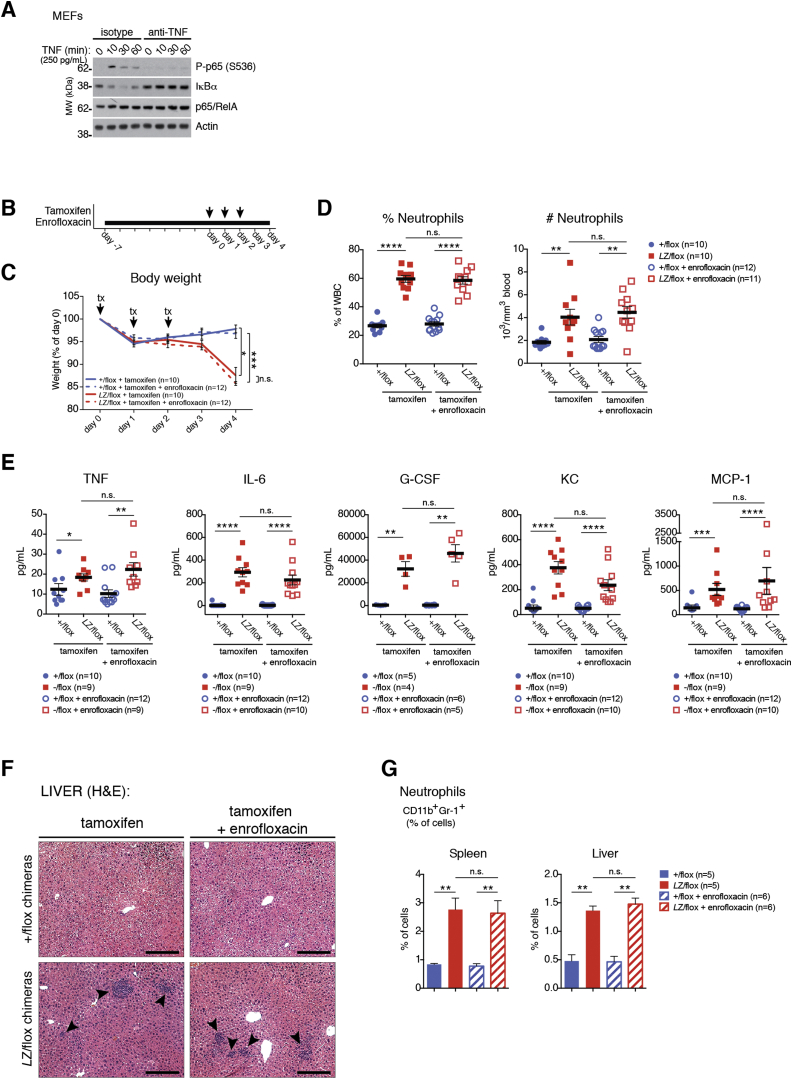
Methionine-1 (M1)-linked ubiquitin chains regulate the activity of NF-κB, immune homeostasis, and responses to infection. The importance of negative regulators of M1-linked chains in vivo remains poorly understood. Here, we show that the M1-specific deubiquitinase OTULIN is essential for preventing TNF-associated systemic inflammation in humans and mice. A homozygous hypomorphic mutation in human OTULIN causes a potentially fatal autoinflammatory condition termed OTULIN-related autoinflammatory syndrome (ORAS). Four independent OTULIN mouse models reveal that OTULIN deficiency in immune cells results in cell-type-specific effects, ranging from over-production of inflammatory cytokines and autoimmunity due to accumulation of M1-linked polyubiquitin and spontaneous NF-κB activation in myeloid cells to downregulation of M1-polyubiquitin signaling by degradation of LUBAC in B and T cells. Remarkably, treatment with anti-TNF neutralizing antibodies ameliorates inflammation in ORAS patients and rescues mouse phenotypes. Hence, OTULIN is critical for restraining life-threatening spontaneous inflammation and maintaining immune homeostasis.


Figures

None
Graphical abstract
Figure 1
Figure 1
Mutations in OTULIN in Patients with a Systemic Autoinflammatory Syndrome (A) Segregation of the inflammatory symptoms (filled symbols) and the c.815T>C substitution in OTULIN in the affected kindred. ○, females; □, males; double lines, consanguineous relationship; crossed symbols, deceased individuals; Δ, miscarriage; ◊, stillbirths. Roman numerals indicate generations. (B and C) Lifetime measurements of (B) C-reactive protein (CRP) serum concentrations and (C) white blood cell (WBC, black line) and neutrophil numbers (cyan line) in blood from patients IV:3, IV:4, and V:2. Reference ranges (dotted lines) are indicated on the graphs. Patient V:2 was treated with Infliximab as indicated (orange shade). (D) OTULIN DNA sequence chromatograms identifying the homozygous single-base substitution (c.815 T>C, p.Leu272Pro, arrowhead). (E) Schematic of the cardinal symptoms of OTULIN-related autoinflammatory syndrome (ORAS). The efficacy of trialed treatments are indicated in the table. (F) Superimposed structures of OTULIN’s catalytic domain (blue) without substrate and bound to Met1 diUb (green [only distal Ub shown]; PDB: 3znv and PDB: 3znz [Keusekotten et al., 2013]), showing the position of Leu272 in the distal Ub binding site. (G) Met1-linked diUb hydrolysis by OTULINWT and OTULINL272P. (H) Immunoblot showing the levels of Met1-linked polyUb, total Ub, OTULIN, and LUBAC in buffy coat cells from patient V:2. See also Figure S1 and Document S1. Tables S1 and S3–S8, Table S2. Rare Homozygous Variants in ORAS Patients, Related to Figure 1.
Figure 2
Figure 2
Deletion of Otulin in Immune Cells Causes Acute Systemic Inflammation in Mice (A) OTULIN immunoblot on immune cells from wild-type mice. NK cell, natural killer cell; DC, dendritic cell; MΦ, macrophage. (B) Schematic representation of mixed bone marrow chimera generation. Wild-type (WT) B6.SJL cells are CD45.1+, and CreERT2-Otulinflox cells are CD45.2+. (C) Body weight following i.p. administration of tamoxifen (tx; arrows) to CreERT2-Otulinflox chimeric mice. (D) Neutrophil and lymphocyte counts from blood of CreERT2-Otulinflox chimeras and vehicle-treated controls at day 5 following tamoxifen administration. (E and F) Luminex multiplex analysis of serum cytokines and chemokines from terminal bleeds on day 5 presented as (E) a heatmap of relative changes in concentration of all analytes between CreERT2-Otulin+/flox and CreERT2-OtulinLacZ/flox chimeras and (F) serum concentrations of cytokines and chemokines increased in CreERT2-OtulinLacZ/flox chimeras. Data were pooled from two independent experiments. (G and H) Flow cytometry analysis of CD11b+Gr-1+ neutrophils in total cellular infiltrate (CD45.1+ and CD45.2+) in peritoneal lavage (PL), spleen, and liver from CreERT2-Otulinflox chimeras presented as (G) representative dot plots with percentage of cells in gate indicated and (H) total cell number. (I) Micrographs of hematoxylin and eosin (H&E) stained sections reveal inflammatory foci (arrowheads) in liver parenchyma. Micrographs are representative of 13 CreERT2-Otulin+/flox and 14 CreERT2-OtulinLacZ/flox chimeras from two independent experiments. Scale bars, 200 μm. (C, D, F, and H) Data are presented as mean ± SEM, and n represents number of mice. See also Figure S2 and Table S4.
Figure 3
Figure 3
Neutralization of TNF Ameliorates Inflammation Caused by OTULIN Deficiency (A–J) Measurements from tamoxifen (tx)-treated (arrows) CreERT2-Otulinflox bone marrow chimeras injected with (A–C) anti-TNF neutralizing antibodies (αTNF) (data were pooled from two independent experiments), (D–F) anti-G-CSF-neutralizing antibodies (αG-CSF), (G–I) anti-IL-6-neutralizing antibodies (αIL-6), or isotype control as indicated. (A, D, and G) Body weight of CreERT2-Otulinflox chimeric mice treated with neutralizing antibodies as indicated. (B, E, and H) Blood neutrophil counts from CreERT2-Otulinflox chimeric mice treated as indicated. (C, F, and I) Total number of infiltrating CD11b+Gr-1+ neutrophils in spleen and peritoneal lavage (PL) measured by flow cytometry from CreERT2-Otulinflox chimeric mice treated as indicated. (J) Heatmap of Luminex multiplex analysis of cytokines and chemokines in serum from terminal bleeds on days 6 or 7 from chimeric mice treated as indicated. Numbers indicate relative change compared to isotype-treated del/flox mice within each experiment. G-CSF levels for αG-CSF and αIL-6 were measured by ELISA. Asterisks () indicate the level of statistical significance. (K) Model of TNF-driven systemic inflammation and the contributions from different cytokines in OTULIN-deficient mice. (A–J) Data are presented as mean ± SEM, and n represents number of mice. See also Figure S3.
Figure 4
Figure 4
Specific Deletion of Otulin in Myeloid Cells, but Not T or B Cells, Causes Systemic Inflammation (A, C, and E) Spleens and spleen weights, thymuses, and inguinal lymph nodes from (A) 2- to 3-months-old CD4Cre-Otulinflox mice (n = 6), (C) 3- to 4-months-old MB1Cre-Otulinflox mice (n = 4), (E) 3- to 9-months-old LysMCre-Otulinflox mice (n = 8). (B, D, and F) Blood cell counts from (B) 2- to 3-months-old CD4Cre-Otulinflox mice (n = 6); (D) 3- to 4-months-old MB1Cre-Otulinflox mice (n = 7); and (F) 3- to 9-months-old LysMCre-Otulinflox mice (n = 11). (G and H) Luminex multiplex analysis of serum cytokine and chemokine concentrations from terminal bleeds of 2- to 3-months-old CD4Cre-Otulinflox mice, 3- to 4-months-old MB1Cre-Otulinflox mice, and 4- to 9-months-old LysMCre-Otulinflox mice presented as (G) a heatmap of relative changes of analytes between OTULIN-deficient mice and their respective +/flox controls and (H) serum concentrations of selected cytokines and chemokines increased in LysMCre-OtulinLacZ/flox mice. (I) ELISA measurements of total IgG concentrations in serum from CD4Cre-Otulinflox (n = 6), MB1Cre-Otulinflox (n = 7), and LysMCre-Otulinflox (n = 14) mice. Data are presented as mean ± SEM, and n represents number of mice. See also Figure S4 and Tables S5–S7.
Figure 5
Figure 5
OTULIN Deficiency in Myeloid Cells Leads to Neutrophil Infiltration, Multi-organ Inflammation, Hyper-Immunoglobulinemia, and Autoimmunity (A and B) Micrographs of H&E and Masson’s trichome stained sections of livers and spleens from 4- to 9-months-old LysMCre-Otulinflox mice reveal (A) infiltration in and fibrosis (right, arrowheads) of liver parenchyma and (B) distorted spleen architecture with germinal center activation (left, arrowheads) and fibrosis (right, arrowheads) in LysMCre-OtulinLacZ/flox mice. Scale bars, 200 μm. Micrographs are representative of five mice of each genotype from two independent experiments. (C and D) Flow cytometry analysis of total cellular infiltrate (CD45.1+ and CD45.2+) in peritoneal lavage (PL), spleen, liver, and kidney of LysMCre-Otulinflox mice presented as (C) representative dot plots of neutrophils with percent of cells in gate indicated and (D) total cell number of neutrophils, macrophages, and CD8+ T cells. (E) Concentrations of immunoglobulins in serum from 4- to 9-months-old LysMCre-Otulinflox mice. (F) ELISA analysis of serum autoantibody reactivity to ENA, dsDNA, and Smith antigen from 3- to 9-months-old LysMCre-Otulinflox mice. (G) ELISA analysis of serum B cell activating factor (BAFF) concentration from 3- to 9-months-old LysMCre-Otulinflox mice. (E–G) Data are mean of two technical replicas. (D–F) Data are presented as mean ± SEM, and n represents number of mice. See also Figure S5.
Figure 6
Figure 6
OTULIN Deficiency Leads to Autoactivation of Macrophages (A) Immunoblots of different polyUb chains in whole-cell lysate from untreated (i.e., no exogenous stimulation after differentiation) LysMCre-Otulinflox BMDMs. (Right) Densitometry analysis of the Met1-Ub signal from above the 51 kDa marker in immunoblot experiments. (B) Immunoblots of NF-κB signaling proteins from untreated LysMCre-Otulinflox BMDMs. (C) Immunoblot analysis of IκBα stability in LysMCre-Otulinflox BMDMs treated with anti-TNF neutralizing antibodies or isotype control and cycloheximide (CHX) as indicated. (D) Relative mRNA levels of Tnf, Nfkbia, Il6, and Tnfaip3 from untreated LysMCre-Otulinflox BMDMs measured by quantitative RT-PCR. Each data point is mean of two technical replicas. Statistical significance was determined using two-tailed Student’s t test. (E) Luminex analysis of TNF and IL-6 from cell culture supernatants of untreated LysMCre-Otulinflox BMDMs. Cells were split, washed in PBS, and reseeded in fresh cell culture medium 24 hr prior to analysis. Results were pooled from two independent experiments. (F) Viability of LysMCre-Otulinflox BMDMs 10 hr after treatment. Each experiment was performed as biological duplicates. Results were normalized to LysMCre-Otulin+/flox. (G and H) Immunoblots of signaling proteins from untreated LysMCre-Otulinflox BMDMs. (I) Densitometry analysis of IκBα stability from experiments performed as in (C). (J) Relative mRNA levels of Tnf measured by quantitative RT-PCR in LysMCre-Otulinflox BMDMs treated with 1 ng/mL TNF as indicated (n = 3). Data are presented as mean ± SEM, and n represents number of biological replicas. See also Figure S6.
Figure 7
Figure 7
OTULIN Deficiency in T and B Cells Leads to Repression of the Linear Ubiquitin Chain Assembly Complex (A–C) Immunoblot of OTULIN, CYLD, and linear ubiquitin chain assembly (LUBAC) components in (A) splenic CD4+ and CD8+ T cells from CD4Cre-Otulinflox mice, (B) splenic CD19+ B cells from MB1Cre-Otulinflox mice, and (C) CD11b+ myeloid cells from multiple tissues from LysMCre-Otulinflox mice. (D and E) Relative mRNA expression of LUBAC components from (D) splenic CD4+ and CD8+ T cells from CD4Cre-Otulinflox mice (n = 3) and (E) splenic CD19+ B cells from MB1Cre-Otulinflox mice (n = 3). Data are presented as mean ± SEM, and n represents number of biological replicas. (F and G) Immunoblot of LUBAC components in (F) splenic CD4+ and CD8+ T cells from CD4Cre-Otulinflox mice and (G) splenic CD19+ B cells from MB1Cre-Otulinflox mice treated with 10 μM MG132 proteasomal inhibitor for 6 hr as indicated. (H) Schematic showing a model of the cellular effect of OTULIN deficiency in myeloid cells and T and B cells.
Figure S1
Figure S1
Genetic Linkage Analysis of Affected Patients and Biochemical and Biophysical Analysis of OTULINL272P, Related to Figure 1 (A) Candidate regions of linkage following genome-wide linkage scan using Affymetrix 250K SNP arrays in three affected patients. HomozygosityMapper output shows common regions of genome-wide homozygosity in the three patients. The graph shows the genome-wide homozygosity scores produced by HomozygosityMapper plotted as bar chart with red bars indicating the most promising genomic linkage regions (red). (B) Circular dichroism spectroscopy in the ultraviolet wavelength region of OTULINWT and OTULINL272P. This spectrum is representative of two independent experiments carried out at a protein concentration of 0.38 mg/mL. (C) Tryptophan fluorescence upon thermal unfolding measured by nanoDSF. Destabilization of OTULINWT and OTULINL272P dependent on temperature shows that both proteins are stable at 37°C. Apparent melting temperatures (Tm) were determined as 56.7°C and 53°C, respectively (dashed lines). Data are representative of two independent experiments. (D) Immunoblot of endogenous HOIP co-precipitating with C-terminally GFP-tagged OTULINWT or OTULINL272P ectopically expressed in HEK293 cells. Data are representative of two independent experiments. (E) Met1-linked tetraUb hydrolysis by OTULINWT and OTULINL272P were assayed with 1 μM tetraUb over time with the indicated OTULIN concentrations and visualized on silver-stained 4%–12% gradient SDS-PAGE gels. (F) Affinity measurements by fluorescence anisotropy with FlAsH (Fluorescein Arsenical Helix-binder)-labeled Met1 diUb and catalytically inactive OTULINC129A or OTULINC129A/L272P. Data are means ± SD of one experiment performed in triplicate. Results are representative of three independent experiments. FP, fluorescence polarization. Values were fitted to a one-site total binding model to derive binding constants (KD), which could not be calculated for OTULINC129A/L272P. (G) Hydrolysis of diUb of all possible linkages by OTULINL272P in a time course with the indicated OTULINL272P concentration and visualized on silver-stained 4%–12% gradient SDS-PAGE gels. o/n, overnight treatment.
Figure S2
Figure S2
Generation of OTULIN-Targeted Mice, OTULIN Expression, Genotyping, and Reconstitution of Bone Marrow Chimeric Mice, Related to Figure 2 (A) Schematic showing the strategy to generate conditional and cell-type-specific knockouts of Otulin. SA, splice acceptor; neo, neomycin-resistance cassette; pA, polyA signal; PGK, murine PGK-1 promoter; DTA, diphtheria toxin A selection cassette; KanR, Kanamycin-resistance cassette. (B) Genotyping of mouse strains. PCR reactions showing the expected products from each genotype. (C) E13.5 embryos stained with X-gal for β-galactosidase activity and cleared by methyl salicylate shows Otulin promoter activity in multiple tissues. Pictures are representative of five embryos of each genotype from two independent experiments. (D) Immunoblot analysis showing OTULIN expression in multiple tissues from adult wild-type C57BL/6 mice. Blots are representative of three independent experiments. (E) Ratio of CD45.1+ (wild-type B6.SJL) and CD45.2+ (CreERT2-Otulin+/flox or CreERT2-OtulinLacZ/flox C57BL/6) expressing splenocytes determined by flow cytometry at the termination of chimera experiments. Data were pooled from two independent experiments. (F) Genotyping of bone marrow cells or blood leukocytes from CreERT2-Otulinflox chimeras treated with tamoxifen or vehicle shows complete or near-complete conversion of flox alleles to del alleles upon tamoxifen treatment. Note that WT(+) products are present in all reactions as BJ6.SJL WT cells are present in all samples from the chimeras. (G) Body weight following i.p. administration of tamoxifen (tx) or vehicle (vehi) to CreERT2-Otulinflox chimeric mice. Data were pooled from two independent experiments. (H) Blood cell counts from CreERT2-Otulinflox chimeras and vehicle-treated controls at day 5. (I-J) Flow cytometry analysis of CD11b+Gr-1+ neutrophils in total cellular infiltrate (CD45.1+ and CD45.2+) in lung and kidney presented as (I) representative dot plots with percentage of cells in gate indicated and (J) total cell number or percentage of cells in gate quantified. (K) Percentage of neutrophils in infiltrate from CreERT2-Otulinflox chimeras (related to Figure 2H). Data shown in (J) and (K) are repeated in (L). (L) Flow cytometry analysis of CD11b+Gr-1+ neutrophils in liver, lung, peritoneal lavage (PL), spleen, and kidney in tamoxifen- or vehicle-treated CreERT2-Otulinflox chimeras. (M) Ratio of CD45.1+ (wild-type B6.SJL) and CD45.2+ (CreERT2-Otulin+/flox or CreERT2-OtulinLacZ/flox C57BL/6) expressing CD11b+Gr-1+ neutrophils in each tissue determined by flow cytometry at the termination of chimera experiments. Data are presented as mean ± SEM, and n represents number of mice.
Figure S3
Figure S3
Emergency Granulopoiesis and Neutrophilia Is Controlled by G-CSF in OTULIN-Deficient Mice, Related to Figure 3 (A) Flow cytometry analysis of lineage negative (Lin-) c-Kit+Sca1+ LSK cells in bone marrow of tamoxifen-treated CreERT2-Otulinflox chimeric mice shows increased numbers of LSK cells in bone marrow consistent with emergency granulopoiesis. (B-C) Flow cytometry analysis of mature and immature neutrophils in (B) bone marrow and (C) blood of tamoxifen-treated CreERT2-Otulinflox chimeric mice shows increased numbers of these cells in both tissues, consistent with emergency granulopoiesis. (D-F) Quantification of flow cytometry analysis as in (A-C) of LSK cells (D) and mature and immature neutrophils in (E) bone marrow and (F) blood of tamoxifen-treated CreERT2-Otulinflox chimeric mice injected with anti-G-CSF neutralizing antibodies, anti-IL-6 neutralizing antibodies, or isotype control as indicated. (G-I) Serum concentrations of TNF, G-CSF, IL-6, KC, and MCP-1 from tamoxifen-treated CreERT2-Otulinflox chimeric mice injected with (G) anti-TNF neutralizing antibodies, (H) anti-G-CSF neutralizing antibodies, (I) anti-IL-6 neutralizing antibodies, or isotype control as indicated measured by Luminex multiplex analysis. These data are represented as a heat map in Figure 3J. Data are presented as mean ± SEM, and n represents number of mice.
Figure S4
Figure S4
Characterization of CD4Cre-Otulinflox, MB1Cre-Otulinflox, and LysMCre-Otulinflox mice, Related to Figure 4 (A) Tabulated results from flow cytometry analysis of cellular subsets from thymus, inguinal lymph node, and spleen from CD4Cre-Otulinflox mice. (B) Tabulated results from flow cytometry analysis of cellular subsets from bone marrow, peritoneal lavage (PL), spleen, liver, inguinal lymph node, and lung from MB1Cre-Otulinflox mice. (C) Results of flow cytometry analysis of peritoneal B cell subsets from MB1Cre-Otulinflox mice (n = 3). (D) Kaplan-Meier plot of survival in LysMCre-Otulin mice. Censored deaths are indicated as black ticks. (E) Body weight plotted against age in LysMCre-Otulinflox mice. Data are presented for either both genders (top panel) or stratified for gender (female (♀), middle panel; male (♂), bottom panel). Dashed lines show the linear regression of the data. (F) Liver weight to body weight ratio (left panel) and thymus weight (right panel) in LysMCre-Otulinflox mice. (C and F) Data are presented as mean ± SEM, and n represents number of mice.
Figure S5
Figure S5
Flow Cytometry Plots and Quantification of Cell Populations in Mice Lacking Otulin in Myeloid Cells, Related to Figure 5 (A-D) Flow cytometry analysis of (A-B) CD11b+Gr-1+ neutrophils and CD11b+Gr-1- macrophages, and (C-D) CD8+ T cells in liver, peritoneal lavage (PL), spleen, lung, and kidney from from 4-9 month old LysMCre-Otulinflox mice presented as (A and C) representative dot plots or (B and D) total cell number or frequency of infiltrating cells. Missing graphs of total number of infiltrating cells in (B) and (D) are shown in main Figure 5D. (A-D) Data were pooled from two independent experiments. Data are presented as mean ± SEM, and n represents number of mice.
Figure S6
Figure S6
Autoactivation of BMDMs and the Effect of Antibiotics on Systemic Inflammation in OTULIN-Deficient Bone Marrow Chimeric Mice, Related to Figure 6 (A) Immunoblot showing NF-κB activation in MEFs treated with 0.25 ng/mL TNF and anti-TNF neutralizing antibodies or isotype control as indicated. (B) Schematic of the experiment indicating timing of enrofloxacin and tamoxifen treatment. (C) Enrofloxacin treatment does not rescue weight loss, indicating sterile inflammation. Tamoxifen (tx) was administered i.p. (arrows) to CreERT2-Otulinflox chimeras treated with enrofloxacin or not. (D) Blood cell counts taken at day 4 from CreERT2-Otulinflox chimeras treated with enrofloxacin or not showing that enrofloxacin does not reduce neutrophilia in CreERT2-OtulinLacZ/flox chimeras, indicating sterile inflammation. (E) Luminex multiplex analysis of cytokine and chemokine concentrations in serum from terminal bleeds on day 4 of CreERT2-Otulinflox chimeras treated with enrofloxacin or not showing that enrofloxacin does not reduce secretion of inflammatory cytokines in CreERT2-OtulinLacZ/flox chimeras, indicating sterile inflammation. (B-E) Data were pooled from two independent experiments (except for G-CSF concentrations in E). (F) Micrographs of H&E stained sections of livers reveal inflammatory foci (arrowheads) in liver parenchyma showing that enrofloxacin does not reduce infiltration and inflammatory foci in CreERT2-OtulinLacZ/flox chimeras, indicating sterile inflammation. Micrographs are representative of 10 CreERT2-Otulin+/flox and 12 CreERT2-OtulinLacZ/flox chimeras from two independent experiments. Scale bars: 200 μm. (G) Frequency of infiltrating CD11b+Gr-1+ neutrophils. (C-E and G) Data are presented as mean ± SEM, and n represents number of mice.

References

    1. Boisson B., Laplantine E., Prando C., Giliani S., Israelsson E., Xu Z., Abhyankar A., Israël L., Trevejo-Nunez G., Bogunovic D. Immunodeficiency, autoinflammation and amylopectinosis in humans with inherited HOIL-1 and LUBAC deficiency. Nat. Immunol. 2012;13:1178–1186. - PMC - PubMed
    1. Boisson B., Laplantine E., Dobbs K., Cobat A., Tarantino N., Hazen M., Lidov H.G.W., Hopkins G., Du L., Belkadi A. Human HOIP and LUBAC deficiency underlies autoinflammation, immunodeficiency, amylopectinosis, and lymphangiectasia. J. Exp. Med. 2015;212:939–951. - PMC - PubMed
    1. Bonizzi G., Karin M. The two NF-kappaB activation pathways and their role in innate and adaptive immunity. Trends Immunol. 2004;25:280–288. - PubMed
    1. Clark G.R., Sciacovelli M., Gaude E., Walsh D.M., Kirby G., Simpson M.A., Trembath R.C., Berg J.N., Woodward E.R., Kinning E. Germline FH mutations presenting with pheochromocytoma. J. Clin. Endocrinol. Metab. 2014;99:E2046–E2050. - PubMed
    1. Clausen B.E., Burkhardt C., Reith W., Renkawitz R., Förster I. Conditional gene targeting in macrophages and granulocytes using LysMcre mice. Transgenic Res. 1999;8:265–277. - PubMed

Publication types

MeSH terms