. 2016 Sep 6;24(9):1509-22.
doi: 10.1016/j.str.2016.06.021. Epub 2016 Aug 11.

Change in the Molecular Dimension of a RAGE-Ligand Complex Triggers RAGE Signaling

Affiliations

Change in the Molecular Dimension of a RAGE-Ligand Complex Triggers RAGE Signaling

Jing Xue et al. Structure. .

Abstract

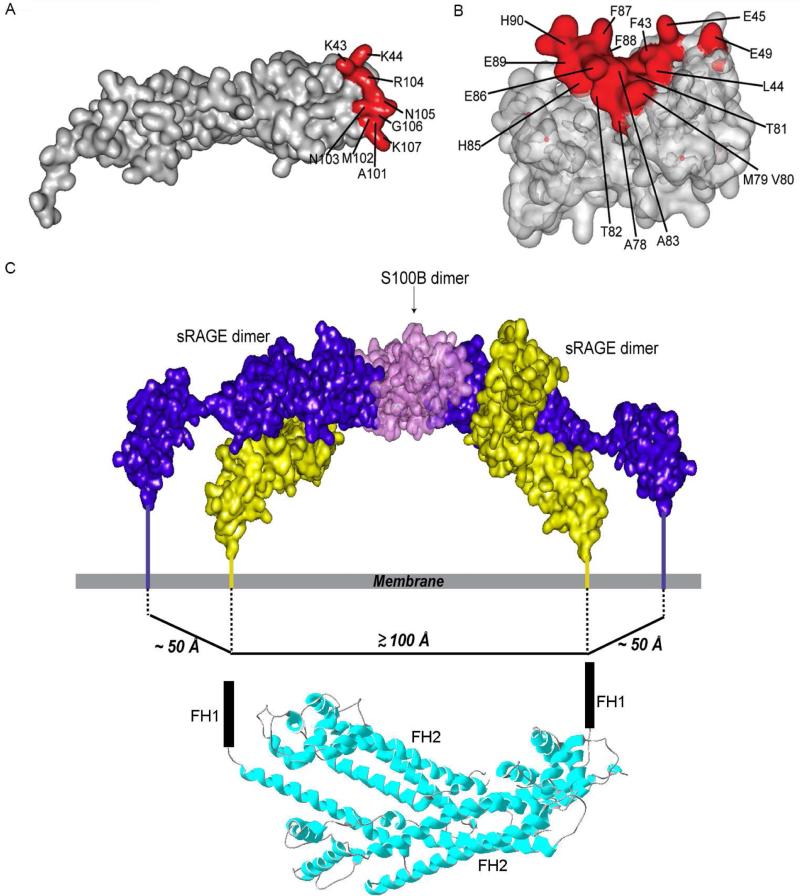
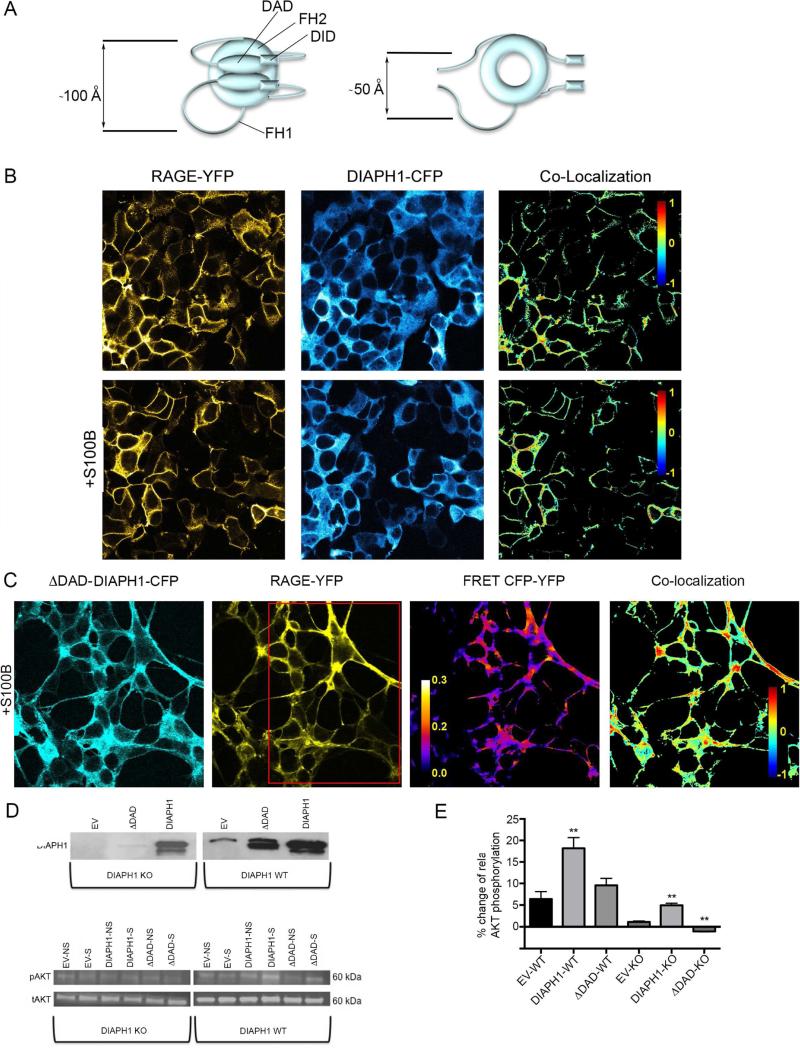
The weak oligomerization exhibited by many transmembrane receptors has a profound effect on signal transduction. The phenomenon is difficult to characterize structurally due to the large sizes of and transient interactions between monomers. The receptor for advanced glycation end products (RAGE), a signaling molecule central to the induction and perpetuation of inflammatory responses, is a weak constitutive oligomer. The RAGE domain interaction surfaces that mediate homo-dimerization were identified by combining segmental isotopic labeling of extracellular soluble RAGE (sRAGE) and nuclear magnetic resonance spectroscopy with chemical cross-linking and mass spectrometry. Molecular modeling suggests that two sRAGE monomers orient head to head forming an asymmetric dimer with the C termini directed toward the cell membrane. Ligand-induced association of RAGE homo-dimers on the cell surface increases the molecular dimension of the receptor, recruiting Diaphanous 1 (DIAPH1) and activating signaling pathways.

Keywords: NMR spectroscopy; RAGE; cancer; diabetes; diaphanous 1; hybrid method of structure determination; inflammation; mass spectrometry; pattern recognition; receptor for advanced glycation end products; segmental labeling; signal transduction.


Figures

Figure 1
Figure 1. CL-sRAGE, binds to its physiological ligand, Ca2+-S100B
(A) The scheme of chemical ligation. A nucleophilic cysteine thiol group attacks the adjacent carboxyl group, undergoing an N-S shift and is cleaved by 2-mercaptoethane sulfonic acid (MESNA) on the VC1 domain. The C-terminal thioester group of VC1 is free to ligate with the N-terminal cysteine of the C2 domain, released by thrombin cleavage of the His-tag. The subsequent transthioesterfication and S-N acyl shift create a peptide bond. (B) The ligation site (red) consists of amino acids 233-236 in the linker, indicated by the bar above the sequence, between the VC1 and C2 domains that is not well conserved across various species. (C) The generation of chemically-ligated sRAGE is monitored through a time-course SDS-PAGE experiment. Lanes 1 and 8 are molecular weight markers. Lanes 2-6 are time points collected at 0 h, 1 h, 3 h, 5 h and overnight. Lane 7 shows chromatographically purified CL-sRAGE. (D) Enzyme-Linked Immunosorbent Assay (ELISA) of CL-sRAGE titrated with Ca2+-S100B protein. See also Figure S1.
Figure 2
Figure 2. All three domains are involved in sRAGE homo-dimerization
(A) Overlay of the 15N-HSQC spectra of free [U- 2D, 15N]-VC1 domain (black) and the [U- 2D, 15N]-VC1 domain in CL-sRAGE (red). Y113 and G69 peaks from free [U- 2D, 15N]-VC1 domain (black) and the [U- 2D, 15N]-VC1 domain in CL-sRAGE at 50 uM (blue) and 80 uM (red) are overlaid in insets. The Y113 peaks exhibit concentration dependent chemical shift changes consistent with the involvement of this residue in CL-sRAGE dimerization whereas those of G69 do not. (B) Intermolecular interaction surfaces within the homo-dimer (red) are mapped onto the VC1 domain solution structure. (C) Overlay of the 15N-HSQC spectra of [U- 15N]-free C2 domain (black) and [U- 15N]-C2 domain in CL-sRAGE (red). S307 and S113 peaks from free [U- 15N]-C2 domain (black) and the [U- 15N]-C2 domain in CL-sRAGE at 40 uM (blue) and 80 uM (red) are overlaid in insets. The S307 peaks exhibit concentration dependent peak intensity changes consistent with the involvement of this residue in CL-sRAGE dimerization whereas those of S113 do not. Contour levels in the inserts spectra were normalized by a side chain peak at 8.5 and 111 ppm in proton and nitrogen dimensions, respectively, which exhibited minimal changes in both chemical shift and peak intensity. (D) Intermolecular interaction surface within the homo-dimer (red) is mapped onto the C2 domain solution structure. In (A) and (C), backbone assignments of the residues that exhibited significant changes in chemical shifts and/or peak intensities in CL-sRAGE are labeled. Assignments in bold correspond to residues that were either mutated or become unlabeled due to the molecular constructs used to create CL-sRAGE. See also Figure S2.
Figure 3
Figure 3. MS characterization of cross-linked peptides from CL-sRAGE
(A) Sequence and composition of cross-linked peptides. Observed fragment ions and their charge states are labeled according to standard nomenclature. BS3-modified fragments are labeled with stars (*). (B) A representative high-energy collision (HCD) spectrum obtained upon activation of the cross-linked product observed at m/z 1084.895 in the digestion mixture. The experimental mass (M) afforded by this triply charged precursor ion matched the theoretical mass of 3251.661 calculated from the putative elemental composition. Black and red colors represent the cross-linked peptides. The observed fragment ions (y and b fragment ions) afforded almost complete coverage, which revealed the presence and position of the BS3 moiety within the cross-linked product. See also Figure S3.
Figure 4
Figure 4. Model of the sRAGE homo-dimer
(A) Two monomers (purple and yellow) orient head to head with each other in the flat ribbon display. The elements of the sRAGE secondary structure involved in dimerization are labeled based on the VC1 (Koch et al., 2010) and C2 (Yatime and Andersen, 2013) secondary structure assignments. A close up of two unambiguous distance constraints is shown in the upper panel. The distances between cross-linked residues, K62-K123 and K107-K123, match the BS3 spacer length. (B) A half-transparent molecular surface and flat ribbon display of the homo-dimer model in is shown in two colors. Electrostatic contacts are observed between residues K110-E125, R114-D128 and K169-Q268, while hydrogen bonds are observed between residues R116-S131, L164-S306 and E168-T304 (upper panel). (C) The electrostatic potential mapped onto the solution structure of the sRAGE homo-dimer reveals a global interaction between the monomers: The electrostatic surface potential of the VC1 domain is positive (blue), and that of the C2 domain is generally negative (red). The localization of opposite charge clusters facilitate charge neutralization and depolarization in the homo-dimer. Higher order sRAGE oligomers can form by utilizing solvent exposed dimerization surfaces (circled regions). See also Figure S4, Tables S1 and S2.
Figure 5
Figure 5. S100B induced homo-dimer clustering and dramatic increase in RAGE dimensions
(A) V domain residues that comprise the VC1-Ca2+-S100B intermolecular interaction surface (red) mapped onto the VC1 domain. (B) Ca2+-S100B residues that comprise the VC1-Ca2+-S100B intermolecular interaction surface (red) mapped onto the Ca2+-S100B dimer. (C) Model of an Ca2+-S100B dimer bound to two sRAGE homo-dimers showing the proposed transmembrane interaction between RAGE and DIAPH1. The spacing between the ctRAGE-binding FH1 domains of the DIAPH1 dimer (PDB code 1V9D (Shimada et al., 2004)) is comparable to the distance between the C-termini of the two homo-dimers. See also Figure S5 and S6, Tables S1 and S2.
Figure 6
Figure 6. Full-length DIAPH1 is required for RAGE signaling
(A) Schematic representation of free full length DIAPH1 (left) and ΔDAD- DIAPH1 (right). The compact conformation of free full length DIAPH1 FH2 domains form a lasso orienting the FH1 domains ~100 Å apart (Maiti et al., 2012; Shimada et al., 2004). The extended conformation of ΔDAD- DIAPH1 allows the FH1 domains to span a smaller distance of ~50 Å. (B) RAGE-YFP and DIAPH1-CFP co-localize on the HEK293 cell surface (upper panels). Adding Ca2+-S100B (lower panels) further increases the co-localization from nMDP=0.055 ±0.003 to nMDP=0.065 ±0.003, p<0.05. (C) ΔDAD- DIAPH1-CFP and RAGE-YFP readily co-localize on HEK293 cells after adding Ca2+-S100B. FRET between CFP and YFP was observed after photobleaching RAGE-YFP in the region shown by the red rectangle. The FRET efficiency between RAGE-YFP and ΔDAD-DIAPH1-CFP was 10 ± 3%, whereas acceptor photobleaching typically results in over a 90% decrease in fluorescence. (D) Full-length DIAPH1 supports RAGE signaling, whereas ΔDAD-DIAPH1 does not. WT SMCs (right panels) and DIAPH1 KO SMCs (left panels) transfected with either empty vector (EV), ΔDAD-DIAPH1-CFP (ΔDAD), or DIAPH1-CFP (DIAPH1) were stimulated with 1 μM of Ca2+-S100B. Cell lysates were separated by SDS-PAGE and immunobloted with antibodies specific for DIAPH1 (upper panels), phospho-AKT (middle panels) or total AKT (bottom panels). (E). Changes in phosphorylation levels of AKT following stimulation by Ca2+-S100B. Double asterisks at the top of the bars represent a statistically significant (p< 0.05) change in AKT phosphorylation due to simulation as compared to EV. Note the apparent lack of RAGE signaling stimulation when SMCs are transfected with either empty vector or ΔDAD- DIAPH1-CFP. NS and S stand for non-stimulated and stimulated cells. The data represent three separate experiments. See also Figure S7.

Similar articles

Cited by

References

    1. Angers S, Salahpour A, Bouvier M. Dimerization: an emerging concept for G protein-coupled receptor ontogeny and function. Annual review of pharmacology and toxicology. 2002;42:409–435. - PubMed
    1. Bernado P, Garcia de la Torre J, Pons M. Interpretation of 15N NMR relaxation data of globular proteins using hydrodynamic calculations with HYDRONMR. J Biomol NMR. 2002;23:139–150. - PubMed
    1. Berry R, Chen Z, McCluskey J, Rossjohn J. Insight into the basis of autonomous immunoreceptor activation. Trends in immunology. 2011;32:165–170. - PubMed
    1. Bianchi R, Kastrisianaki E, Giambanco I, Donato R. S100B protein stimulates microglia migration via RAGE-dependent up-regulation of chemokine expression and release. The Journal of biological chemistry. 2011;286:7214–7226. - PMC - PubMed
    1. Blobel J, Bernado P, Xu H, Jin C, Pons M. Weak oligomerization of low-molecular-weight protein tyrosine phosphatase is conserved from mammals to bacteria. The FEBS journal. 2009;276:4346–4357. - PubMed

MeSH terms