Proximity-Based Differential Single-Cell Analysis of the Niche to Identify Stem/Progenitor Cell Regulators
- PMID: 27524439
- PMCID: PMC5402355
- DOI: 10.1016/j.stem.2016.07.004
Proximity-Based Differential Single-Cell Analysis of the Niche to Identify Stem/Progenitor Cell Regulators
Abstract
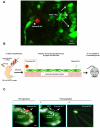
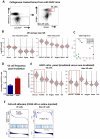
Physiological stem cell function is regulated by secreted factors produced by niche cells. In this study, we describe an unbiased approach based on the differential single-cell gene expression analysis of mesenchymal osteolineage cells close to, and further removed from, hematopoietic stem/progenitor cells (HSPCs) to identify candidate niche factors. Mesenchymal cells displayed distinct molecular profiles based on their relative location. We functionally examined, among the genes that were preferentially expressed in proximal cells, three secreted or cell-surface molecules not previously connected to HSPC biology-the secreted RNase angiogenin, the cytokine IL18, and the adhesion molecule Embigin-and discovered that all of these factors are HSPC quiescence regulators. Therefore, our proximity-based differential single-cell approach reveals molecular heterogeneity within niche cells and can be used to identify novel extrinsic stem/progenitor cell regulators. Similar approaches could also be applied to other stem cell/niche pairs to advance the understanding of microenvironmental regulation of stem cell function.
Copyright © 2016 Elsevier Inc. All rights reserved.
Figures


Comment in
-
Angiogenin Defines Heterogeneity at the Core of the Hematopoietic Niche.Cell Stem Cell. 2016 Sep 1;19(3):284-6. doi: 10.1016/j.stem.2016.08.017. Cell Stem Cell. 2016. PMID: 27588743
Similar articles
-
The critical and specific transcriptional regulator of the microenvironmental niche for hematopoietic stem and progenitor cells.Curr Opin Hematol. 2015 Jul;22(4):330-6. doi: 10.1097/MOH.0000000000000153. Curr Opin Hematol. 2015. PMID: 26049754 Review.
-
Three-dimensional co-culture of mesenchymal stromal cells and differentiated osteoblasts on human bio-derived bone scaffolds supports active multi-lineage hematopoiesis in vitro: Functional implication of the biomimetic HSC niche.Int J Mol Med. 2016 Oct;38(4):1141-51. doi: 10.3892/ijmm.2016.2712. Epub 2016 Aug 19. Int J Mol Med. 2016. PMID: 27571775 Free PMC article.
-
Constitutive Activation of NIK Impairs the Self-Renewal of Hematopoietic Stem/Progenitor Cells and Induces Bone Marrow Failure.Stem Cells. 2017 Mar;35(3):777-786. doi: 10.1002/stem.2523. Epub 2016 Nov 2. Stem Cells. 2017. PMID: 27733012 Free PMC article.
-
Heterogeneity of the bone marrow niche.Curr Opin Hematol. 2016 Jul;23(4):331-8. doi: 10.1097/MOH.0000000000000265. Curr Opin Hematol. 2016. PMID: 27177311 Free PMC article. Review.
-
Junctional Adhesion Molecule-A Is Highly Expressed on Human Hematopoietic Repopulating Cells and Associates with the Key Hematopoietic Chemokine Receptor CXCR4.Stem Cells. 2016 Jun;34(6):1664-78. doi: 10.1002/stem.2340. Epub 2016 Mar 15. Stem Cells. 2016. PMID: 26866290
Cited by
-
Lipids in the Bone Marrow: An Evolving Perspective.Cell Metab. 2020 Feb 4;31(2):219-231. doi: 10.1016/j.cmet.2019.09.015. Epub 2019 Oct 24. Cell Metab. 2020. PMID: 31668874 Free PMC article. Review.
-
Dynamic regulation of hematopoietic stem cells by bone marrow niches.Curr Stem Cell Rep. 2018 Sep;4(3):201-208. doi: 10.1007/s40778-018-0132-x. Epub 2018 Aug 2. Curr Stem Cell Rep. 2018. PMID: 30984517 Free PMC article.
-
tiRNA signaling via stress-regulated vesicle transfer in the hematopoietic niche.Cell Stem Cell. 2021 Dec 2;28(12):2090-2103.e9. doi: 10.1016/j.stem.2021.08.014. Epub 2021 Sep 21. Cell Stem Cell. 2021. PMID: 34551362 Free PMC article.
-
Stemness in Cancer: Stem Cells, Cancer Stem Cells, and Their Microenvironment.Stem Cells Int. 2017;2017:5619472. doi: 10.1155/2017/5619472. Epub 2017 Apr 4. Stem Cells Int. 2017. PMID: 28473858 Free PMC article. Review.
-
Hyperpolarised 13C-MRI identifies the emergence of a glycolytic cell population within intermediate-risk human prostate cancer.Nat Commun. 2022 Jan 24;13(1):466. doi: 10.1038/s41467-022-28069-2. Nat Commun. 2022. PMID: 35075123 Free PMC article.
References
-
- Adams GB, Martin RP, Alley IR, Chabner KT, Cohen KS, Calvi LM, Kronenberg HM, Scadden DT. Therapeutic targeting of a stem cell niche. Nat Biotechnol. 2007;25:238–243. - PubMed
-
- Bruscia EM, Ziegler EC, Price JE, Weiner S, Egan ME, Krause DS. Engraftment of donor-derived epithelial cells in multiple organs following bone marrow transplantation into newborn mice. Stem cells. 2006;24:2299–2308. - PubMed
Publication types
MeSH terms
Substances
Grants and funding
- K25 AG037596/AG/NIA NIH HHS/United States
- T32 HL087735/HL/NHLBI NIH HHS/United States
- P01 HL131477/HL/NHLBI NIH HHS/United States
- F31 HL128127/HL/NHLBI NIH HHS/United States
- R01 EB014703/EB/NIBIB NIH HHS/United States
- R01 HL097794/HL/NHLBI NIH HHS/United States
- R03 HL096372/HL/NHLBI NIH HHS/United States
- R01 DK050234/DK/NIDDK NIH HHS/United States
- R01 NS065237/NS/NINDS NIH HHS/United States
- R01 CA105241/CA/NCI NIH HHS/United States
- 11831/CRUK_/Cancer Research UK/United Kingdom
- R01 DK107784/DK/NIDDK NIH HHS/United States
LinkOut - more resources
Full Text Sources
Other Literature Sources
Medical
Molecular Biology Databases
Miscellaneous

