. 2016 Aug 23;16(8):2169-2177.
doi: 10.1016/j.celrep.2016.07.042. Epub 2016 Aug 11.

A Link between Integral Membrane Protein Expression and Simulated Integration Efficiency

Affiliations

A Link between Integral Membrane Protein Expression and Simulated Integration Efficiency

Stephen S Marshall et al. Cell Rep. .

Abstract

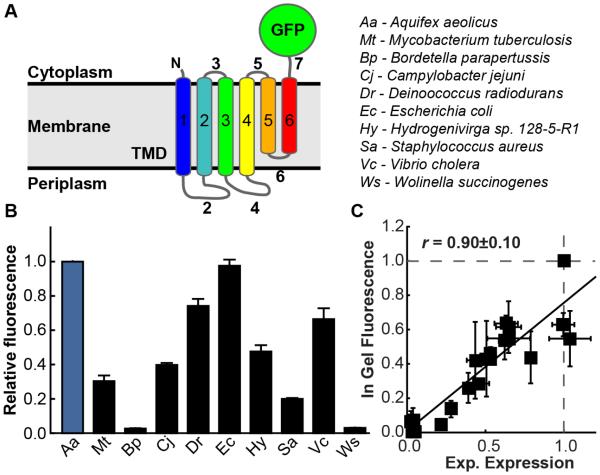
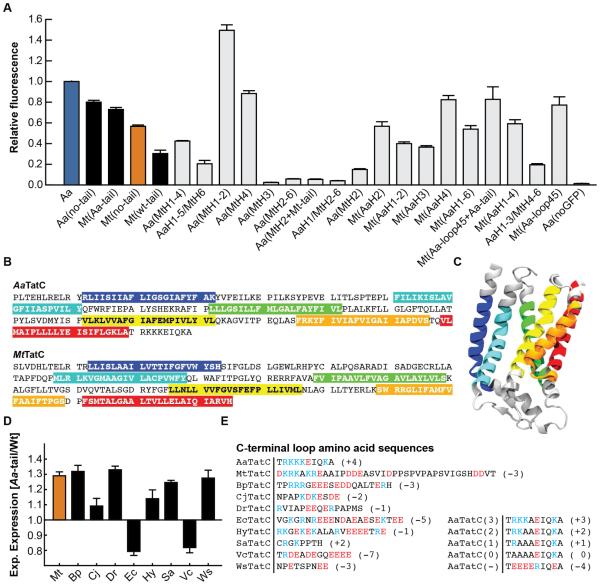
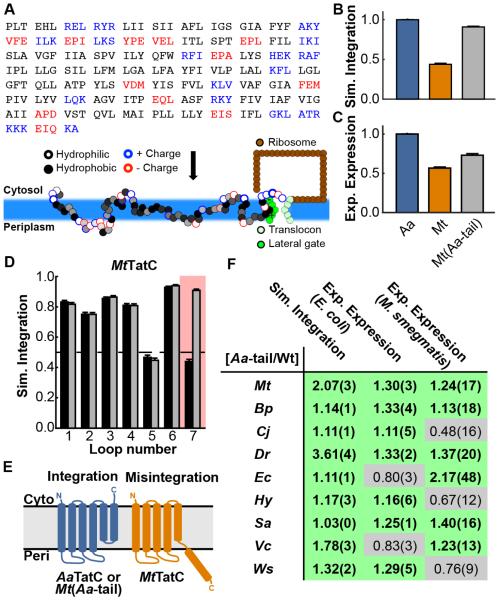
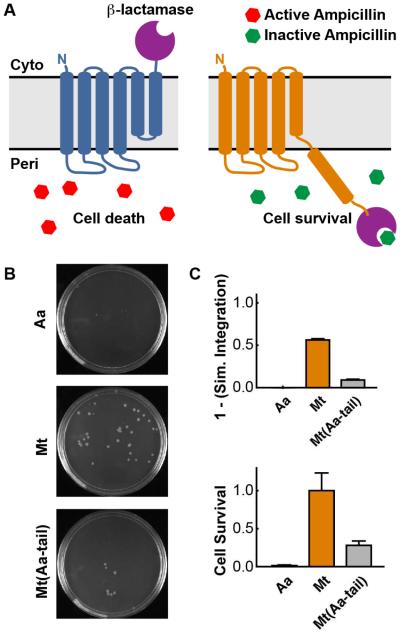
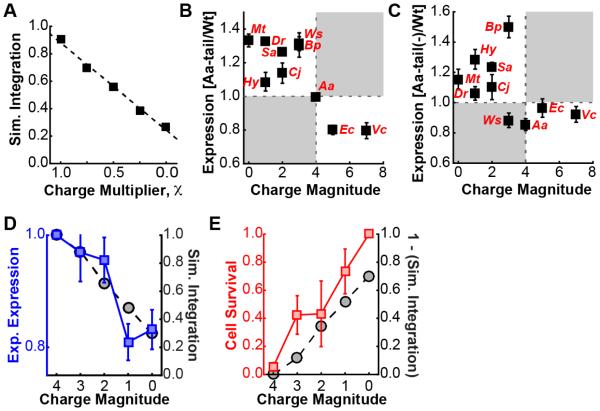
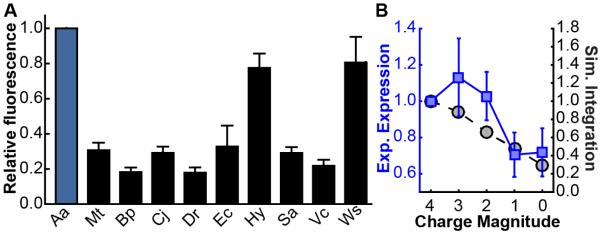
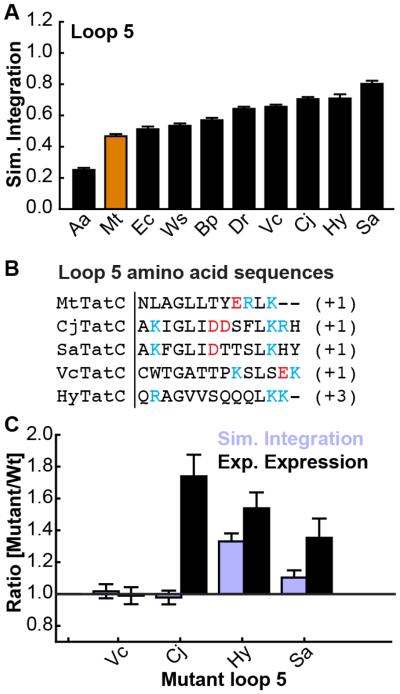
Integral membrane proteins (IMPs) control the flow of information and nutrients across cell membranes, yet IMP mechanistic studies are hindered by difficulties in expression. We investigate this issue by addressing the connection between IMP sequence and observed expression levels. For homologs of the IMP TatC, observed expression levels vary widely and are affected by small changes in protein sequence. The effect of sequence changes on experimentally observed expression levels strongly correlates with the simulated integration efficiency obtained from coarse-grained modeling, which is directly confirmed using an in vivo assay. Furthermore, mutations that improve the simulated integration efficiency likewise increase the experimentally observed expression levels. Demonstration of these trends in both Escherichia coli and Mycobacterium smegmatis suggests that the results are general to other expression systems. This work suggests that IMP integration is a determinant for successful expression, raising the possibility of controlling IMP expression via rational design.


Figures

Figure 1
Figure 1. Variation in the expression of TatC homologs in E. coli.
(A) A topology representation of TatC with a GFP C-terminal tag, as used in the expression studies. TMDs and loops are indicated in colors and gray, respectively, and are numbered. (B) Expression levels of various TatC homologs in E. coli, measured by TatC-GFP fluorescence, with expression levels normalized to AaTatC (blue). Error bars indicate the standard error of mean. (C) Correlation of the in-gel fluorescence quantified for each band versus the experimental expression measured by flow cytometry. Both metrics are highly correlated across multiple trials (Pearson correlation coefficient R=−0.9±0.1) with in-gel fluorescence showing the same trends in expression yield as seen by flow-cytometry. Error bars indicate the standard error of mean. See also Figure S1.
Figure 2
Figure 2. Effect of the C-tail on TatC expression in E. coli.
(A) Measured expression levels of the AaTatC and MtTatC chimera proteins, normalized to AaTatC. Shaded bars represent wild-type TatC homologs and mutants with C-tail modifications. (B) Domain definitions used in generating the swap chimeras, with TMDs highlighted. (C) A ribbons diagram of the structure of AaTatC (pdbID 4HTS). TMDs are colored according to the highlights used in part (B). (D) For each homolog, the ratio of the measured expression level for the Aa-tail chimera to that of the corresponding wild-type sequence. (E) TatC wild-type and charge mutant C-tail sequences. Positive residues are in blue and negative residues are in red. The net charge is shown to the right of each sequence. Error bars indicate the standard error of mean.
Figure 3
Figure 3. Calculation of TatC integration efficiencies
(A) Schematic illustration of the CG simulation model that is used to model co-translational IMP membrane integration. The amino-acid sequence of the IMP is mapped onto CG beads, with each consecutive trio of amino-acid residues in the nascent protein sequence mapped to an associated CG bead; the underlying properties of the amino-acid residues determine the interactions of the CG beads, as described in the text. (B) Simulated integration efficiency of the AaTatC, MtTatC, and Mt(Aa-tail) sequences. (C) Experimental expression of the AaTatC, MtTatC, and Mt(Aa-tail) sequences. (D) The simulated integration efficiency for individual loops of both the wild-type MtTatC sequence (black bars) and the Aa-tail swap chimera (grey bars), with loop 7 highlighted. (E) Schematic of the correct and incorrect TatC topologies observed in the simulations; misintegration of loop 7 and translocation of TMD 6 leads to an incorrect final topology for MtTatC. Error bars indicate the standard error of mean. (F) For each homolog, comparison between the experimental expression levels in E. coli and M. smegmatis and the simulated integration efficiencies, reporting the ratio of the Aa-tail chimera result to that of the corresponding wild-type sequence. Ratios exceeding unity are highlighted in green, indicating enhancement due to the Aa-tail. Values in parentheses indicate the standard error of mean. See also Figure S4.
Figure 4
Figure 4. Correlation of antibiotic resistance to membrane topology
(A) Schematic of the cytoplasmic and periplasmic topologies of the TatC C-tail with the fused β-lactamase enzyme. Misintegration of loop 7 leads to periplasmic localization of the β-lactamase, resulting in enhanced antibiotic resistance and cell survival. (B) Representative plates from the ampicillin survival test. (C) Comparison of the simulated integration efficiency (top) and relative ampicillin survival rate (bottom) for AaTatC, MtTatC, and Mt(Aa-tail). The reported cell survival corresponds to the ratio of counted cells post-treatment versus prior to treatment with ampicillin; all values are reported relative to MtTatC. Error bars indicate the standard error of mean.
Figure 5
Figure 5. Mechanistic basis associated with charged C-tail residues
(A) Simulated integration efficiency of the Mt(Aa-tail) chimera, as a function of scaling the charges of the C-tail residues. (B) Correlation of the ratio of the measured expression for the Aa-tail swap chimeras to that of the corresponding wild-type sequence versus the charge magnitude of the wild-type C-tail (data from Figure 2B and Figure 2E). Linear regression yields a fit of R = −0.8±0.2. (C) Correlation of the ratio of the measured expression for the Aa-tail(−) swap chimeras to that of the corresponding wild-type sequence versus the charge magnitude of the wild-type C-tail, where the Aa-tail(−) swap chimeras include a variant of the Aa-tail with net negative charge and the same overall charge magnitude. (D) Experimental expression levels in E. coli (blue, left axis) and simulated integration efficiency (black, right axis) for a series of mutants of the Mt(Aa-tail) sequence, in which positively charged residues in the Aa-tail are mutated to alanine residues. Reported values are normalized to Mt(Aa-tail). (E) Relative ampicillin survival rate in E. coli (red, left axis) and simulated integration efficiency (black, right axis) for a series of mutants of the Mt(Aa-tail) sequence, in which positively charged residues in the Aa-tail are mutated to alanine residues. Simulation results are normalized as in part (d), while ampicillin survival is normalized to the highest survival rate (i.e., with zero charge magnitude). Error bars indicate the standard error of mean.
Figure 6
Figure 6. M. smegmatis expression tests
(A) Expression levels of various TatC homologs in M. smegmatis, measured by TatC-GFP fluorescence, with expression levels normalized to AaTatC (blue). (B) Simulated integration efficiency (blue, left axis) and measured expression levels in M. smegmatis (black, right axis) for a series of mutants of the Mt(Aa-tail) sequence, in which positively charged residues in the Aa-tail are mutated to alanine residues. Error bars indicate the standard error of mean.
Figure 7
Figure 7. Loop 5 analysis for MtTatC
(A) Simulated integration efficiency of loop 5 for the TatC homologs. (B) Loop 5 amino-acid sequence for various TatC homologs. (C) Experimental expression (black) and simulated integration efficiency (purple) for the loop 5 swap chimeras of MtTatC in which the entire loop 5 sequence of wild-type MtTatC is replaced with the corresponding sequence of other homologs. Error bars indicate the standard error of mean.

Similar articles

Cited by

References

    1. BOGSCH EG, SARGENT F, STANLEY NR, BERKS BC, ROBINSON C, PALMER T. An essential component of a novel bacterial protein export system with homologues in plastids and mitochondria. J Biol Chem. 1998;273:18003–6. - PubMed
    1. DALEY DO, RAPP M, GRANSETH E, MELÉN K, DREW D, HEIJNE GV. Global Topology Analysis of the Escherichia coli Inner Membrane Proteome. Science. 2005;308:1321–1323. - PubMed
    1. DREW D, SLOTBOOM DJ, FRISO G, REDA T, GENEVAUX P, RAPP M, MEINDL-BEINKER NM, LAMBERT W, LERCH M, DALEY DO, VAN WIJK KJ, HIRST J, KUNJI E, DE GIER JW. A scalable, GFP-based pipeline for membrane protein overexpression screening and purification. Protein Sci. 2005;14:2011–7. - PMC - PubMed
    1. FLUMAN N, NAVON S, BIBI E, PILPEL Y. mRNA-programmed translation pauses in the targeting of E. coli membrane proteins. Elife. 2014;3 - PMC - PubMed
    1. GEERTSMA ER, GROENEVELD M, SLOTBOOM DJ, POOLMAN B. Quality control of overexpressed membrane proteins. Proc Natl Acad Sci U S A. 2008;105:5722–7. - PMC - PubMed

MeSH terms