. 2016 Aug 23;16(8):2142-2155.
doi: 10.1016/j.celrep.2016.07.055. Epub 2016 Aug 11.

Phosphorylation-Induced Motor Shedding Is Required at Mitosis for Proper Distribution and Passive Inheritance of Mitochondria

Affiliations

Phosphorylation-Induced Motor Shedding Is Required at Mitosis for Proper Distribution and Passive Inheritance of Mitochondria

Jarom Yan-Ming Chung et al. Cell Rep. .

Abstract

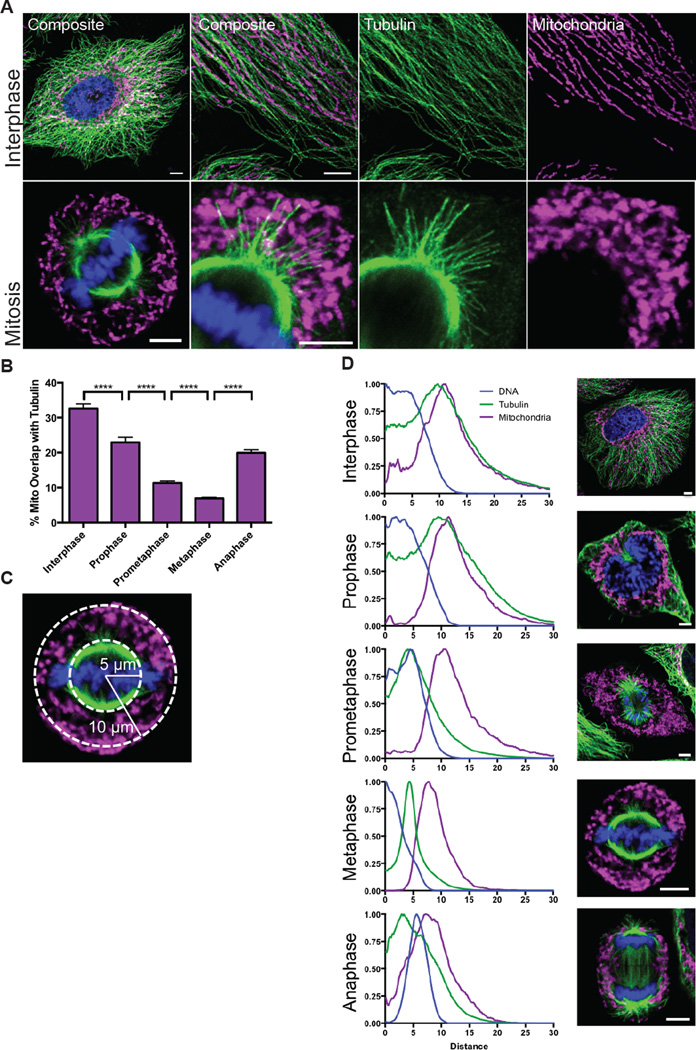
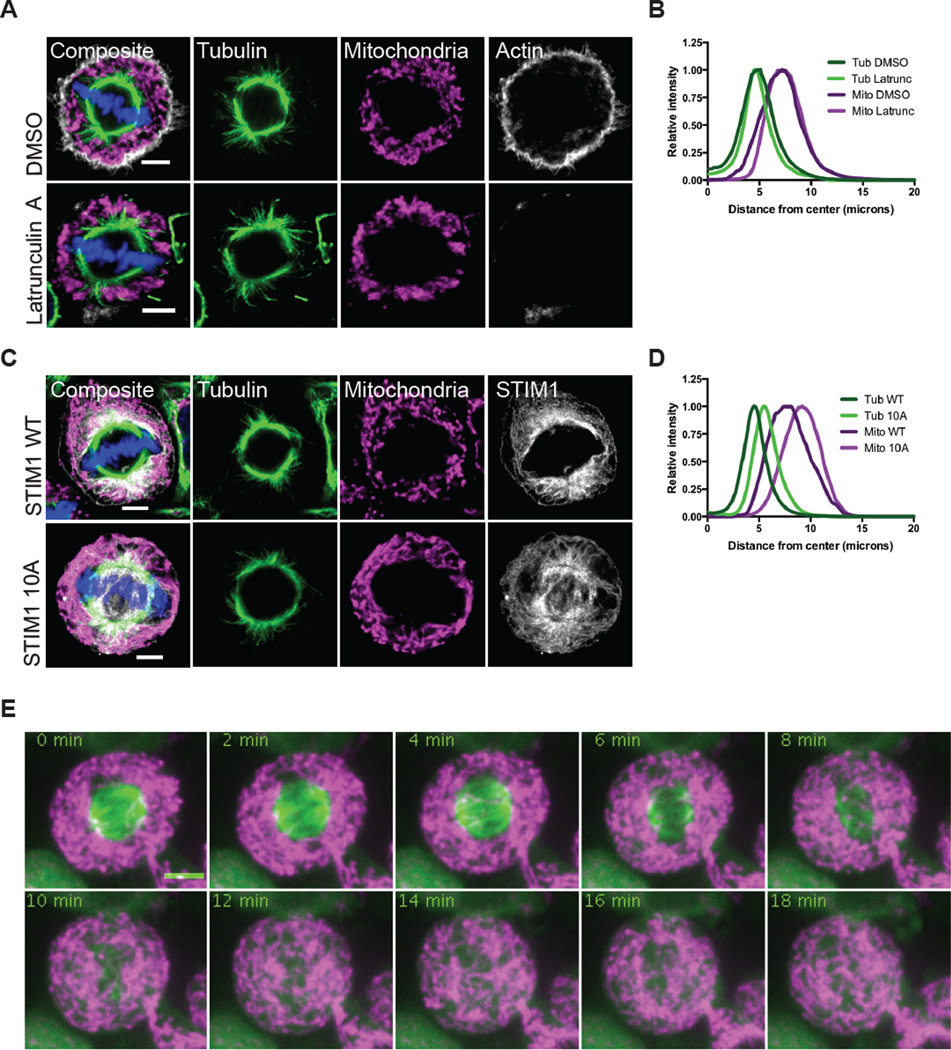
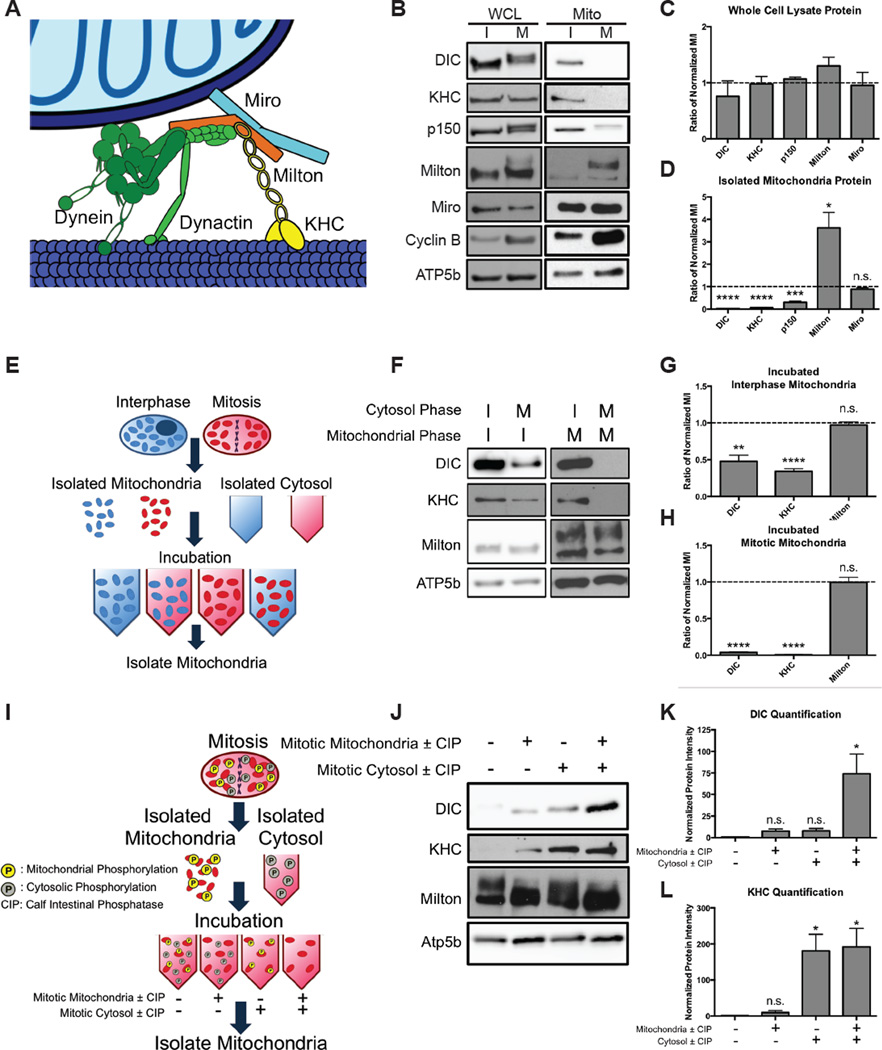
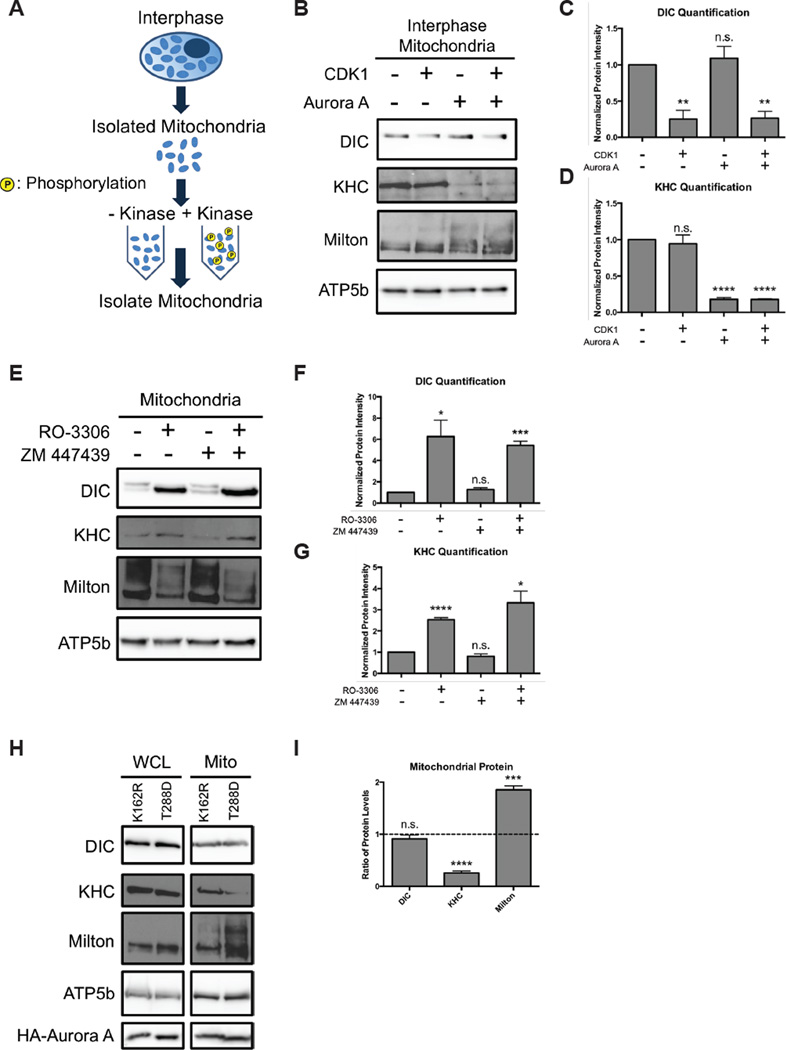
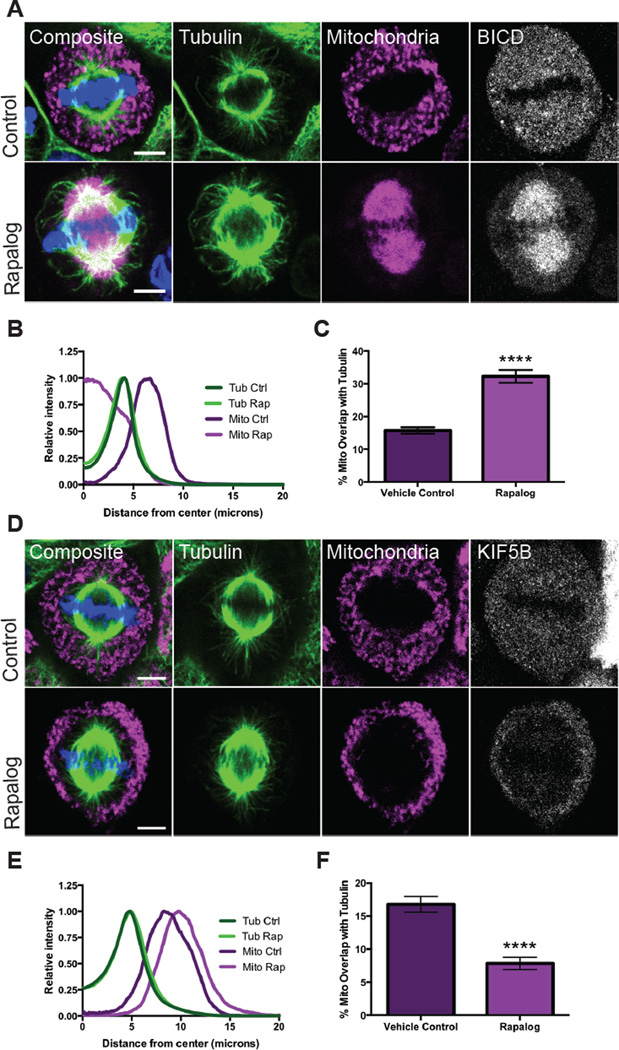
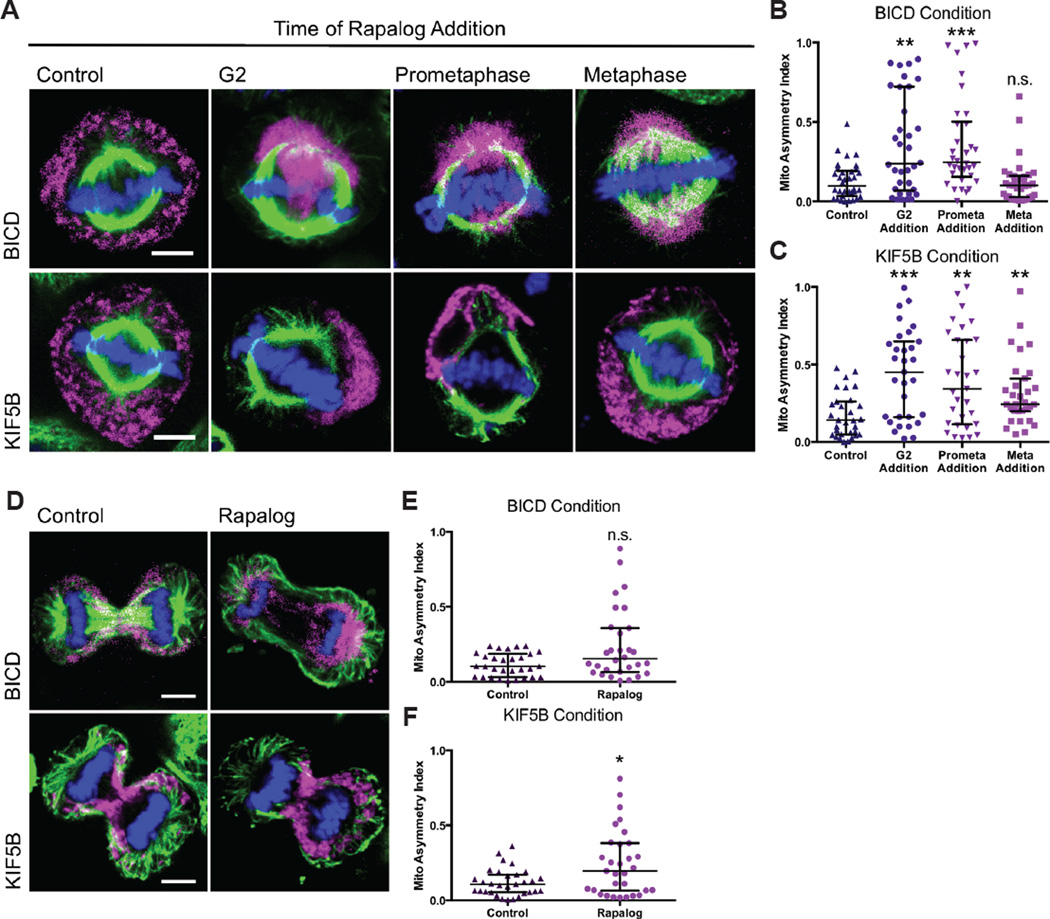
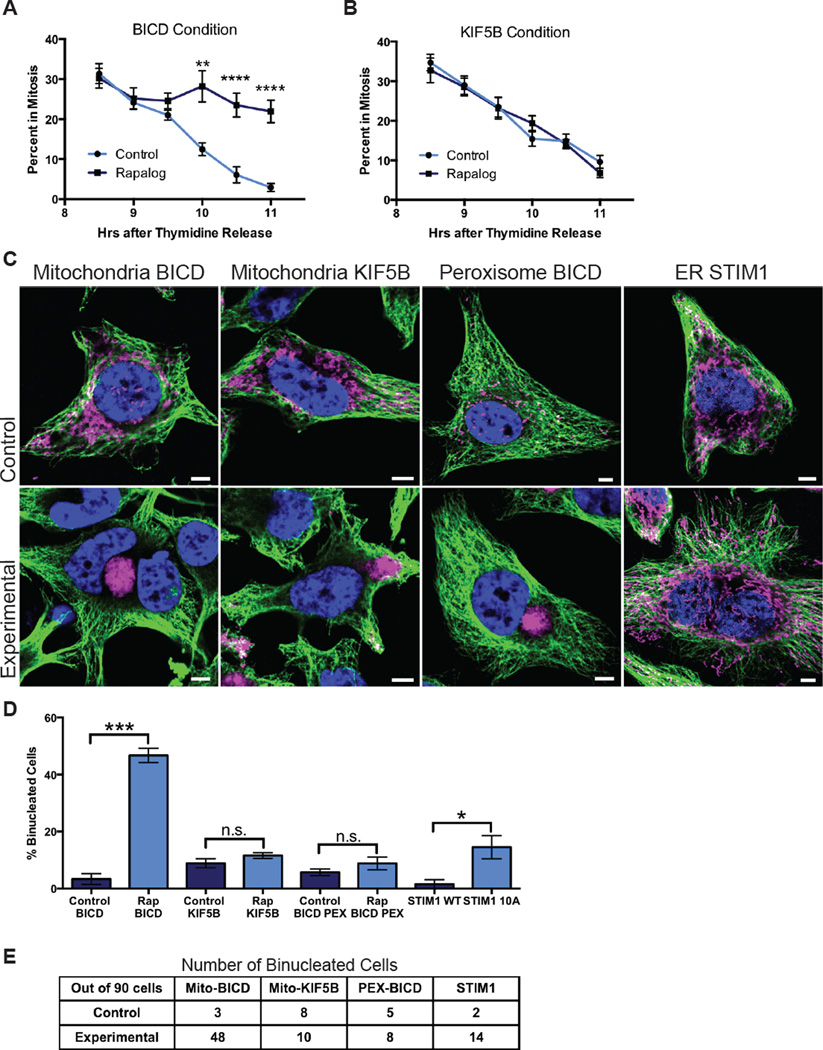
While interphase mitochondria associate with microtubules, mitotic mitochondria dissociate from spindle microtubules and localize in the cell periphery. Here, we show that this redistribution is not mediated by mitochondrial active transport or tethering to the cytoskeleton. Instead, kinesin and dynein, which link mitochondria to microtubules, are shed from the mitochondrial surface. Shedding is driven by phosphorylation of mitochondrial and cytoplasmic targets by CDK1 and Aurora A. Forced recruitment of motor proteins to mitotic mitochondria to override this shedding prevents their proper symmetrical distribution and disrupts the balanced inheritance of mitochondria to daughter cells. Moreover, when mitochondria with bound dynein bind to the mitotic spindle, they arrest cell-cycle progression and produce binucleate cells. Thus, our results show that the regulated release of motor proteins from the mitochondrial surface is a critical mitotic event.


Figures

Figure 1
Figure 1. Mitochondria are released from microtubules during cell division
(A) Interphase and mitotic HeLa cells were stained for TOM20 (magenta), a mitochondrial marker, tubulin (green), and DNA (Hoechst 33342, blue) and imaged by confocal microscopy at 63x and 100x. (B) Percent of the total mitochondrial area that overlapped with tubulin during each mitotic phase. (C) Schematic of how the radial distributions of tubulin and mitochondria were calculated relative to the center of the DNA. (D) The radial distributions were averaged for 30 cells for each mitotic phase. Images are representative of the phase. ****p < 0.0001; All values are shown as mean ± SEM. Scale bars represent 5 microns.
Figure 2
Figure 2. Mitochondrial distribution is independent of actin or ER tethering during mitosis
(A) HeLa cells were synchronized into metaphase cells and treated for 10 min with DMSO or Latrunculin A prior to fixation. Mitochondria (TOM20, magenta), tubulin (green), and actin filaments (grey) were immunostained and imaged by confocal microscopy. (B) The radial distributions of tubulin and mitochondria were averaged for 30 metaphase cells treated as in (A). (C) HeLa cells were transiently transfected with STIM1 constructs. Mitochondria (TOM20, magenta), tubulin (green), and STIM1 (grey) were immunostained and imaged by confocal microscopy. (D) The radial distributions of tubulin and mitochondria were averaged for 30 metaphase cells expressing STIM1 WT or STIM 10A as in (C). (E) HeLa cells were transfected with Mito-dsRed and GFP-tubulin and synchronized. Cells were treated with nocodazole (0 min) and images were taken every 2 minutes. Scale bars represent 5 microns.
Figure 3
Figure 3. Phosphorylation detaches dynein and kinesin motors from mitochondria during mitosis
(A) Schematic of the motor adaptor complex including Miro, Milton, kinesin (KHC), dynein and dynactin. (B–D) HeLa cells were synchronized into interphase or mitosis (nocodazole-induced arrest). Whole cell lysates (WCL) and isolated mitochondria (Mito) were probed for the indicated proteins of the motor adaptor complex. Levels of the motor protein subunits were reduced on mitotic mitochondria, but Milton and Miro remained on mitochondria. Several protein’s positions were altered by mitotic phosphorylations. Elevated Cyclin B levels verified that cells were in mitosis, and the mitochondrial protein ATP5b verified equal mitochondrial content in the samples. Band intensities were quantified (C,D), and each mitotic protein was normalized to the level of that protein at interphase and the fold changes are shown. n = 3. (E–H) Schematic, immunoblot, and quantification of a biochemical assay to determine if interphase or mitotic cytosol can alter the mitochondrial association of the motors. Mitochondria from either interphase (I) or mitosis (M) were incubated with interphase or mitotic cytosol. Mitochondria were re-isolated and assayed for the indicated proteins. Mitotic cytosol induced motor release, and interphase cytosol reattached motors in the assay. Band intensities were quantified, and the relative effects of the two types of cytosol were compared by normalizing the intensity of the band with mitotic cytosol to that with interphase cytosol. The fold changes for interphase mitochondria (G) and mitotic mitochondria (H) so treated are shown. n = 3. (I–L) Assay to determine if treatment with calf intestinal phosphatase (CIP) can allow motors to reattach. The mitochondrial and cytosolic fractions were treated with either CIP alone (+) or CIP and the phosphatase inhibitor NaVO4 (−) prior to being recombined. Mitochondria were re-isolated and probed for the indicated proteins. DIC (K) and KHC (L) levels were quantified and normalized to the untreated fraction condition. n = 3. *p < 0.05, **p < 0.01, ***p < 0.001, ****p < 0.0001.
Figure 4
Figure 4. CDK1 and Aurora A induce motor release
(A–D) Schematic, immunoblot, and quantification of proteins on interphase mitochondria treated with or without active, purified CDK1 and Aurora A as indicated. Dynein and kinesin band intensities were quantified and normalized to the untreated fraction condition. n = 3. (E–G) Mitotic HeLa cells were treated with the CDK1 inhibitor RO-3306 and/or the Aurora inhibitor ZM447439. Isolated mitochondria were probed for the indicated proteins. Levels of DIC and KHC were quantified and normalized to the untreated fraction condition. n = 3. (H,I) HeLa cells were transfected with inactive (K162R) or constitutively active (T288D) Aurora A kinase. Whole cell extracts (WCL) and mitochondria (Mito) were probed for the indicated proteins. Protein levels were quantified, normalized to the loading control, and then expressed as the ratio of the level in the T288D cells to K162R cells. n = 3. *p < 0.05, **p < 0.01, ***p < 0.001, ****p < 0.0001.
Figure 5
Figure 5. Coupling motors to mitochondria during cell division mislocalizes the mitochondria
(A–C) HeLa cells transiently expressing Tom20-mCherry-FKBP and the dynein-binding construct HA-BICD2-FRB were synchronized and treated with ethanol (control) or the heterodimizer rapalog 10 minutes prior to fixation. Rapalog addition forced mitochondria onto the spindle. Averaged radial distribution (B) and percent overlap of mitochondrial and tubulin signals (C) for 30 cells in each condition. (D–F) HeLa cells transiently expressing Tom20-mCherry-FKBP and HA-KIF5B MD-FRB were synchronized and treated with ethanol (control) or rapalog for 10 minutes prior to fixation. Rapalog caused mitochondria to assume a more peripheral localization. Averaged radial distribution (E) and percent overlap of mitochondrial and tubulin signals (F) for 30 cells in each condition. Data are represented as mean ± SEM. Scale bars represent 5 microns. **** p <0.0001
Figure 6
Figure 6. Coupling motors to mitochondria during cell division causes mitochondrial asymmetry
(A–C) HeLa cells transiently expressing Tom20-mCherry-FKBP and either HA-BICD2-FRB or HA-KIF5B MD-FRB were treated with ethanol (control) or rapalog at G2, prometaphase, or metaphase and imaged by confocal microscopy at metaphase. The asymmetric index of metaphase cells was calculated on 3D projections of treated cells for BICD-FRB transfected cells (B) and KIF5B–FRB transfected cells (C). (D–F) HeLa cells transfected as in (A) were imaged during telophase. An asymmetric index of the two daughters cells mitochondrial content was calculated for cells expressing BICD-FRB (E) or KIF5B–FRB (F). Data are represented as median with the interquartile range. Scale bars represent 5 microns. *p < 0.05, **p < 0.01, ***p < 0.001.
Figure 7
Figure 7. Organelle attachment to spindle microtubules causes mitotic arrest and binucleate cells
HeLa cells transiently expressing Tom20-mCherry-FKBP and either HA-BICD2-FRB (A) or HA-KIF5B MD-FRB (B) were released from thymidine block and treated with ethanol (control) or rapalog. The percentage of transfected cells in mitosis was determined at the indicated times after thymidine block release. Vehicle treated cells and those expressing KIF5B-FRB proceeded normally through mitosis, but rapalog-treated BICD-FRB expressing cells failed to exit mitosis. (C–E) HeLa cells were transiently transfected with the following constructs: Tom20-mCherry-FKBP and HA-BICD-FRB (Mitochondria BICD); Tom20-mCherry-FKBP and HA-KIF5B MD-FRB (Mitochondria KIF5B); PEX-RFP-FKBP and HA-BICD-FRB (Peroxisome BICD); STIM1 WT (ER STIM1, control) or STIM1 10A (ER STIM1, experimental). The cells with FKBP and FRB constructs were treated with either ethanol (control) or rapalog (experimental) during G2. (C) Tubulin (green), DNA (blue) and mCherry/Tom20 (mitochondria, magenta) or RFP (peroxisomes, magenta) were imaged by confocal microscopy. (D) The percentages of binucleate cells from three independent experiments were averaged and compared by Student’s t-test. A table of the actual cell counts are shown in (E). Scale bars represent 5 microns. Data are represented as mean ± SEM. *p < 0.05, **p < 0.01, ***p < 0.001.

References

    1. Allan VJ, Vale RD. Cell cycle control of microtubule-based membrane transport and tubule formation in vitro. The Journal of cell biology. 1991;113:347–359. - PMC - PubMed
    1. Baggethun P. 2009 Radial Profile Plot ( http://rsb.info.nih.gov/ij/plugins/radial-profile.html: U. S. National I..., Bethesda, Maryland, USA)
    1. Ball EH, Singer SJ. Mitochondria are associated with microtubules and not with intermediate filaments in cultured fibroblasts. Proceedings of the National Academy of Sciences of the United States of America. 1982;79:123–126. - PMC - PubMed
    1. de Brito OM, Scorrano L. Mitofusin 2 tethers endoplasmic reticulum to mitochondria. Nature. 2008;456:605–610. - PubMed
    1. Dell KR, Turck CW, Vale RD. Mitotic phosphorylation of the dynein light intermediate chain is mediated by cdc2 kinase. Traffic (Copenhagen, Denmark) 2000;1:38–44. - PubMed

LinkOut - more resources