. 2011;106(495):1009-1024.
doi: 10.1198/jasa.2011.tm10332. Epub 2012 Jan 24.

Independent Component Analysis Involving Autocorrelated Sources With an Application to Functional Magnetic Resonance Imaging

Affiliations

Independent Component Analysis Involving Autocorrelated Sources With an Application to Functional Magnetic Resonance Imaging

Seonjoo Lee et al. J Am Stat Assoc. 2011.

Abstract

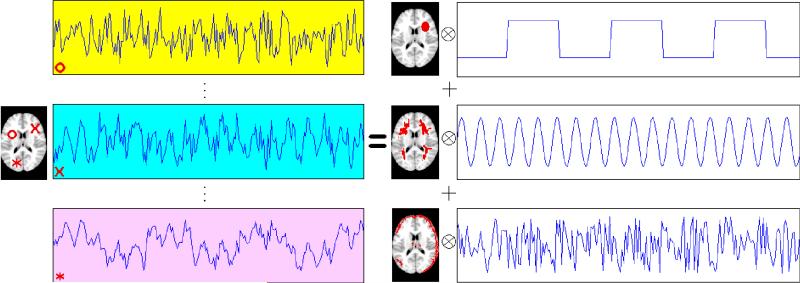
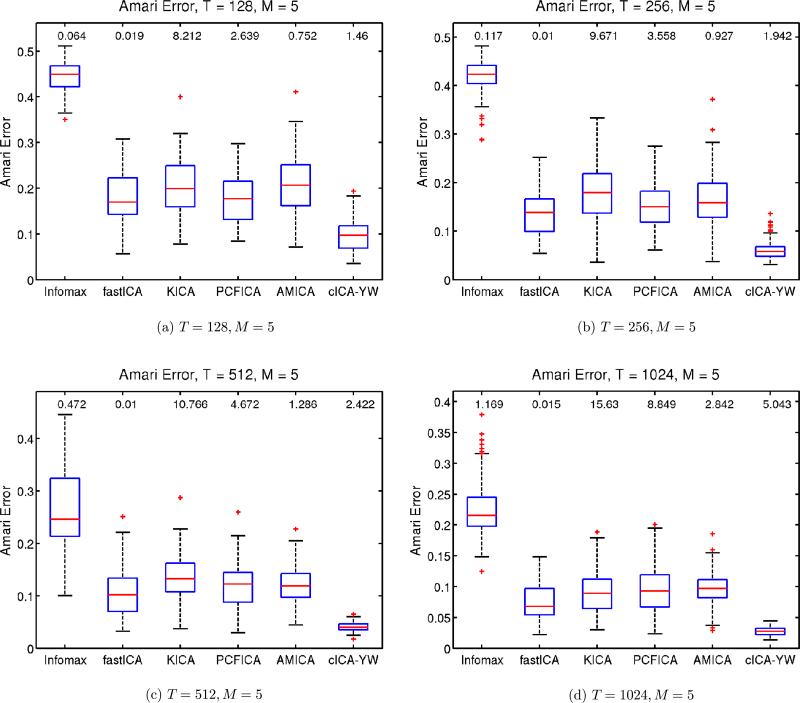
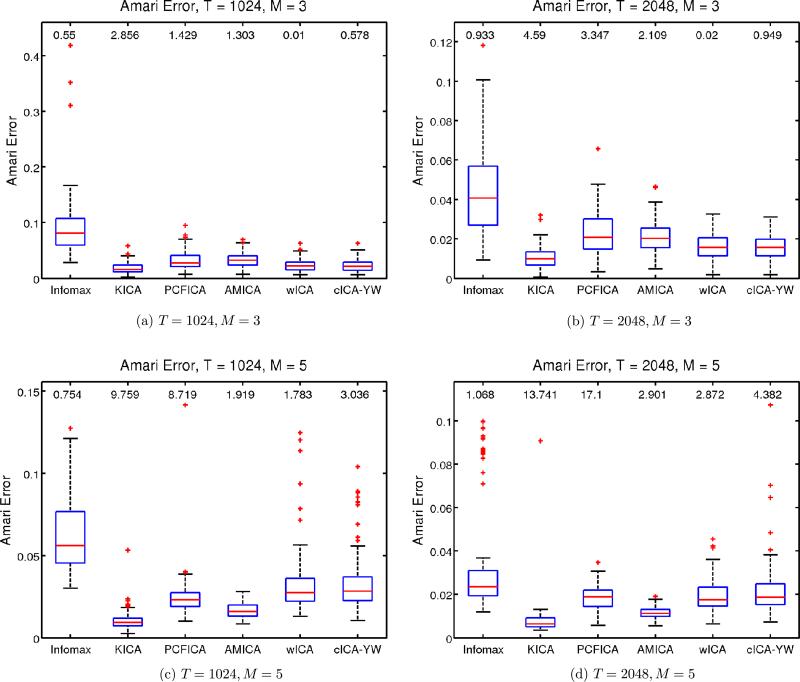
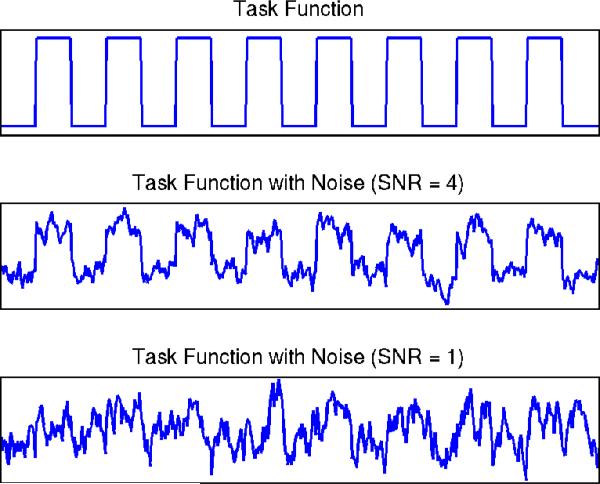
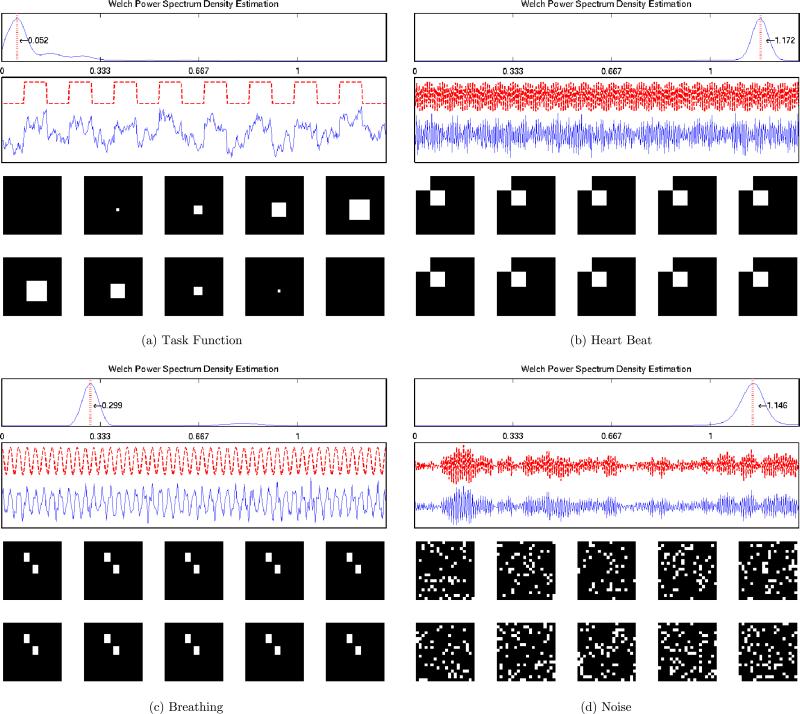
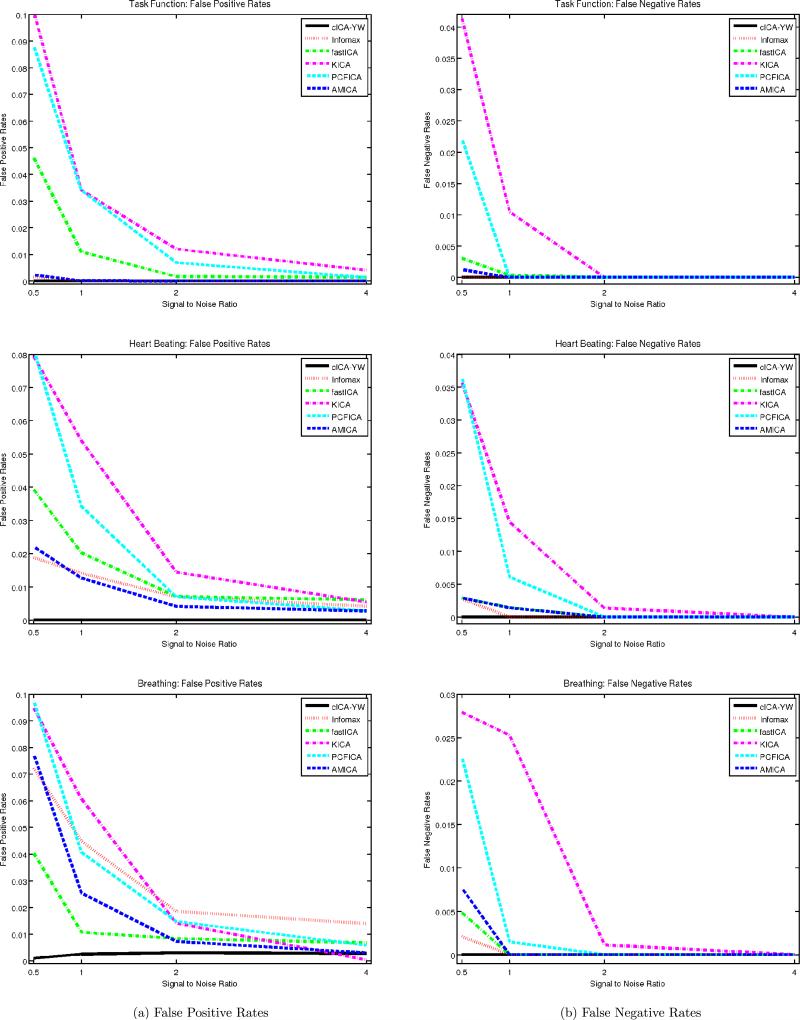
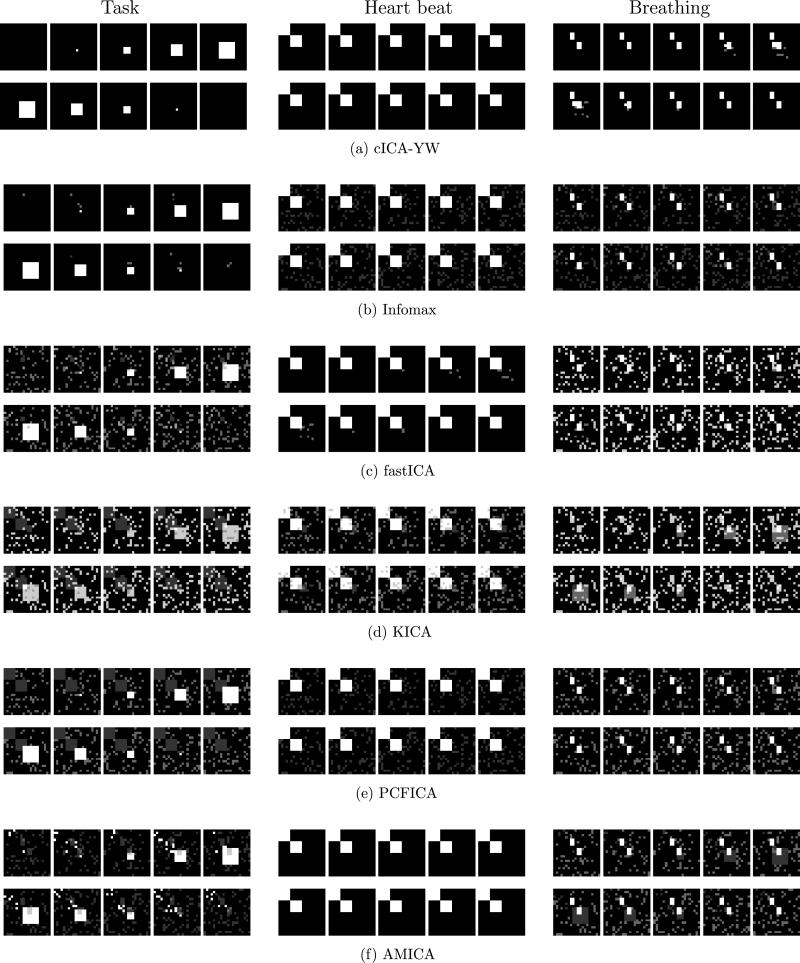
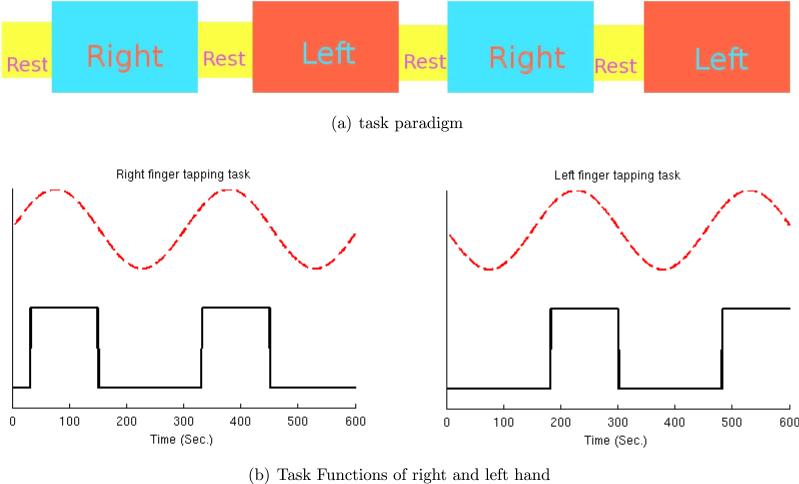
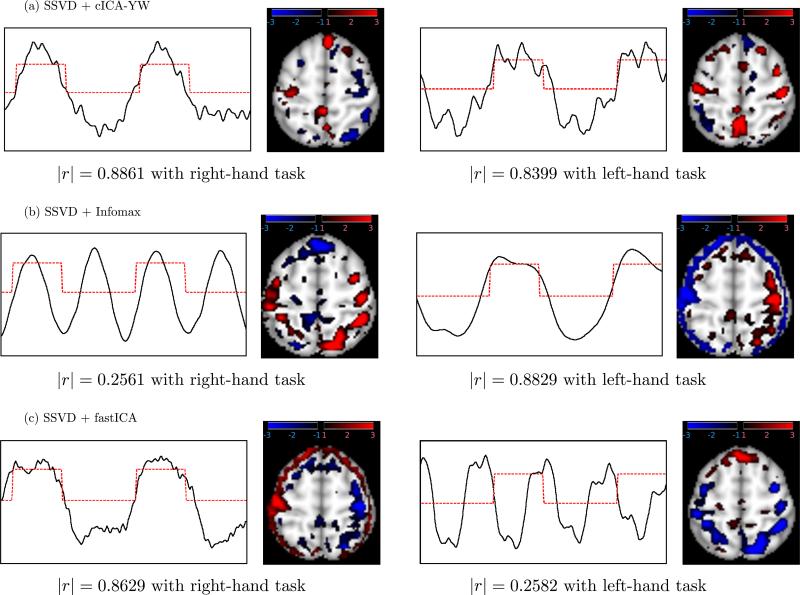
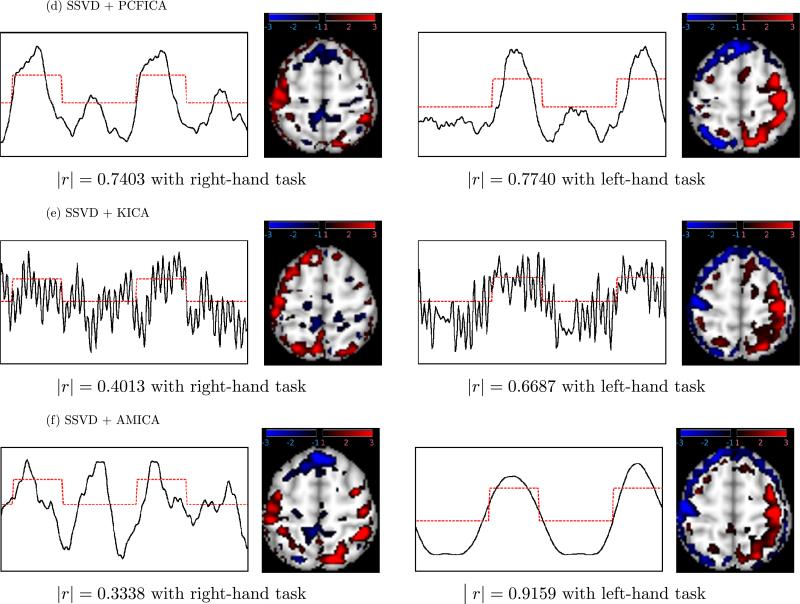
Independent component analysis (ICA) is an effective data-driven method for blind source separation. It has been successfully applied to separate source signals of interest from their mixtures. Most existing ICA procedures are carried out by relying solely on the estimation of the marginal density functions, either parametrically or nonparametrically. In many applications, correlation structures within each source also play an important role besides the marginal distributions. One important example is functional magnetic resonance imaging (fMRI) analysis where the brain-function-related signals are temporally correlated. In this article, we consider a novel approach to ICA that fully exploits the correlation structures within the source signals. Specifically, we propose to estimate the spectral density functions of the source signals instead of their marginal density functions. This is made possible by virtue of the intrinsic relationship between the (unobserved) sources and the (observed) mixed signals. Our methodology is described and implemented using spectral density functions from frequently used time series models such as autoregressive moving average (ARMA) processes. The time series parameters and the mixing matrix are estimated via maximizing the Whittle likelihood function. We illustrate the performance of the proposed method through extensive simulation studies and a real fMRI application. The numerical results indicate that our approach outperforms several popular methods including the most widely used fastICA algorithm. This article has supplementary material online.

Keywords: Blind source separation; Discrete Fourier transform; Spectral analysis; Time series; Whittle likelihood.


Figures

Figure 1
Figure 1
Illustration of ICA in fMRI studies. Simulated fMRI data (left) are modeled as the outer product of three spatial maps and their corresponding temporal components (right). The time series plots of three randomly selected voxels are depicted on the left side of the plot.
Figure 2
Figure 2
Simulation Study I: Performance comparison for ARMA sources. Sample sizes T = 128, 256, 512, 1024. Number of sources M = 5. The boxplots show the Amari error between the true unmixing matrix and the estimated unmixing matrix for the various methods. The median computation time is at the top of the corresponding boxplot. The cICA–YW provides more accurate estimates than its competitors in a fairly short time. Infomax stands for the extended Infomax as described in the text.
Figure 3
Figure 3
Simulation Study II: Performance comparison for white noise sources. Sample sizes T = 1024, 2048. Number of sources M = 3, 5. The boxplots show the Amari error between the true unmixing matrix and the estimated unmixing matrix obtained by various ICA methods. The median computation time of each method is provided on top of the corresponding boxplot. The wICA and cICA–YW provide comparable estimates as the other existing ICA methods. Infomax stands for the extended Infomax as described in the text.
Figure 4
Figure 4
Simulation Study III: Task function at different SNR levels. The online version of this figure is in color.
Figure 5
Figure 5
Simulation Study III: The true independent temporal components, spectral densities and spatial maps. The four temporal signals (task, heartbeat, breathing, and noise) are displayed sequentially from top left to bottom right with the corresponding spatial maps. The activated voxels are colored as white and nonactivated voxels are colored as black.
Figure 6
Figure 6
Simulation Study III: Comparisons of false positive and false negative rates. Four different SNRs are considered. False positive and false negative rates are averaged over 100 simulation runs and displayed at left and right columns respectively. The cICA performs uniformly better than the other five methods.
Figure 7
Figure 7
Simulation Study III: Spatial maps detected by cICA–YW, Infomax, fastICA, KICA, PCFICA, and AMICA under SNR = 1. The average spatial maps (the relative frequency of each voxel detected as activated out of the first five runs) are colored using white (1) to black (0) with gray scale. The cICA–YW detects the spatial activation much better than the other ICA methods.
Figure 8
Figure 8
(a) Experimental paradigm. (b) Task functions for right/left finger-tapping (black solid lines) with task sine curve of main frequency (0.0033 Hz, red dashed lines).
Figure 9
Figure 9
Real fMRI analysis: Temporal independent components (ICs) and corresponding spatial maps for (a) cICA–YW, (b) Infomax, (c) fastICA. The ICs (black solid lines) of the first two components having the largest absolute correlation (indicated) with finger-tapping tasks (red dash lines) are displayed. Activated areas are colored blue–black or red–black gradient in the spatial maps. The comparison (Figures 9 and 10) suggests that cICA–YW can recover the task-related signals of interest more accurately; in addition, it can detect the regions activated by the tasks more sensitively.
Figure 10
Figure 10
Real fMRI analysis: Temporal independent components (ICs) and corresponding spatial maps for (d) PCFICA, (e) KICA, and (f) AMICA. The ICs (black solid lines) of the first two components having the largest absolute correlation (indicated) with finger-tapping tasks (red dash lines) are displayed. Activated areas are colored blue–black or red–black gradient in the spatial maps. The comparison (Figures 9 and 10) suggests that cICA–YW can recover the task-related signals of interest more accurately; in addition, it can detect the regions activated by the tasks more sensitively.

References

    1. Akaike H. A New Look at the Statistical Model Identification. IEEE Transactions on Automatic Control. 1974;19:716–723. [1013]
    1. Amari S. Natural Gradient Learning for Over and Under Complete Bases in ICA. Neural Computation. 1999;11:1875–1883. [1012] - PubMed
    1. Amari S, Cichocki A, Yang H, et al. A New Learning Algorithm for Blind Signal Separation. Advances in Neural Information Processing Systems. 1996;8:757–763. [1013]
    1. Bach F, Jordan M. Kernel Independent Component Analysis. Journal of Machine Learning Research. 2003;3:1–48. [1009,1013,1014]
    1. Bai P, Shen H, Huang X, Truong Y. A Supervised Singular Value Decomposition for Independent Component Analysis of fMRI. Statistica Sinica. 2008;18:1233–1252. [1020]

LinkOut - more resources