

Surgical Guidance via Multiplexed Molecular Imaging of Fresh Tissues Labeled with SERS-Coded Nanoparticles
- PMID: 27524875
- PMCID: PMC4978138
- DOI: 10.1109/JSTQE.2015.2507358
Surgical Guidance via Multiplexed Molecular Imaging of Fresh Tissues Labeled with SERS-Coded Nanoparticles
Abstract
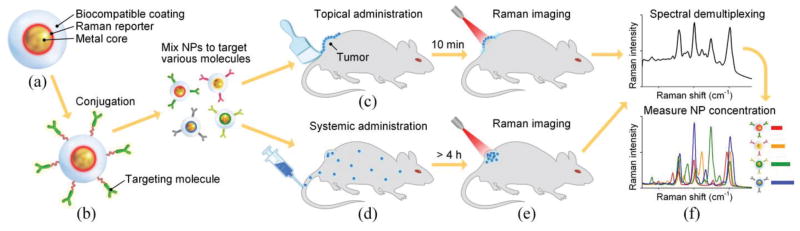
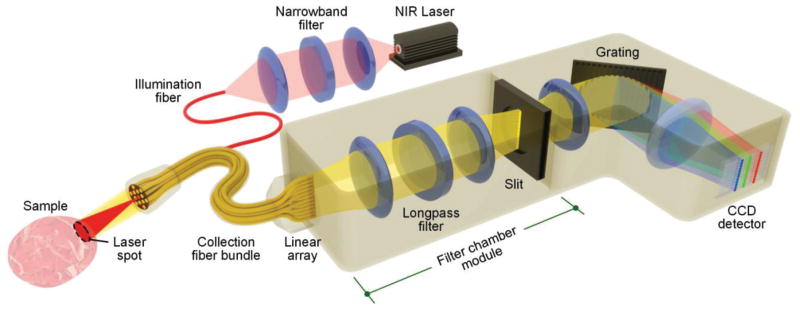
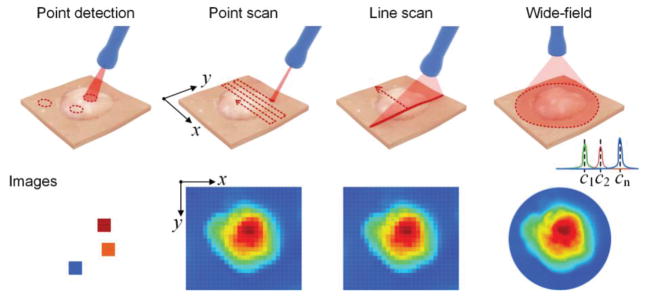
The imaging of dysregulated cell-surface receptors (or biomarkers) is a potential means of identifying the presence of cancer with high sensitivity and specificity. However, due to heterogeneities in the expression of protein biomarkers in tumors, molecular imaging technologies should ideally be capable of visualizing a multiplexed panel of cancer biomarkers. Recently, surface-enhanced Raman-scattering (SERS) nanoparticles (NPs) have attracted wide interest due to their potential for sensitive and multiplexed biomarker detection. In this review, we focus on the most recent advances in tumor imaging using SERS-coded NPs. A brief introduction of the structure and optical properties of SERS NPs is provided, followed by a detailed discussion of key imaging issues such as the administration of NPs in tissue (topical versus systemic), the optical configuration and imaging approach of Raman imaging systems, spectral demultiplexing methods for quantifying NP concentrations, and the disambiguation of specific vs. nonspecific sources of contrast through ratiometric imaging of targeted and untargeted (control) NP pairs. Finally, future challenges and directions are briefly outlined.
Keywords: Raman spectroscopy; biomarkers; biomedical optical imaging; cancer detection; fiberoptic probes; molecular imaging; nanomedicine; tumors.
Figures


Similar articles
-
Multiplexed Molecular Imaging of Fresh Tissue Surfaces Enabled by Convection-Enhanced Topical Staining with SERS-Coded Nanoparticles.Small. 2016 Oct;12(40):5612-5621. doi: 10.1002/smll.201601829. Epub 2016 Aug 29. Small. 2016. PMID: 27571395 Free PMC article.
-
Multiplexed Molecular Imaging of Biomarker-Targeted SERS Nanoparticles on Fresh Tissue Specimens with Channel-Compressed Spectrometry.PLoS One. 2016 Sep 29;11(9):e0163473. doi: 10.1371/journal.pone.0163473. eCollection 2016. PLoS One. 2016. PMID: 27685991 Free PMC article.
-
Quantitative molecular phenotyping with topically applied SERS nanoparticles for intraoperative guidance of breast cancer lumpectomy.Sci Rep. 2016 Feb 16;6:21242. doi: 10.1038/srep21242. Sci Rep. 2016. PMID: 26878888 Free PMC article.
-
Multiplexed Optical Imaging of Tumor-Directed Nanoparticles: A Review of Imaging Systems and Approaches.Nanotheranostics. 2017 Aug 19;1(4):369-388. doi: 10.7150/ntno.21136. eCollection 2017. Nanotheranostics. 2017. PMID: 29071200 Free PMC article. Review.
-
Advances in Surface Enhanced Raman Spectroscopy for in Vivo Imaging in Oncology.Nanotheranostics. 2022 Jan 1;6(1):31-49. doi: 10.7150/ntno.62970. eCollection 2022. Nanotheranostics. 2022. PMID: 34976579 Free PMC article. Review.
Cited by
-
Microscopic investigation of" topically applied nanoparticles for molecular imaging of fresh tissue surfaces.J Biophotonics. 2018 Apr;11(4):e201700246. doi: 10.1002/jbio.201700246. Epub 2018 Jan 29. J Biophotonics. 2018. PMID: 29227576 Free PMC article.
-
Multiplexed Molecular Imaging of Fresh Tissue Surfaces Enabled by Convection-Enhanced Topical Staining with SERS-Coded Nanoparticles.Small. 2016 Oct;12(40):5612-5621. doi: 10.1002/smll.201601829. Epub 2016 Aug 29. Small. 2016. PMID: 27571395 Free PMC article.
-
A Raman Imaging Approach Using CD47 Antibody-Labeled SERS Nanoparticles for Identifying Breast Cancer and Its Potential to Guide Surgical Resection.Nanomaterials (Basel). 2018 Nov 20;8(11):953. doi: 10.3390/nano8110953. Nanomaterials (Basel). 2018. PMID: 30463284 Free PMC article.
-
Image-guided tumor surgery: The emerging role of nanotechnology.Wiley Interdiscip Rev Nanomed Nanobiotechnol. 2020 Jul;12(4):e1624. doi: 10.1002/wnan.1624. Epub 2020 Mar 11. Wiley Interdiscip Rev Nanomed Nanobiotechnol. 2020. PMID: 32162485 Free PMC article. Review.
-
Rapid pathology of lumpectomy margins with open-top light-sheet (OTLS) microscopy.Biomed Opt Express. 2019 Feb 19;10(3):1257-1272. doi: 10.1364/BOE.10.001257. eCollection 2019 Mar 1. Biomed Opt Express. 2019. PMID: 30891344 Free PMC article.
References
-
- Parkin DM, Bray F, Ferlay J, Pisani P. Estimating the world cancer burden: Globocan 2000. International journal of cancer. 2001;94:153–156. - PubMed
-
- Levin B, Lieberman DA, McFarland B, Smith RA, Brooks D, Andrews KS, et al. Screening and surveillance for the early detection of colorectal cancer and adenomatous polyps, 2008: a joint guideline from the American Cancer Society, the US Multi-Society Task Force on Colorectal Cancer, and the American College of Radiology. CA Cancer J Clin. 2008;58:130–60. - PubMed
-
- Bergholt MS, Zheng W, Lin K, Ho KY, Teh M, Yeoh KG, et al. Characterizing variability in in vivo Raman spectra of different anatomical locations in the upper gastrointestinal tract toward cancer detection. Journal of Biomedical Optics. 2011;16:037003–10. - PubMed
-
- van Dam GM, Themelis G, Crane LM, Harlaar NJ, Pleijhuis RG, Kelder W, et al. Intraoperative tumor-specific fluorescence imaging in ovarian cancer by folate receptor-[alpha] targeting: first in-human results. Nature medicine. 2011;17:1315–1319. - PubMed
Grants and funding
LinkOut - more resources
Full Text Sources
Other Literature Sources
Miscellaneous