. 2016 Apr;6(2):269.
doi: 10.4172/2161-0681.1000269. Epub 2016 Apr 17.

Tobacco Smoke-Induced Hepatic Injury with Steatosis, Inflammation, and Impairments in Insulin and Insulin-Like Growth Factor Signaling

Affiliations

Tobacco Smoke-Induced Hepatic Injury with Steatosis, Inflammation, and Impairments in Insulin and Insulin-Like Growth Factor Signaling

Suzanne M de la Monte et al. J Clin Exp Pathol. 2016 Apr.

Abstract

Background: Alcoholic liver disease (ALD) is associated with impairments in hepatic insulin and insulin-like growth factor (IGF) signaling through cell growth, survival, and metabolic pathways. Since not all heavy drinkers develop ALD, co-factors may be important. Epidemiologic data indicate that most heavy drinkers smoke tobacco and experimental data revealed that low-level nitrosamine exposures, including those from tobacco, can cause steatohepatitis with hepatic insulin/IGF resistance and exacerbate ALD. We hypothesize that cigarette smoke (CS) exposures also cause liver injury with impaired hepatic insulin/IGF signaling, and thereby contribute to ALD.

Methods: Adult male A/J mice were exposed to air for 8 weeks (A8), CS for 4 (CS4) or 8 (CS8) weeks, or CS for 8 weeks with 2 weeks recovery (CS8+R).

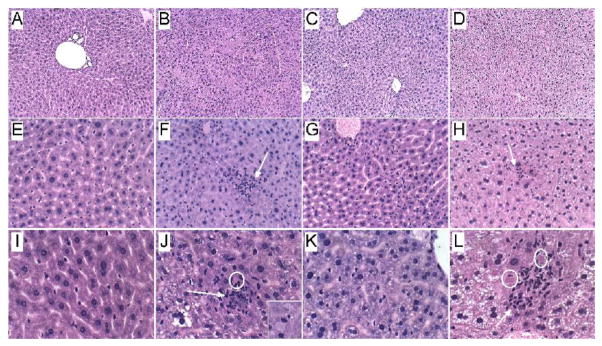
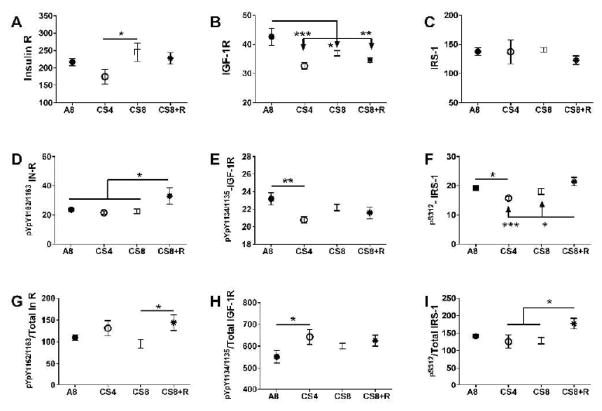
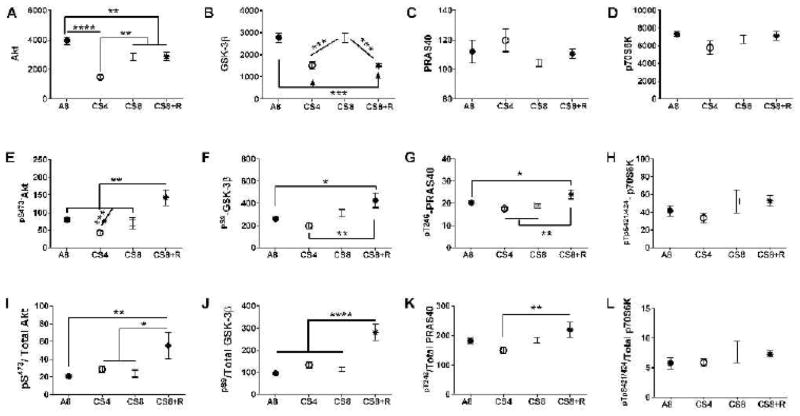
Results: CS exposures caused progressive liver injury with disruption of the normal hepatic chord architecture, lobular inflammation, apoptosis or necrosis, micro-steatosis, sinusoidal dilatation, and nuclear pleomorphism. Histopathological liver injury scores increased significantly from A8 to CS4 and then further to CS8 (P<0.0001). The mean histological grade was also higher in CS8+R relative to A8 (P<0.0001) but lower than in CS4, reflecting partial resolution of injury by CS withdrawal. CS exposures impaired insulin and IGF-1 signaling through IRS-1, Akt, GSK-3β, and PRAS40. Livers from CS8+R mice had normalized or elevated levels of insulin receptor, pYpY-Insulin-R, 312S-IRS-1, 473S-Akt, S9-GSK-3β, and pT246-PRAS40 relative to A8, CS4, or CS8, reflecting partial recovery.

Conclusion: CS-mediated liver injury and steatohepatitis with impairments in insulin/IGF signalling are reminiscent of the findings in ALD. Therefore, CS exposures (either first or second-hand) may serve as a co-factor in ALD. The persistence of several abnormalities following CS exposure cessation suggests that some aspects of CS-mediated hepatic metabolic dysfunction are not readily reversible.

Keywords: Cigarette smoke; Insulin signaling; Mouse model; Steatohepatitis; Tobacco.


Figures

Figure 1
Figure 1
CS exposures alter hepatic architecture. Formalin-fixed, paraffin-embedded histological sections were stained with H&E to compare effects of CS exposures and withdrawal.
Figure 2
Figure 2
CS-induced lipid accumulation in hepatocytes. Cryostat sections of liver were stained with Oil Red O to detect neutral lipid (red droplets). Note minimal lipid accumulation in (A) control relative to (B) CS4. (C, D) Oil Red O staining is more diffuse and lower in density but coarser in quality (insets) after 8 weeks of CS exposure, with or without recovery. (Original magnification, 400x).
Figure 3
Figure 3
Hepatic triglyceride and cholesterol measurements. A) Triglyceride and B) cholesterol levels were measured using Analox reagents. Results were normalized to sample protein content. Inter-group differences were compared by one-way ANOVA with the Tukey post-test.
Figure 4
Figure 4
Comparative effects of CS exposures and withdrawal on liver histopathological scores. H&E stained sections of liver were scored (0–3) under code with respect to the extent or severity of: loss of the hepatic chord-like architecture (CHORD), lobular inflammation (INFLAM), microsteatosis (STEAT), chickenwire fibrosis (FIBROS), hepatocyte nuclear pleomorphism (PLEOM), apoptosis or councilman bodies (APOP), sinusoidal dilatation (SINUSOID), and foci of necrosis (NECR). In addition, the mean total scores (TOTAL) per sample were compared across the groups. Inter-group comparisons were made by 2-way ANOVA with post-hoc Tukey multiple comparison test. (*P<0.05; **P<0.01; ***P<0.001; ****P<0.0001).
Figure 5
Figure 5
Effects of CS on insulin/IGF/IRS signaling-related gene expression. RNA was reverse transcribed and the cDNAs were used in duplex qPCR reactions to measure A) insulin, B) IGF-1, C) IGF-2, D) insulin receptor, E) IGF-1 receptor, F) IGF-2 receptor, G) IRS-1, H) IRS-2, and I) IRS-4 mRNA transcripts with gene expression normalized to simultaneously measured β-actin. Data were analyzed by 1-way ANOVA (Table 1) and the post-hoc Tukey multiple comparison test (*P<0.05; **P<0.01, ξ − 0.05
Figure 6
Figure 6
CS exposure alters insulin/IGF-IRS-1 signaling. Liver protein homogenates were used in bead-based multiplex ELISAs to measure immunoreactivity to: A) insulin receptor (R), B) IGF-1R, C) IRS-1, D) pYpY1162/1163-InsR, E) pYpY1135/1136-IGF-1R, and F) pS312-IRS-1. Relative phosphorylation is represented by the calculated ratios of: G) pYpY1162/1163-/total Insulin R, H) pYpY1135/1136-/total IGF-1R, and I) pS312-/total IRS-1. Inter-group comparisons were made by 1-way ANOVA tests (Table 1). Post-hoc Tukey multiple comparison test results are depicted in the graphs (*P<0.05; **P<0.01; ***P<0.001).
Figure 7
Figure 7
CS exposure effects on Akt pathways. Liver protein homogenates were used in bead-based multiplex ELISAs to measure immunoreactivity to: A) Akt, B) GSK-3β, C) PRAS40, D) p70S6K, E) pS473 AKT, F) pS9-GSK-3β, G) pT246-PRAS-40, and H) pTpS421/424-p70S6K. Relative phosphorylation is represented by the calculated ratios of: I) pS473-/total AKT, J) pS9-/total GSK-3β, K) pT246-/total PRAS40, and L) pTpS421/424-/total p70S6K. Data were analyzed by 1-way ANOVA (Table 1). Post-hoc Tukey multiple comparison test results are depicted in the graphs (*P<0.05; **P<0.01; ***P<0.001; ****P<0.0001).

Similar articles

Cited by

References

    1. Paula H, Asrani SK, Boetticher NC, Pedersen R, Shah VH, et al. Alcoholic liver disease-related mortality in the United States: 1980–2003. Am J Gastroenterol. 2010;105:1782–1787. - PMC - PubMed
    1. Serdula MK, Brewer RD, Gillespie C, Denny CH, Mokdad A. Trends in alcohol use and binge drinking, 1985–1999: results of a multistate survey. Am J Prev Med. 2004;26:294–298. - PubMed
    1. Mokdad AH, Giles WH, Bowman BA, Mensah GA, Ford ES, et al. Changes in health behaviors among older Americans, 1990 to 2000. Public Health Rep. 2004;119:356–361. - PMC - PubMed
    1. Centers for Disease Control and Prevention (CDC) Alcohol-attributable deaths and years of potential life lost among American Indians and Alaska Natives--United States, 2001–2005. MMWR Morb Mortal Wkly Rep. 2008;57:938–941. - PubMed
    1. Miller AM, Horiguchi N, Jeong WI, Radaeva S, Gao B. Molecular mechanisms of alcoholic liver disease: innate immunity and cytokines. Alcohol Clin Exp Res. 2011;35:787–793. - PMC - PubMed

LinkOut - more resources