. 2016 Oct;17(10):1226-34.
doi: 10.1038/ni.3533. Epub 2016 Aug 15.

Defining antigen-specific plasmablast and memory B cell subsets in human blood after viral infection or vaccination

Affiliations

Defining antigen-specific plasmablast and memory B cell subsets in human blood after viral infection or vaccination

Ali H Ellebedy et al. Nat Immunol. 2016 Oct.

Abstract

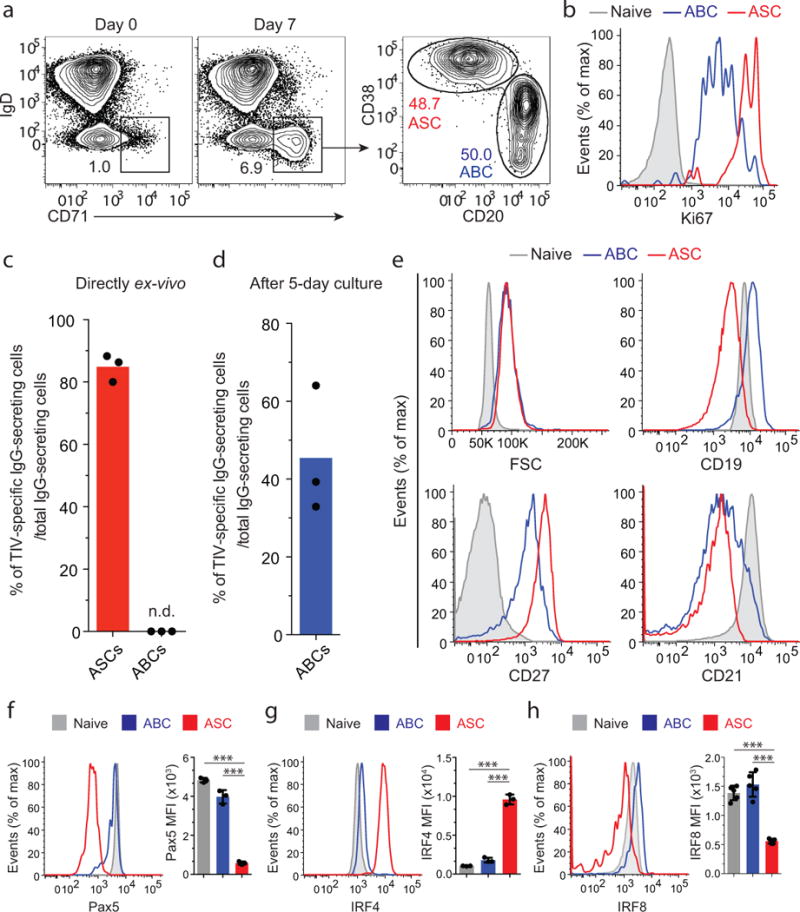
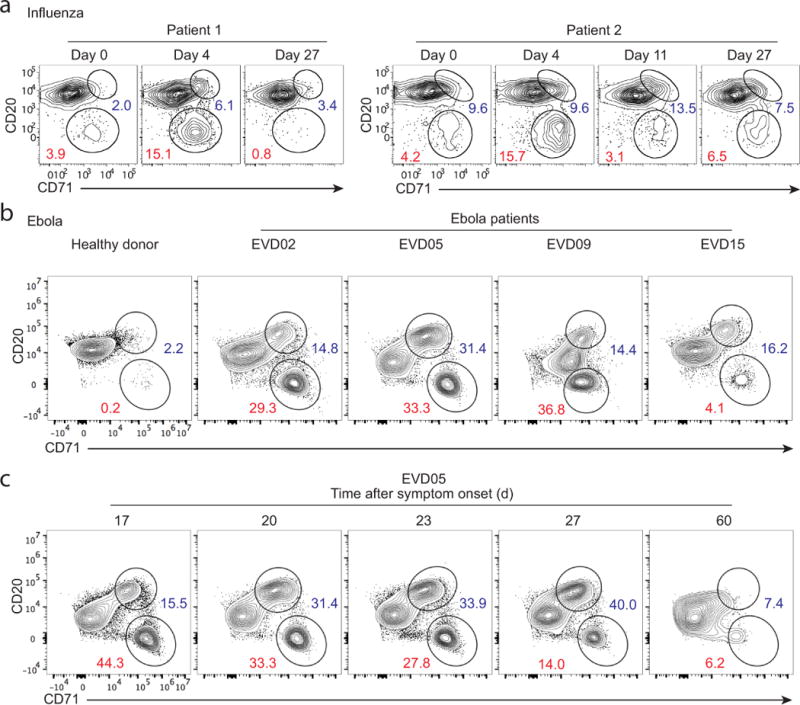
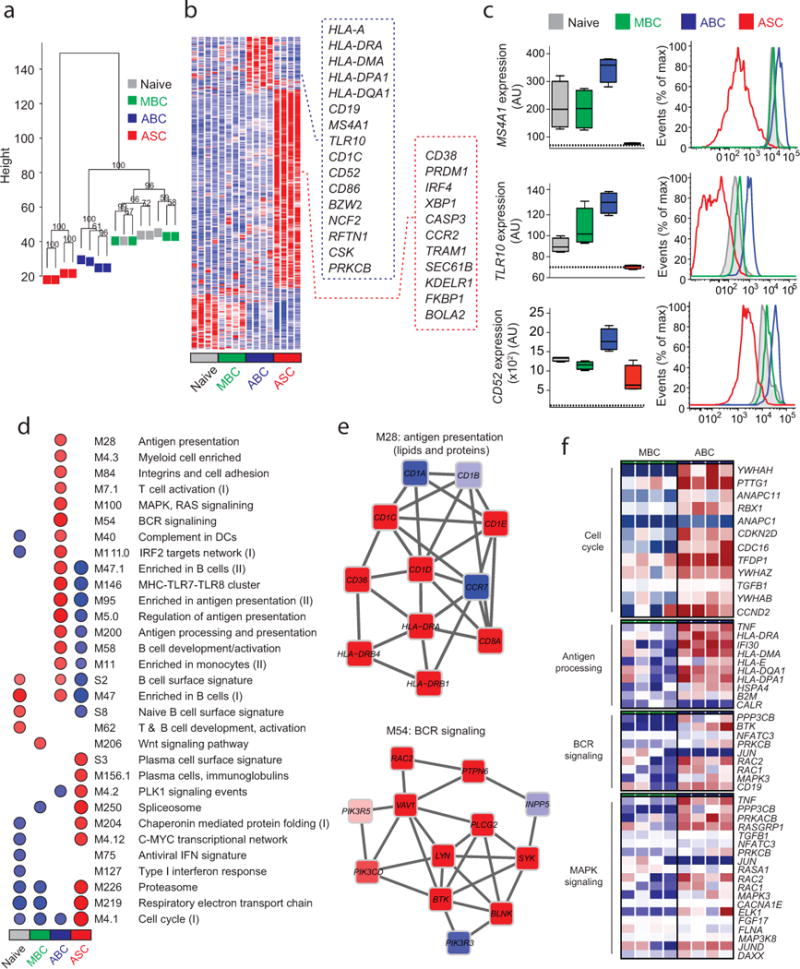
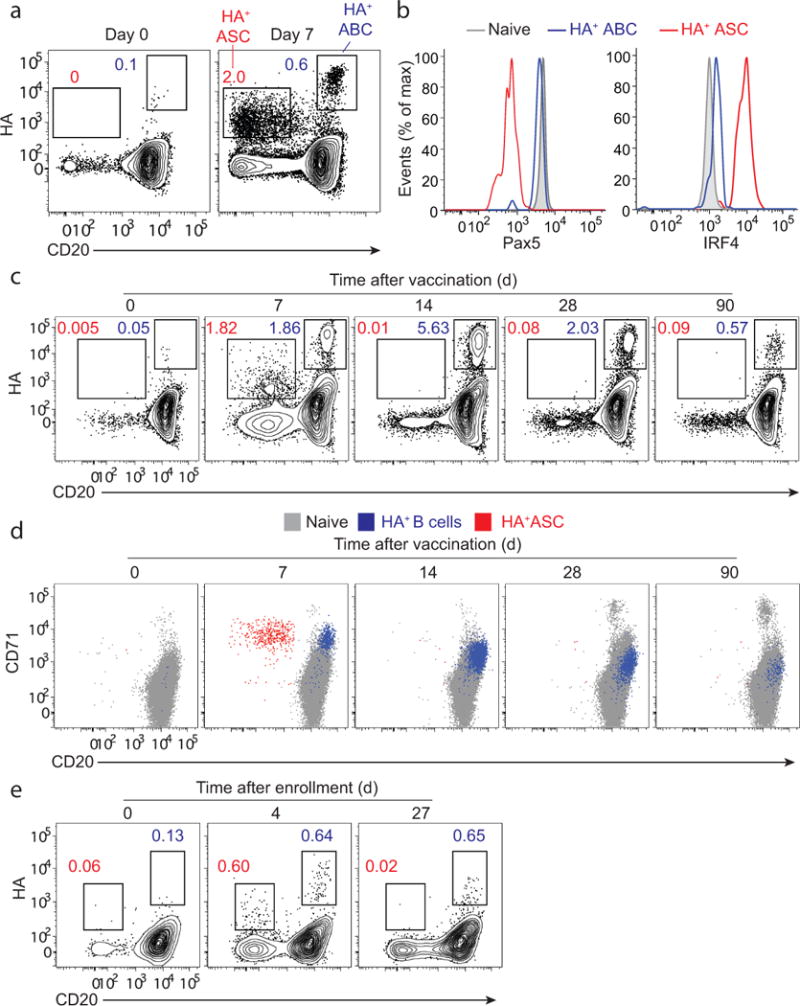
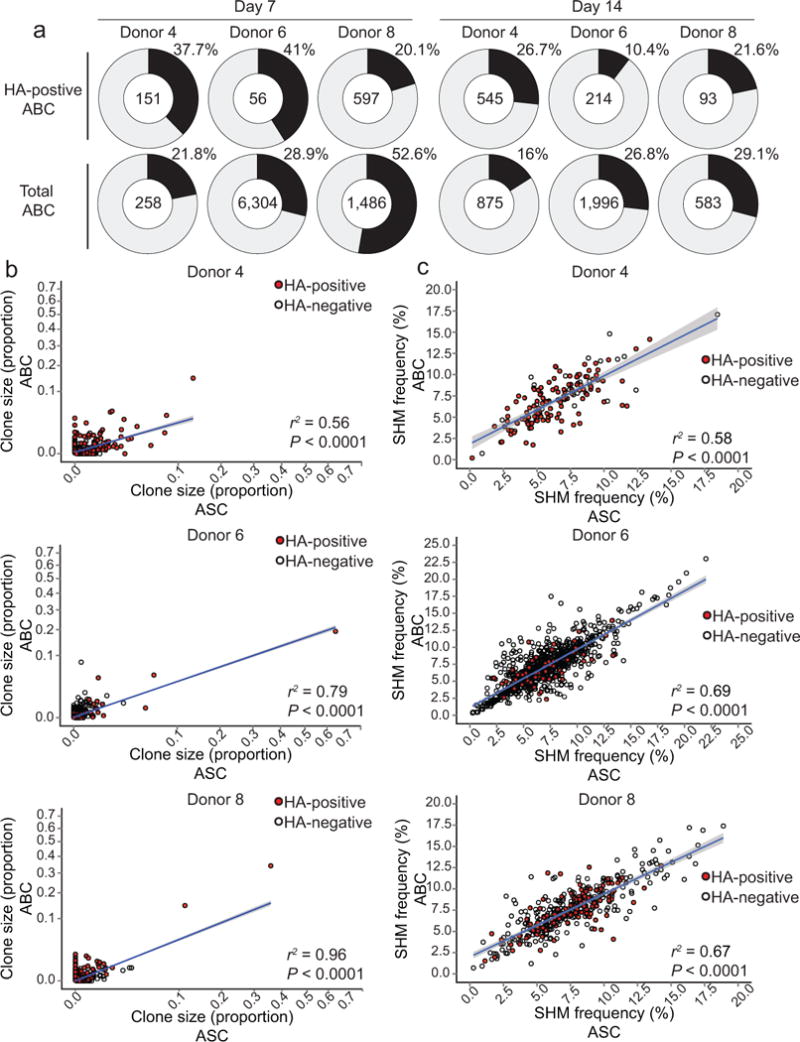
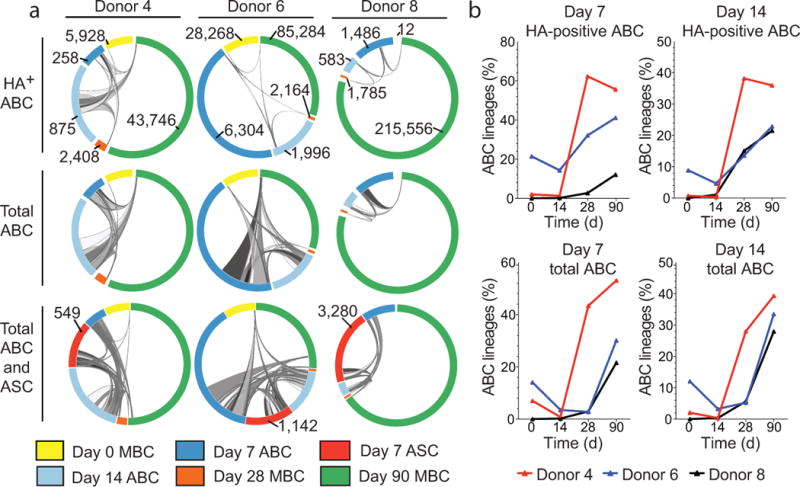
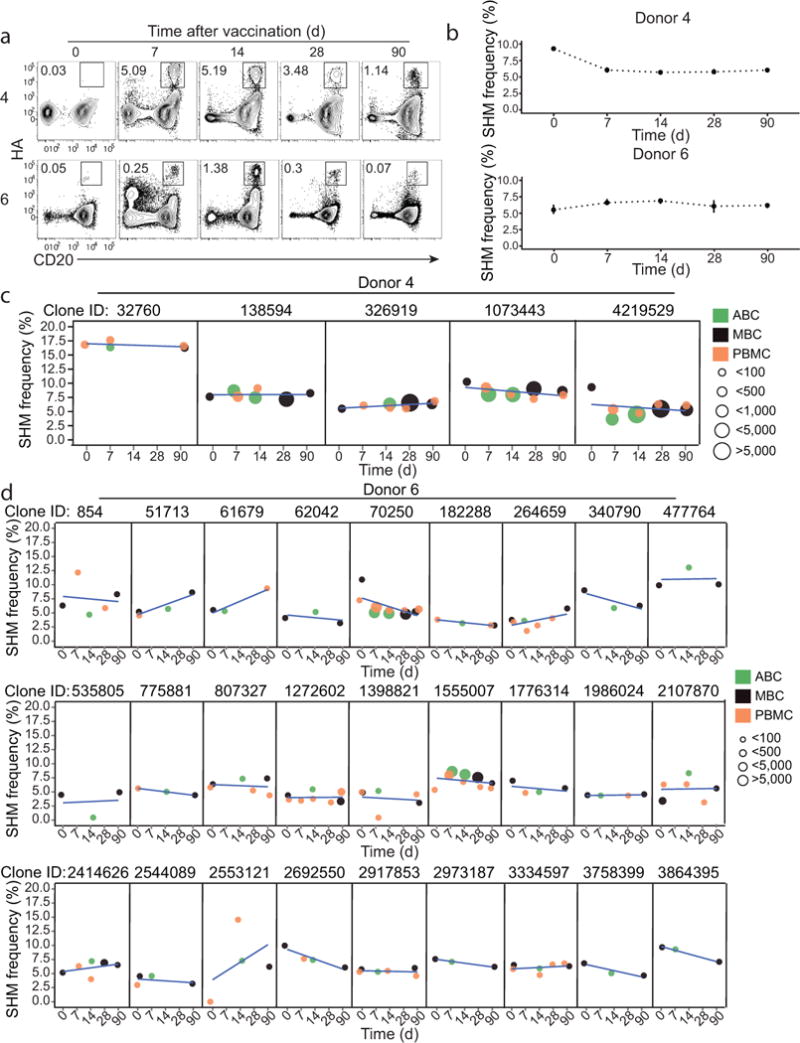
Antigen-specific B cells bifurcate into antibody-secreting cells (ASCs) and memory B cells (MBCs) after infection or vaccination. ASCs (plasmablasts) have been extensively studied in humans, but less is known about B cells that become activated but do not differentiate into plasmablasts. Here we have defined the phenotype and transcriptional program of a subset of antigen-specific B cells, which we have called 'activated B cells' (ABCs), that were distinct from ASCs and were committed to the MBC lineage. We detected ABCs in humans after infection with Ebola virus or influenza virus and also after vaccination. By simultaneously analyzing antigen-specific ASCs and ABCs in human blood after vaccination against influenza virus, we investigated the clonal overlap and extent of somatic hypermutation (SHM) in the ASC (effector) and ABC (memory) lineages. Longitudinal tracking of vaccination-induced hemagglutinin (HA)-specific clones revealed no overall increase in SHM over time, which suggested that repeated annual immunization might have limitations in enhancing the quality of influenza-virus-specific antibody.


Conflict of interest statement

The authors declare no competing financial interests.

Figures

Figure 1
Figure 1. Identification of antigen-specific ABCs and ASCs in peripheral blood after influenza vaccination in humans
PBMCs isolated prior to- and seven days after immunization with the inactivated 2013/14 seasonal influenza vaccine (TIV). (a) A flow cytometry plot showing the gating strategy used to identify ABCs within B cells (CD3CD14CD16CD19+). CD38int-lo CD20hi fraction of the IgD CD71hi population represents ABCs. The CD38hi CD20 fraction represents the ASC subset. (b) Expression of the intracellular proliferation marker Ki67 as measured by flow cytometry in ABCs (blue), ASCs (red) and naïve B cells (grey). (c) Ex-vivo ELISPOT assay of day 7 ASCs. Mean percentages of TIV-specific IgG-secreting ASCs is shown (n = 3). N.D., not detectable. (d) Mean percentage of TIV-specific day 7 IgG-secreting ABCs (detected by ELISPOT) is shown (n = 3). ABCs were cultured for five days (see Methods) and then added on plates coated with either the TIV antigen or anti-human IgG. (e) Histogram plots showing the differences in forward scatter (FSC) and expression of CD19, CD27, and CD21 among ABCs (blue), ASCs (red) and naïve B cells (grey). (f-h) Expression of Pax5 (f), IRF4 (g) and IRF8 (h) in ABCs, ASCs and naïve B cells. Bar graphs show the mean of Pax5, IRF8 and IRF4 MFI in the three populations (n = 3). *** = p<0.0001. p<0.0001 (unpaired t-test (f–h)). Data represent at least two independent experiments.
Figure 2
Figure 2. Identification of ABC and ASC B cell subsets in blood after human influenza and Ebola virus infections
(a) PBMCs taken from two H1N1-infected patients at the day of admission (day 0) as well as days 4, 11 and 27 after enrollment. FACS plots gated on isotype-switched B cells showing ABCs (CD20hi CD71hi) and ASCs (CD20lo CD71hi). (b) Whole blood samples were collected from a healthy donor and from four Ebola virus-infected patients, EVD02, EVD05, EVD09 and EVD15. FACS plots from the healthy donor and an acute phase time point (~2–3 weeks after symptom onset) for each patient are depicted. Gated on CD19+ cells. (c) FACS plots of blood samples from EVD05 showing the kinetics of ABCs and ASCs at different days after symptom onset.
Figure 3
Figure 3. Gene expression array analysis of ABCs, ASCs, MBCs and Naïve B cells
(a) Unsupervised cluster analysis using the top 15,000 probes with highest variance across all samples. Multiscale bootstrap resampling was used to calculate the “approximately unbiased” p-values for each branch (numbers in black, %). (b) Heat map of gene signatures of the four B cell subsets. Expression of genes (in rows), which were highly expressed in one subset is represented by the number of standard deviations above (red) or below (blue) the average value for that gene across all samples (in columns). Squares with dashed lines show selected genes highly expressed in ABCs (blue) and ASCs (red). (c) Box plots showing expression of MS4A1, TLR10 and CD52 in the four B cell subsets. Histogram plots showing surface protein expression of CD20, TLR10 and CD52 on the indicated B cell subsets. (d) GSEA analysis showing the Blood Transcription Modules whose expression activity is higher (red) or lower (blue) in one B cell subset compared to others (nominal p-value < 0.01, see methods). Circle size (“corrplot” R package) is proportional to the nominal enrichment score (NES). (e) Genes in BTMs M28 and M54; each ‘edge’ (gray line) represents a coexpression relationship, as described in 1 colors represent the mean Z score for ABC samples (red = higher and blue = lower expression on ABCs compared to others). (f) A heat map showing fold increase (red) or decrease (blue) in gene expression between the ABCs and MBCs for selected pathways.
Figure 4
Figure 4. HA labeling of ABCs and ASCs in blood after influenza vaccination and infection
PBMCs isolated from healthy adult volunteers prior to, and 7, 14, 30 and 90 days after immunization with the 2013/14 TIV. (a) A FACS plot gated on isotype-switched B cells showing HA-positive ASCs (CD20lo) and HA-positive ABCs (CD20hi). (b) Histogram plots showing expression of Pax5 and IRF4 in HA-positive ABCs, HA-positive ASCs, and naïve B cells. (c) A FACS plot (gated on isotype-switched B cells) showing the kinetics of HA-positive B cells after TIV immunization. (d) A FACS plot showing CD71 expression on HA-positive ASCs (red dots) and HA-positive ABCs/MBCs (blue dots) overlaid over naïve B cells (grey dots) (e) PBMCs isolated from an influenza-infected patient. FACS plots gated on isotype-switched B cells showing HA-positive ASCs (CD20lo) and HA-positive ABCs (CD20hi) at days 0, 4 and 27 after enrollment.
Figure 5
Figure 5. Comparing the B cell repertoires of ABCs and ASCs isolated after seasonal influenza vaccination
(a) Pie charts show the percentage of HA-positive (2009 pandemic H1N1 HA) ABC (top) or total ABC (bottom) clonal lineages that were detectable in the IgG+ ASC compartment. The upper right segment of each pie is the percentage of ABC lineages, and the center indicates the total number of clonal lineages. (b) Correlation between clonal lineage size in IgG+ ASCs (day 7 post-TIV vaccination) and total ABCs (days 7 and 14 post-vaccination). (c) Correlation between the mean IGHV SHM frequency of IgG+ ASC clonal lineages (day 7 post-TIV vaccination) and total ABCs (days 7 and 14 post-vaccination). Each circle represents a clonal lineage; red-filled circles indicate HA-positive clonal lineages and unfilled circles indicate HA-negative lineages. Linear model regression lines are plotted in blue with standard error shaded in grey, and the coefficient of determination for the linear model (r2) and P-values are shown.
Figure 6
Figure 6. B cell repertoire sequencing of ABC, ASC and resting MBC lineages isolated before and after seasonal TIV
(a) Clonal lineages shared between ABC, or ASC and pre- and post-vaccination MBC pools are indicated by ribbons linking arcs. Ribbon width represents the number of clonal lineages shared between subsets. The total number of clonal lineages for each subset is labeled and the arc color indicates the B cell subset and time point as specified in the legend. ABC and ASC arcs are zoomed 50X. (b) Percentage of ABC clonal lineages identified at either day 7 or day 14 post-vaccination that are also detected among resting MBC populations pre- or post-seasonal TIV.
Figure 7
Figure 7. IGH SHM frequencies of ABC lineages
(a) Representative FACS plots (gated on isotype-switched B cells) showing the kinetics of HA-positive ABC/memory B cells following immunization with the 2014/15 TIV vaccine. PBMCs isolated at days 0, 7 14, 30 and 90 after vaccination are shown. (b) Longitudinal SHM frequencies of B cell clonal lineages that included HA-positive ABC members at day 14 post-vaccination with TIV during the 2014–15 season. Each point summarizes the median of the mean lineage IGHV SMH frequencies and bars show the 95% confidence interval. (c–d) Each panel represents the mean IGHV SHM frequency for different cell subsets and time points for individual clonal lineages from donor 4 (c) and donor 6 (d). The point color indicates the B cell subset and the point size indicates the number of sequencing reads for the lineage at a given time point. Linear regression lines are shown in blue.

References

    1. Tangye SG, Tarlinton DM. Memory B cells: effectors of long-lived immune responses. Eur J Immunol. 2009;39:2065–2075. - PubMed
    1. McHeyzer-Williams M, Okitsu S, Wang N, McHeyzer-Williams L. Molecular programming of B cell memory. Nat Rev Immunol. 2012;12:24–34. - PMC - PubMed
    1. Singh H, Khan AA, Dinner AR. Gene regulatory networks in the immune system. Trends Immunol. 2014;35:211–218. - PubMed
    1. Wrammert J, et al. Broadly cross-reactive antibodies dominate the human B cell response against 2009 pandemic H1N1 influenza virus infection. J Exp Med. 2011;208:181–193. - PMC - PubMed
    1. Wrammert J, et al. Rapid and massive virus-specific plasmablast responses during acute dengue virus infection in humans. J Virol. 2012;86:2911–2918. - PMC - PubMed

Publication types

MeSH terms

Substances