. 2016 Aug 15:5:e18311.
doi: 10.7554/eLife.18311.

A systematic view on influenza induced host shutoff

Affiliations

A systematic view on influenza induced host shutoff

Adi Bercovich-Kinori et al. Elife. .

Abstract

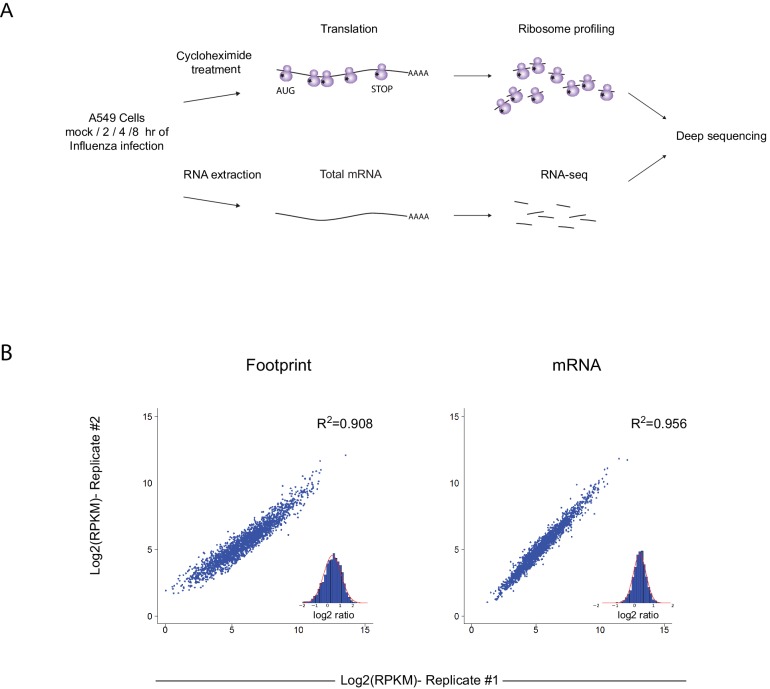
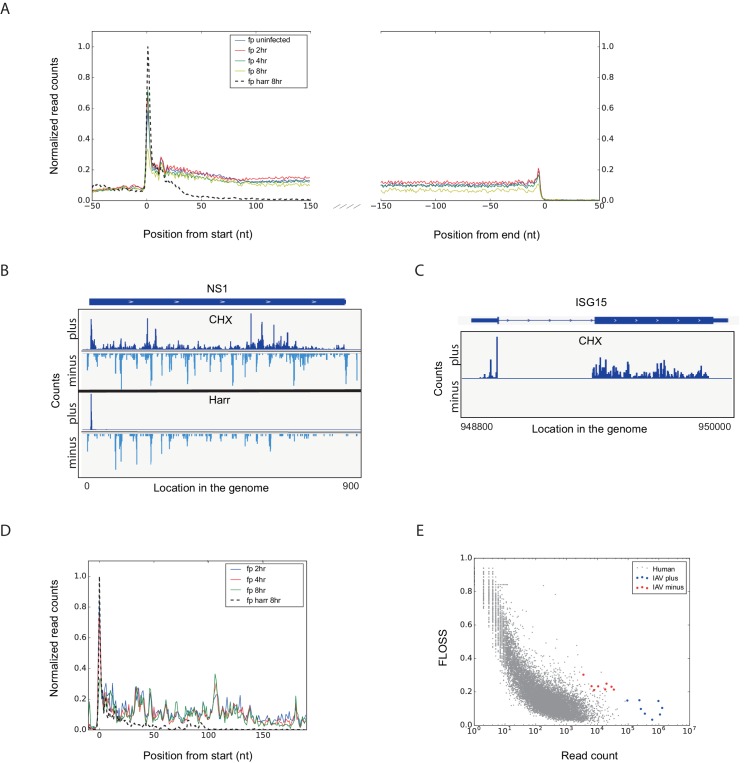
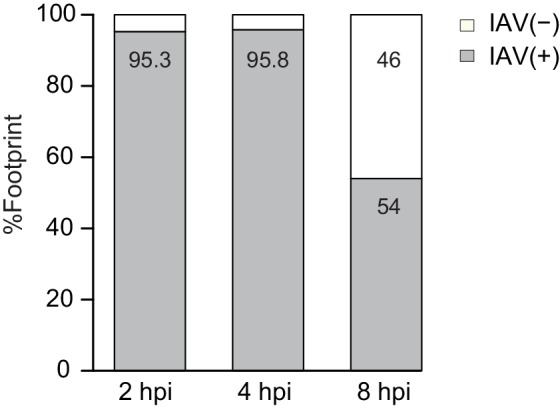
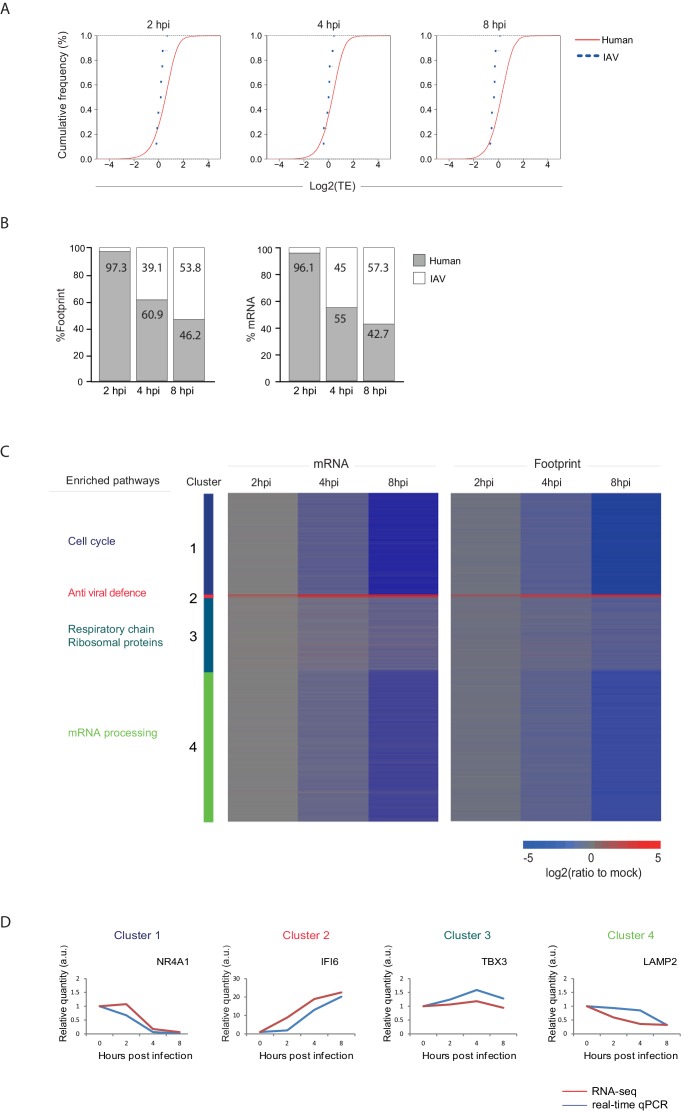
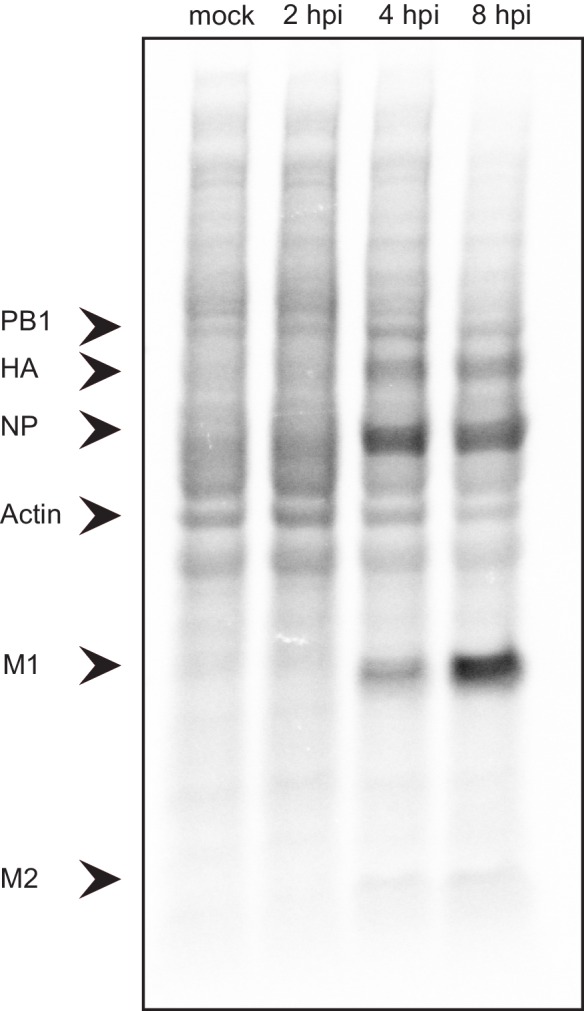
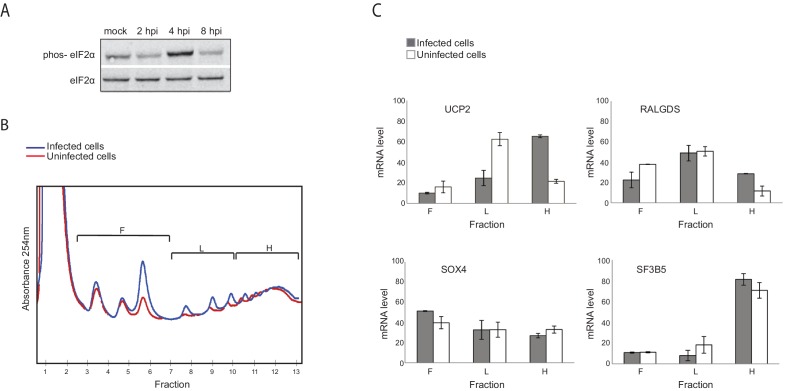
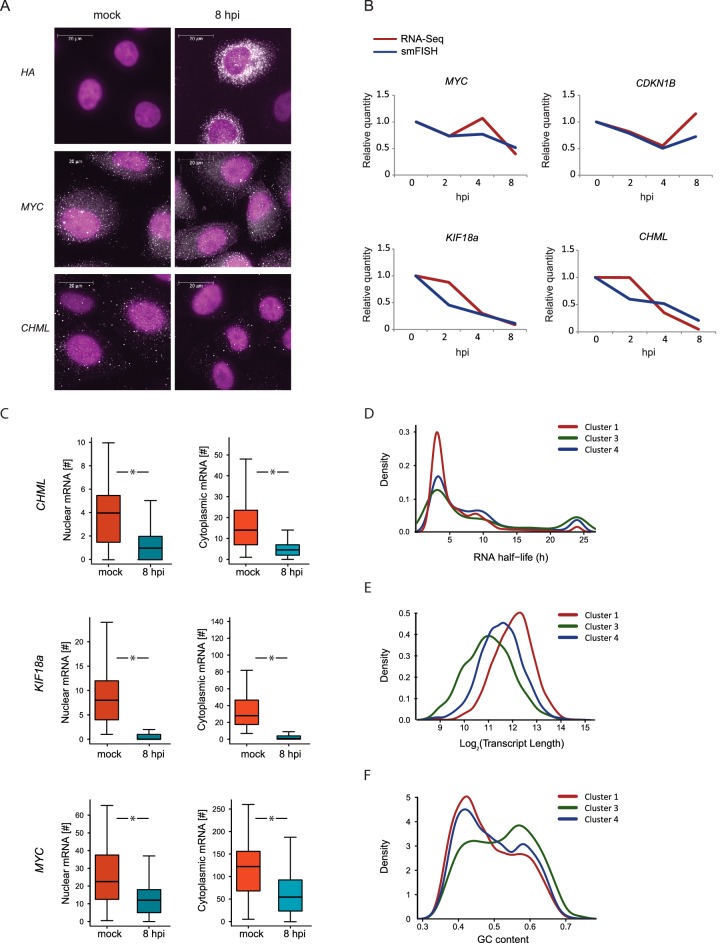
Host shutoff is a common strategy used by viruses to repress cellular mRNA translation and concomitantly allow the efficient translation of viral mRNAs. Here we use RNA-sequencing and ribosome profiling to explore the mechanisms that are being utilized by the Influenza A virus (IAV) to induce host shutoff. We show that viral transcripts are not preferentially translated and instead the decline in cellular protein synthesis is mediated by viral takeover on the mRNA pool. Our measurements also uncover strong variability in the levels of cellular transcripts reduction, revealing that short transcripts are less affected by IAV. Interestingly, these mRNAs that are refractory to IAV infection are enriched in cell maintenance processes such as oxidative phosphorylation. Furthermore, we show that the continuous oxidative phosphorylation activity is important for viral propagation. Our results advance our understanding of IAV-induced shutoff, and suggest a mechanism that facilitates the translation of genes with important housekeeping functions.

Keywords: computational biology; host shutoff; human; infectious disease; microbiology; systems biology; translation; virus infection.


Conflict of interest statement

The authors declare that no competing interests exist.

Figures

Figure 1.
Figure 1.. Ribosome profiling was performed along IAV infection.
(A) Experiment set up of Ribosome profiling and RNA-seq along IAV infection. (B) Reproducibility of the ribosome footprints and mRNA measurements of host genes at 4 hpi. The correlation in footprints and mRNA measurements between biological replicates is presented. DOI: http://dx.doi.org/10.7554/eLife.18311.003
Figure 2.
Figure 2.. Footprint profiles reflect ribosome-protected fragments from host and viral mRNAs.
(A) Metagene analysis of ribosome profiling data. Average ribosome read density profiles over well-expressed genes, aligned at their start codon and stop codons. Data from uninfected, 2, 4 and 8 hpi samples, and harringtonine pretreated 8 hpi sample. (B) Ribosome occupancies following treatments (illustrated on the left) with cycloheximide (CHX, top panels), and harringtonine (Harr, bottom panels) of the Influenza NS1 genomic locus at 8 hpi. Data from the plus strand (dark blue) and the minus strand (light blue) is presented. (C) Ribosome footprints profile of one human gene (ISG15) at 8 hpi. (D) Meta gene analysis from start codon for footprints originating from viral mRNAs. Data from 2, 4 and 8 hr of IAV infected and 8 hpi-harringtonine treated cells. (E) Fragment length organization similarity score (FLOSS) analysis for human mRNAs and for viral reads originating from the plus and minus strands. DOI: http://dx.doi.org/10.7554/eLife.18311.004
Figure 2—figure supplement 1.
Figure 2—figure supplement 1.. Metagene analysis of ribosome profiling data originating from IAV minus strand.
Average ribosome read density profiles from IAV minus strand, aligned to the highest peak found in each viral minus strand segment. Data from cycloheximide (CHX) or harringtonine (Harr) pre-treatment from 8 hpi samples. DOI: http://dx.doi.org/10.7554/eLife.18311.005
Figure 2—figure supplement 2.
Figure 2—figure supplement 2.. Percentage of footprints reads that aligned to IAV plus or minus strands from the sum of aligned viral reads at 2, 4, and 8 hpi.
DOI: http://dx.doi.org/10.7554/eLife.18311.006
Figure 3.
Figure 3.. Reduction in cellular mRNA levels is driving the reduction in host protein synthesis.
(A) Cumulative TE distribution among well-expressed human and viral genes shows that viral genes are translated at the same efficiency as cellular genes at 2, 4 and 8 hpi. (B) Percent of reads that aligned to the human or viral genome from the sum of aligned reads shown for ribosome profiling (footprints) and RNA-seq (mRNA) at 2, 4, and 8 hpi. (C) Ribosome footprints and mRNA read densities (reads per kilobase million, RPKM) of well-expressed human transcripts across three time points during Influenza infection were calculated relative to expression of uninfected cells (mock). Shown is a heat map of log2 expression ratios after partitioning clustering. Four main clusters are marked and for each of these clusters the pathway enrichment is labeled on the left. (D) Validation of mRNA measurements by real time qPCR for example genes. A representative analysis of two independent experiments is shown DOI: http://dx.doi.org/10.7554/eLife.18311.007
Figure 3—figure supplement 1.
Figure 3—figure supplement 1.. Lysates from A549 cells infected with IAV and metabolically labeled for 30-min periods ending at the times shown were analyzed by SDS-PAGE and autoradiography.
DOI: http://dx.doi.org/10.7554/eLife.18311.008
Figure 4.
Figure 4.. Genes responsive to eIF2α phosphorylation are translationally induced during IAV infection.
(A) Western blot analysis of eIF2α and its phosphorylated form (phos- eIF2α) along IAV infection. A representative blot of two independent experiments is shown. (B) Polysomal profiling of uninfected and IAV infected cells at 4 hpi. (C) Real time qPCR analysis of the relative levels of the indicated human mRNAs in the polysome-free fractions of the gradient (F), light polysomal fractions (L), and heavy polysomal fractions (H) of uninfected and IAV infected cells at 4 hpi. A representative analysis of two independent experiments is shown DOI: http://dx.doi.org/10.7554/eLife.18311.009
Figure 5.
Figure 5.. smFISH measurments of cellular mRNAs along IAV infection.
(A) mRNA detection by Single molecule FISH (smFISH) was performed on A549 cells, either mock infected or 8 hpi. DNA oligomer probes coupled with fluorescent dyes (cy5/Alexa549) were targeted against viral hemagglutinin (HA), human MYC and CHML mRNAs. Spots corresponding to single mRNA molecules were detectable. DAPI was used for nuclear staining. Scale bar is 20 μm. Representative images of at least two biological replicates are shown. (B) The numbers of mRNA molecules per cell from at least 45 cells were quantified along Influenza infection (mock infection, 2, 4, 8 hpi) using smFISH. The values obtained from both smFISH and RNA-seq measurements were normalized to mock and plotted on the same graph. (C) For CHML, KIF18a and MYC nuclear and cytoplasmic mRNA molecules were quantified using smFISH. p-values are derived from a Student's t-test, *p<0.05. (DF) Various features were compared between transcripts composing the clusters presented in Fig. 3C (representing differential response to IAV infection). (D) mRNA half-lives measurements in A549 cells (33) (E) Transcripts length distribution. (F) Transcripts GC content distribution. DOI: http://dx.doi.org/10.7554/eLife.18311.010
Figure 5—figure supplement 1.
Figure 5—figure supplement 1.. Poly-A tail length of host transcripts as was previously measured from HeLa and NIH3T3 cells (Chang et al., 2014) were compared between transcripts composing the clusters presented in Figure 3C.
DOI: http://dx.doi.org/10.7554/eLife.18311.011
Figure 5—figure supplement 2.
Figure 5—figure supplement 2.. Transcript’s GC content (left) and length distribution (right) were calculated for genes encoding ribosomal proteins and respiration components, for genes in cluster 3 after omitting these functional categories (cluster 3*) and for clusters 1 and 4 presented in Figure 3C (representing differential response to IAV infection).
DOI: http://dx.doi.org/10.7554/eLife.18311.012
Figure 6.
Figure 6.. Oxidative phosphorylation capacity is important for IAV replication.
(A) Western blot analysis of components of the respiratory complex UQCRC2, SDHB, COXII, and control genes PKN2 and ACTIN along IAV infection. A representative blot of three independent experiments is shown. (B) FACS analysis of TMRM staining for active mitochondria in A549 cells, either mock infected, untreated, infected for 12 and (left panel) or 24 hr (right panel). A representative analysis of two independent experiments is shown. (C and D) A549 cells infected with IAV were treated with either CCCP (untreated control, 10 µM and 20 µM) or Valinomycin (untreated control, 1 µM and 2.5 µM). Supernatants were collected at 24 and 48 hpi. (C) Viral copy numbers were estimated by qPCR and (D) viral titers were measured by plaque assay. Representative results of two independent experiments are shown. DOI: http://dx.doi.org/10.7554/eLife.18311.013
Figure 6—figure supplement 1.
Figure 6—figure supplement 1.. FACS analysis of propidium iodide (PI) staining of A549 cells infected with IAV for 48 hr and treated with either CCCP (untreated, 10 µM or 20 µM) or Valinomycin (untreated, 1 µM, 2.5 µM).
DOI: http://dx.doi.org/10.7554/eLife.18311.014

Comment in

References

    1. Abernathy E, Glaunsinger B. Emerging roles for RNA degradation in viral replication and antiviral defense. Virology. 2015;479-480:600–608. doi: 10.1016/j.virol.2015.02.007. - DOI - PMC - PubMed
    1. Achdout H, Arnon TI, Markel G, Gonen-Gross T, Katz G, Lieberman N, Gazit R, Joseph A, Kedar E, Mandelboim O. Enhanced recognition of human NK receptors after influenza virus infection. Journal of Immunology. 2003;171:915–923. doi: 10.4049/jimmunol.171.2.915. - DOI - PubMed
    1. Andreev DE, O'Connor PB, Fahey C, Kenny EM, Terenin IM, Dmitriev SE, Cormican P, Morris DW, Shatsky IN, Baranov PV. Translation of 5' leaders is pervasive in genes resistant to eIF2 repression. eLife. 2015;4:e18311. doi: 10.7554/eLife.03971. - DOI - PMC - PubMed
    1. Arias C, Weisburd B, Stern-Ginossar N, Mercier A, Madrid AS, Bellare P, Holdorf M, Weissman JS, Ganem D. KSHV 2.0: a comprehensive annotation of the Kaposi's sarcoma-associated herpesvirus genome using next-generation sequencing reveals novel genomic and functional features. PLoS Pathogens. 2014;10:e18311. doi: 10.1371/journal.ppat.1003847. - DOI - PMC - PubMed
    1. Bahar Halpern K, Itzkovitz S. Single molecule approaches for quantifying transcription and degradation rates in intact mammalian tissues. Methods. 2016;98:134–142. doi: 10.1016/j.ymeth.2015.11.015. - DOI - PubMed

Publication types