. 2016 Sep 8;537(7619):239-243.
doi: 10.1038/nature19346. Epub 2016 Aug 15.

The long non-coding RNA Morrbid regulates Bim and short-lived myeloid cell lifespan

Affiliations

The long non-coding RNA Morrbid regulates Bim and short-lived myeloid cell lifespan

Jonathan J Kotzin et al. Nature. .

Abstract

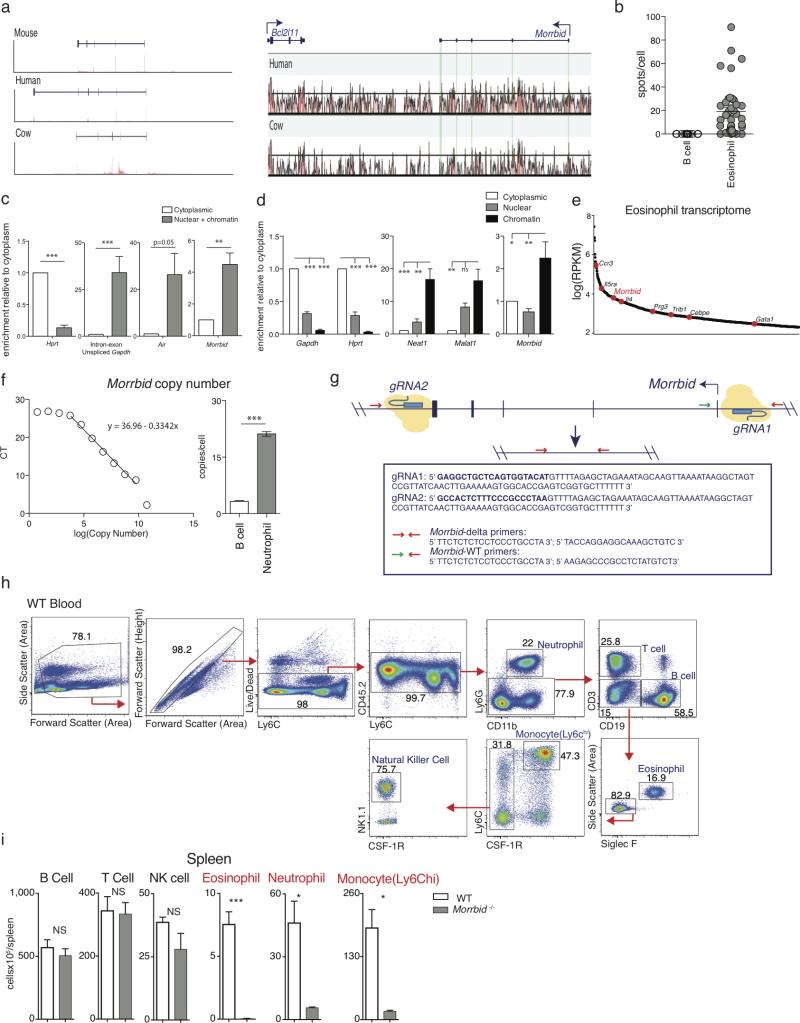
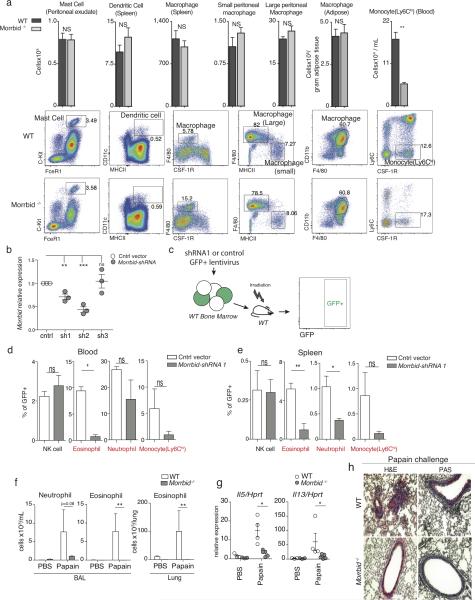
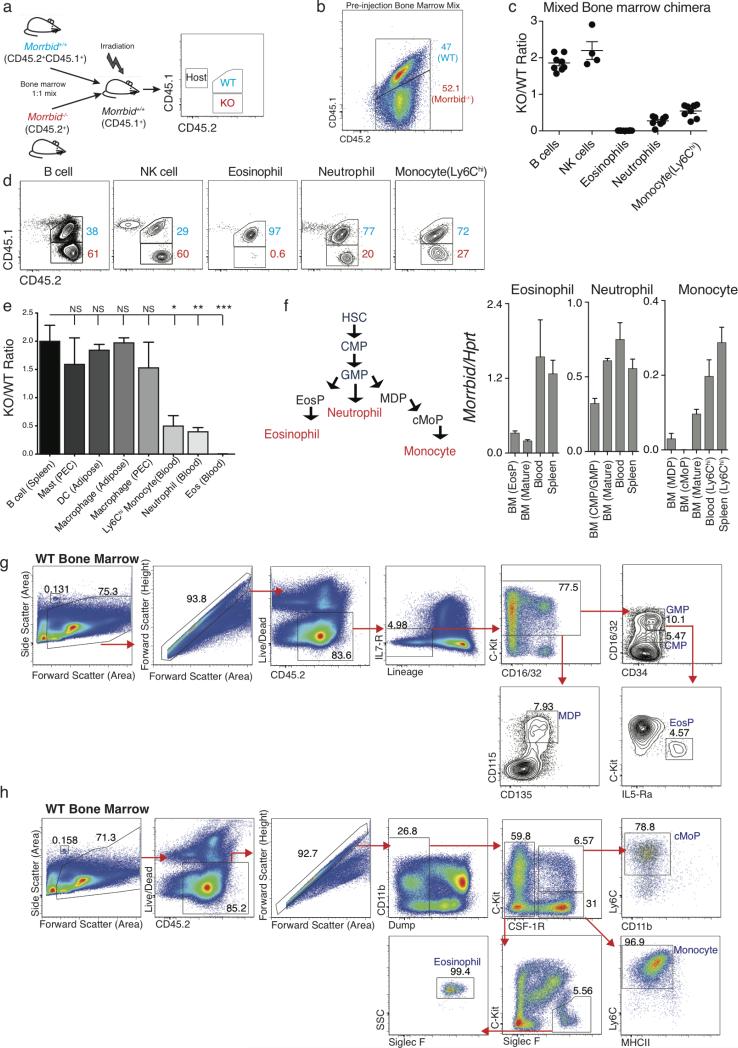
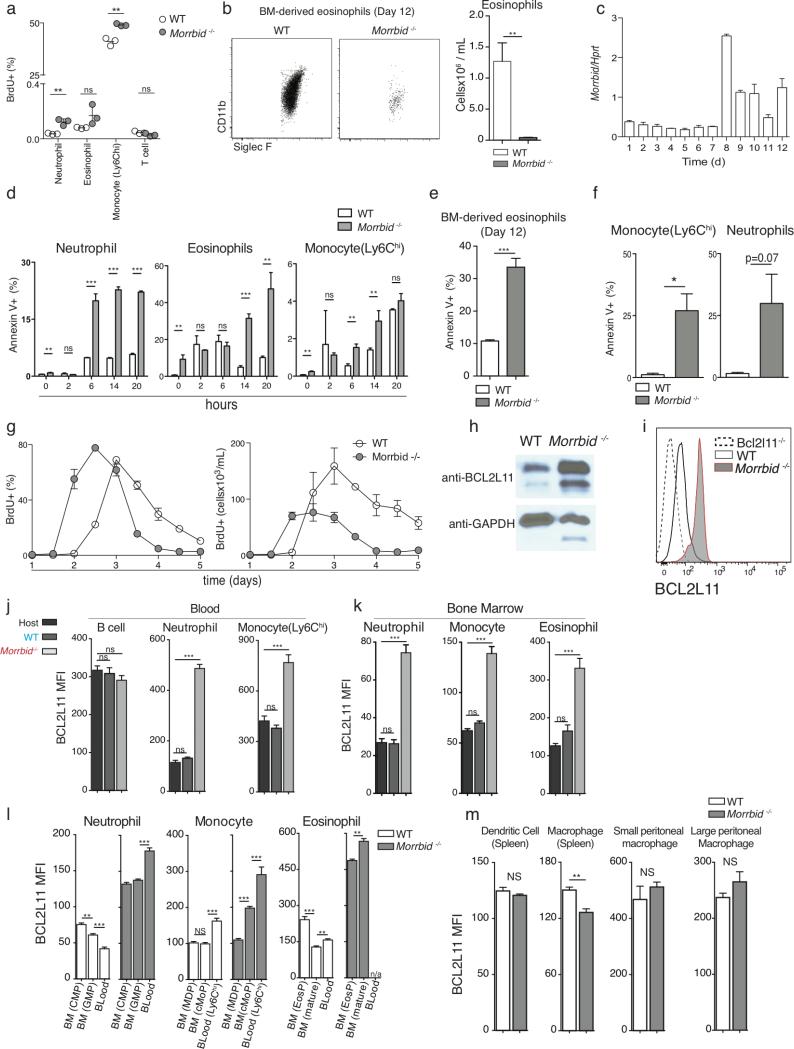
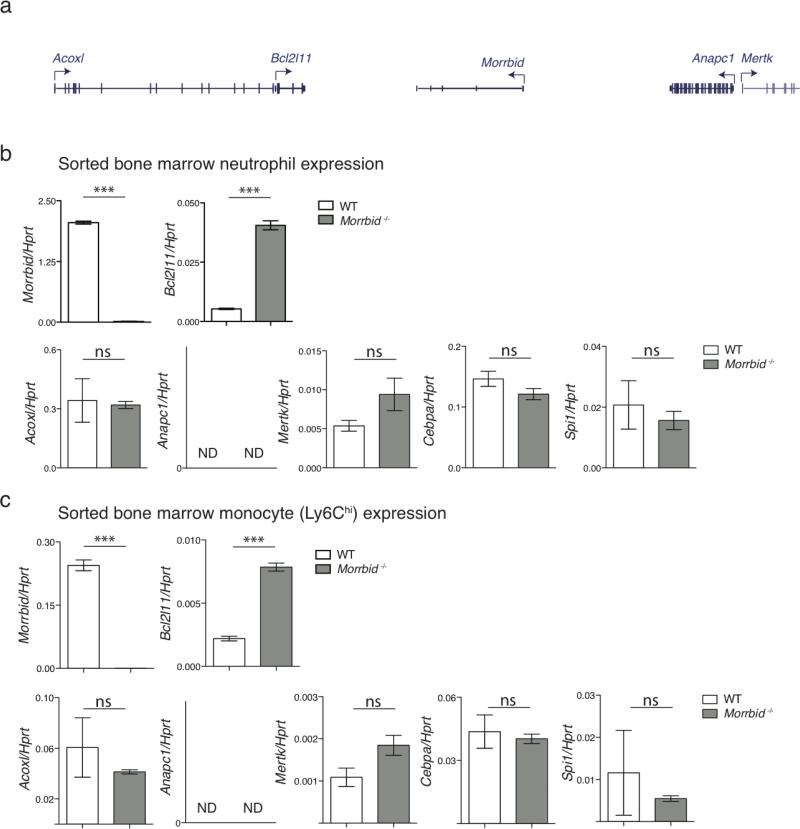
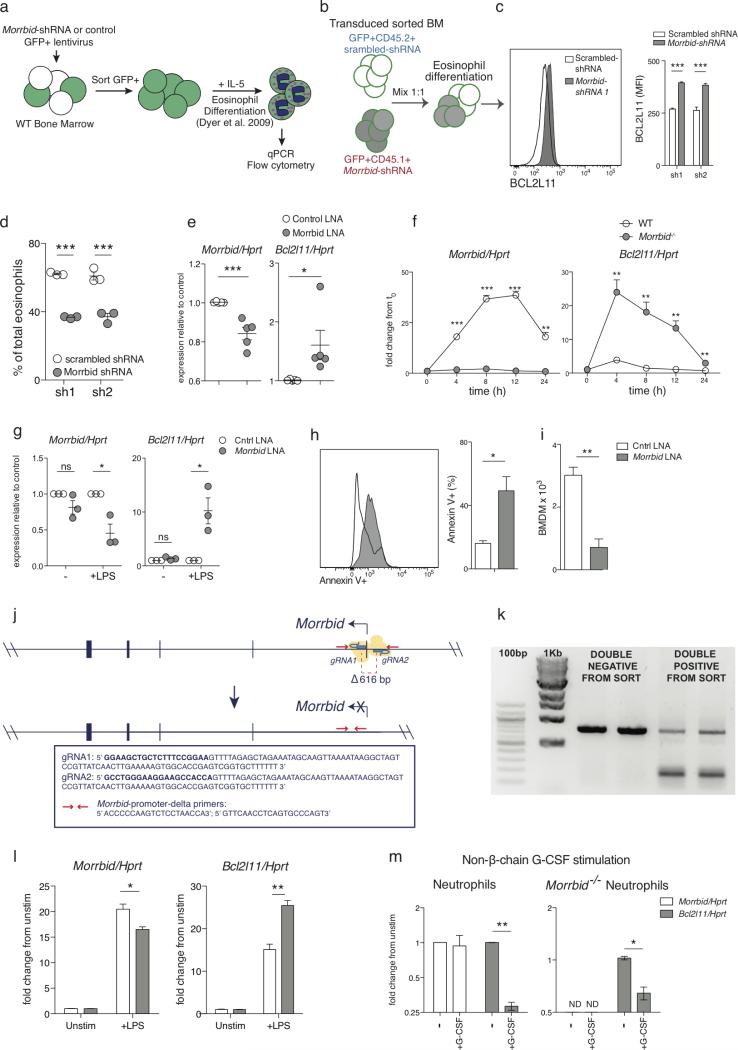
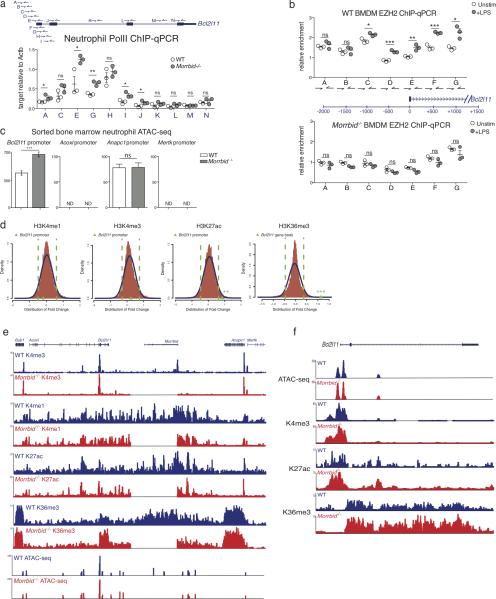
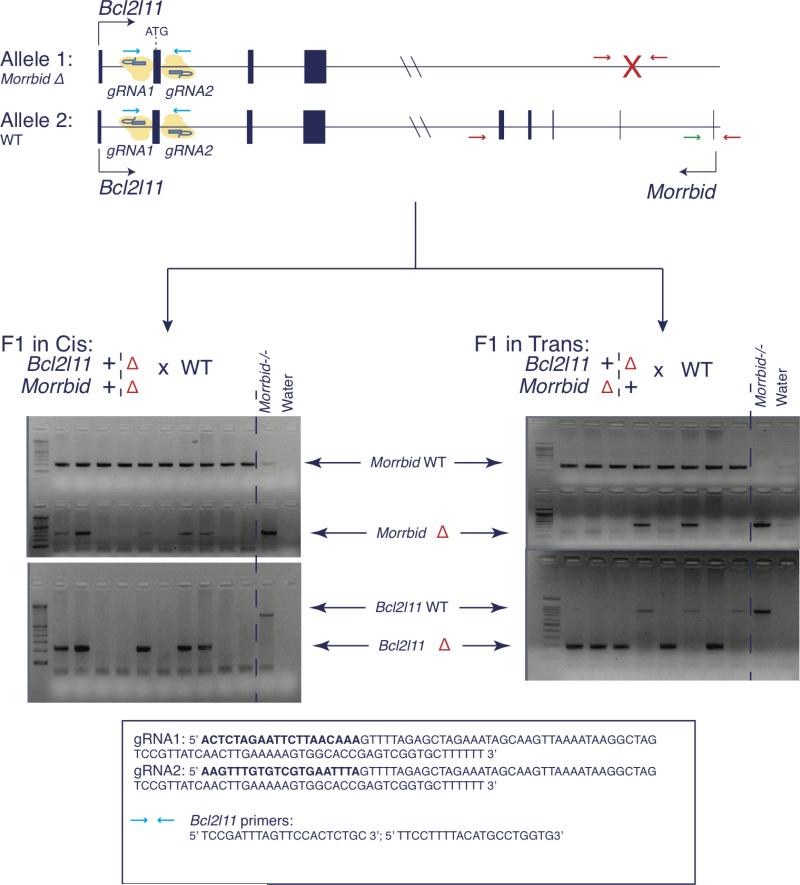
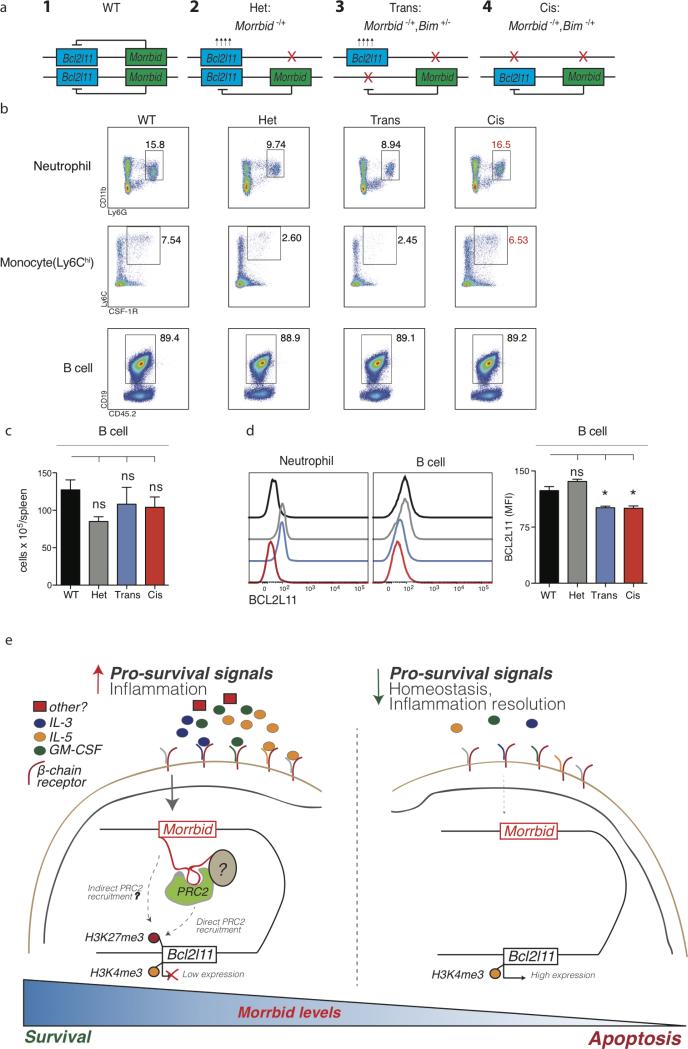
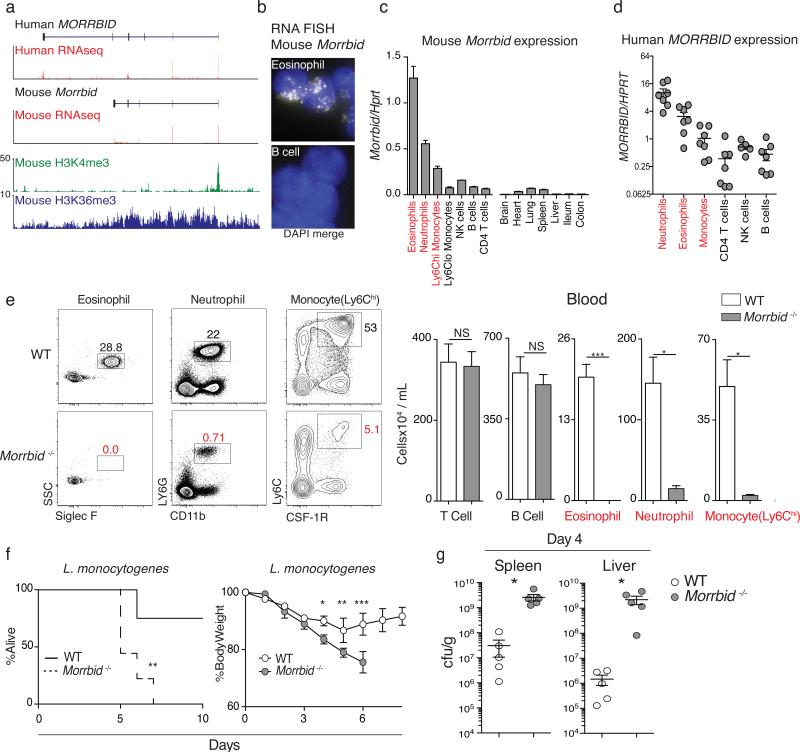
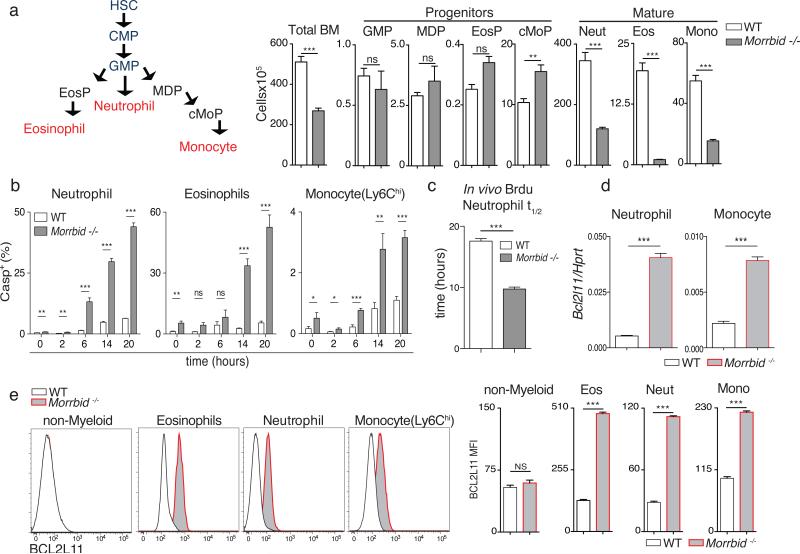
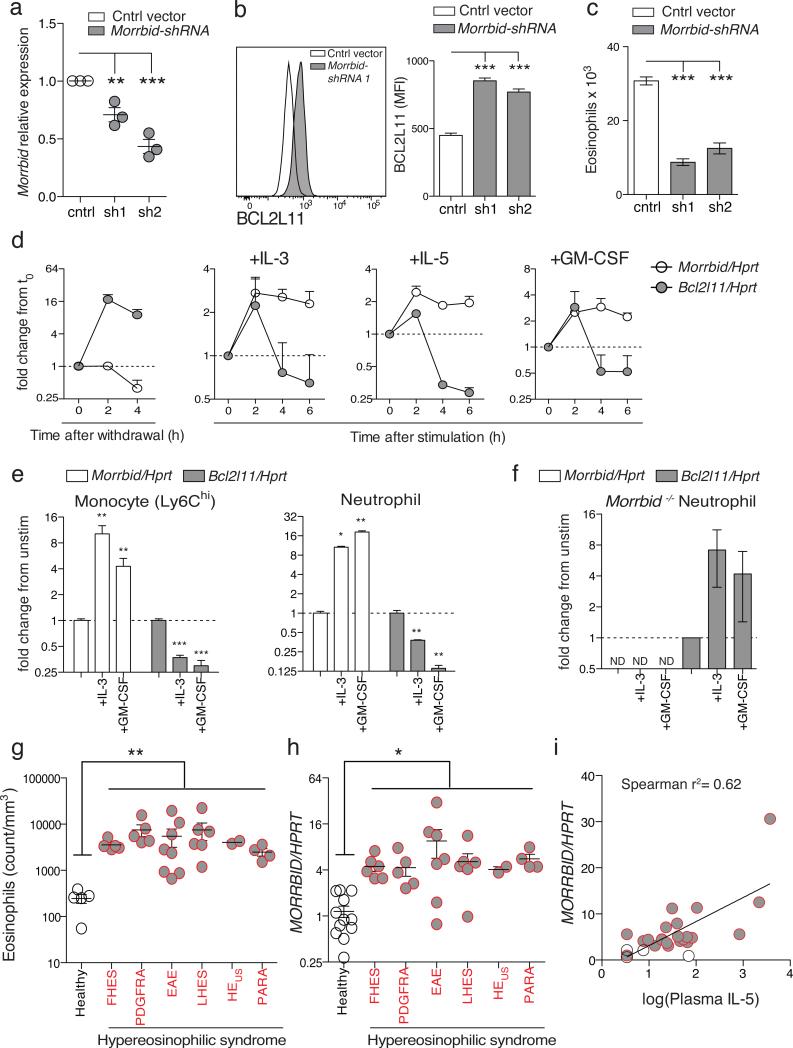
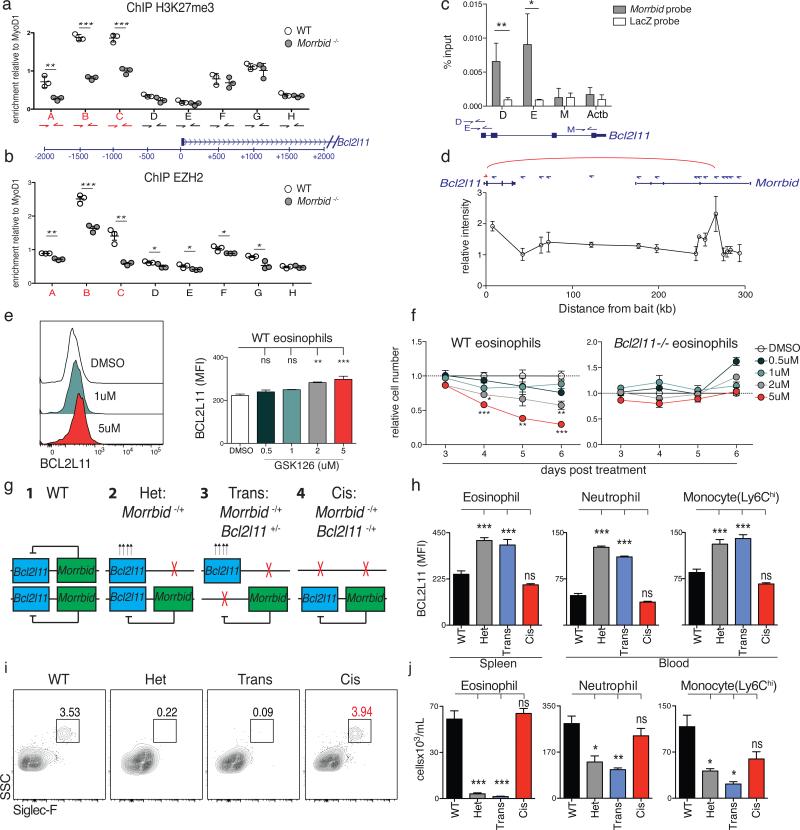
Neutrophils, eosinophils and 'classical' monocytes collectively account for about 70% of human blood leukocytes and are among the shortest-lived cells in the body. Precise regulation of the lifespan of these myeloid cells is critical to maintain protective immune responses and minimize the deleterious consequences of prolonged inflammation. However, how the lifespan of these cells is strictly controlled remains largely unknown. Here we identify a long non-coding RNA that we termed Morrbid, which tightly controls the survival of neutrophils, eosinophils and classical monocytes in response to pro-survival cytokines in mice. To control the lifespan of these cells, Morrbid regulates the transcription of the neighbouring pro-apoptotic gene, Bcl2l11 (also known as Bim), by promoting the enrichment of the PRC2 complex at the Bcl2l11 promoter to maintain this gene in a poised state. Notably, Morrbid regulates this process in cis, enabling allele-specific control of Bcl2l11 transcription. Thus, in these highly inflammatory cells, changes in Morrbid levels provide a locus-specific regulatory mechanism that allows rapid control of apoptosis in response to extracellular pro-survival signals. As MORRBID is present in humans and dysregulated in individuals with hypereosinophilic syndrome, this long non-coding RNA may represent a potential therapeutic target for inflammatory disorders characterized by aberrant short-lived myeloid cell lifespan.


Figures

Extended Data Fig. 1
Extended Data Fig. 1. Morrbid transcript expression, localization, and conservation across species
(a) (Left) Mouse, human, and cow Morrbid transcripts. Human neutrophil, mouse granulocyte, and cow peripheral blood RNA-seq data are represented as read density around the Morrbid transcript of each species. (Right) The Morrbid loci and surrounding genomic regions of the indicated species were aligned with mVista and visualized using the rankVista display generated with mouse as the reference sequence. Green highlights annotated mouse exonic regions and corresponding regions in other indicated species. (b) Quantification of Morrbid FISH spots per indicated cell population. Cells were stained with Morrbid RNA probes conjugated to 2 different fluorophores, and spots colocalizing in both fluorescent channels were quantified. (c) Cytoplasmic and nuclear subcellular RNA fractionation of LPS stimulated bone marrow-derived macrophages (BMDMs) with qPCR of indicated target transcripts (n=3 macrophages generated from independent mice). (d) Cytoplasmic, nuclear, and chromatin subcellular RNA fractionation of LPS stimulated immortalized BMDMs with qPCR of indicated target transcripts (average of 4 independent experiments) (e) Mature eosinophil transcriptome sorted in descending order of log(RPKM) gene expression, with annotated select reported eosinophil-associated genes. (f) Average number of Morrbid RNA copies per cell in sorted neutrophils and B cells. (Left) Standard curve generated using in vitro transcribed Morrbid RNA spiked into Morrbid-deficient RNA isolated from spleen. (Right) calculated per cell Morrbid RNA copies (n=3 replicates from independent mice). (g) Representation of CRISPR-Cas9 targeting of the Morrbid locus with indicated guide- RNA (gRNA) sequences and genotyping primer sets. Target gRNA sequences are bolded. (h) Cells isolated from the blood of wild-type (WT) mice. Representative flow cytometry plots demonstrating the gating strategy for Neutrophils (CD45+, CD11b+, LY6G+), T cells (CD45+, Ly6G−, CD3+), B cells (CD45+, Ly6G−, CD3−, CD19+), Eosinophils (CD45+, CD3−, CD19−, Ly6G, Siglec f+, SSChi), Ly6Chi Monoctyes (CD45+, CD3−, CD19−, Ly6G, SSClo, Siglec f, Ly6Chi, CSF-1R+), Natural Killer cells (CD45+, CD3−, CD19−, Ly6G, SSClo, Siglec f, CSF-1R−, NK1.1+). (i) Total cell numbers of the indicated cell populations isolated from the spleen of WT and Morrbid-deficient mice (n=3-5 mice per group, results representative of 8 independent experiments). Error bars show s.e.m. *p < 0.05, **p < 0.01, and ***p < 0.001 (two-sided t-test c,f,i; oneway Anova with Tukey post hoc analysis d).
Extended Data Fig. 2
Extended Data Fig. 2. Myeloid cell populations in tissue following Morrbid deletion and blood and spleen following Morrbid knockdown in vivo
(a) Representative flow-cytometry plots and absolute counts of the indicated cell populations in wild-type (WT) and Morrbid-deficient mice (n=3-5 mice per group, representative of 3-7 independent experiments). (b) shRNA knockdown of Morrbid RNA relative to control vector in bone marrow (BM) transduced with the indicated GFP vector, sorted on GFP, differentiated into eosinophils and assessed by qPCR (each dot represents eosinophils generated from independent mice). (c) Schematic of control and Morrbid shRNA1 BM chimera generation (d-e) Frequency of indicated cell populations within total GFP+ transduced cells from (d) blood and (e) spleen. (n=3-4 mice per transduction group). (f-h) WT and Morrbid-deficient mice challenged with papain or PBS. (f) Absolute numbers of indicated cell populations in lung tissue and BAL. (g) qPCR expression in lung tissue. (h) Representative H&E and PAS lung histology. (n=3-4 mice per group; representative of two independent experiments) Error bars show s.e.m. *p < 0.05, **p < 0.01, and ***p < 0.001 (two-sided t-test a,b,d,e; Mann-Whitney U-test f,g).
Extended Data Fig. 3
Extended Data Fig. 3. Morrbid regulation of mature neutrophils, eosinophils, and Ly6Chi monocytes is cell-intrinsic
(a-e) Morrbid-deficient competitive bone marrow (BM) chimera generation. (a) Schematic of mixed-bone marrow (BM) chimera generation. Congenically labeled wild-type (WT) CD45.1+CD45.2+ and Morrbid-deficient CD45.2+ BM cells were mixed 1:1 and injected into an irradiated CD45.1+ host. (b) Ratio of mixed congenically labeled wild-type (WT) CD45.1+CD45.2+ and Morrbid-deficient CD45.2+ BM cells prior to injection into an irradiated CD45.1+ host. (c) Ratio of Morrbid-deficient to WT short-lived myeloid and control immune cells in blood and (d) representative flow-cytometry plots of these cell populations. (e) Morrbid-deficient to WT ratio of additional immune cell populations (n=4-8 mice per group; pooled from two independent experiments). (f) Schematic of myeloid differentiation and Morrbid qPCR expression in the indicated sorted progenitor and mature cells (n=3-5 mice per group; representative of 3 independent experiments). (g) Cells isolated from the BM of wild-type (WT) mice. Representative flow cytometry plots demonstrating the gating strategy for Common Myeloid Progenitor (CMP): Lineage-(Sca1,CD11b,GR-1,CD3, Ter-119, CD19, B220, NK1.1), IL7Ra−, C-kit+, CD34+, CD16/32lo/int; Granulocyte/Monocyte Progenitor (GMP): Lineage-, IL7Ra−, C-kit+, CD34+, CD16/32hi; Monocyte/Dendritic cell Progenitor (MDP): Lineage-, IL7Ra−, C-kit+, CD115+, CD135+; Eosinophil Progenitor (EosP): Lineage-, IL7Ra−, C-kit+, CD34+, CD16/32hi, IL-5Ra+. Flow cytometry count beads are visualized and gated by forward and side scatter area. (h) Cells isolated from the BM of WT mice. Representative flow cytometry plots demonstrating the gating strategy for Eosinophils: Dump- (Dump: CD3, NKp46, Ter119, CD19, Ly6G, Sca1), CSF-1R-, C-kit neg/lo, SiglecF+, SSChi; Monocytes: Dump-, CSF- 1R+, C-kit-, MHCII-, Ly6Chi; Common Monocyte Progenitor (cMoP): Dump-, CSF-1R+, C-kit+, Ly6Chi, CD11blo. Flow cytometry count beads are visualized and gated by forward and side scatter area. Error bars show s.e.m. *p < 0.05, **p < 0.01, and ***p < 0.001 (one-way Anova with Tukey post hoc analysis).
Extended Data Fig. 4
Extended Data Fig. 4. Morrbid regulates neutrophil, eosinophil, and Ly6Chi monocyte lifespan through cell-intrinsic regulation of Bcl2l11
(a) Flow cytometric analysis of percentage of BrdU incorporation in the indicated wild-type (WT) and Morrbid-deficient immune cell populations from blood. Mice were analyzed 24 hours following one dose of 2 mg BrdU (n = 3 mice per group). (b) Representative flow-cytometry plots and absolute counts of mature eosinophils (Live, CD45+, SSChi, CD11b+, Siglec F+) of bone-marrow (BM)-derived eosinophil culture on day 12 (D12) in WT and Morrbid-deficient mice (n=3 mice per group, results representative of 3 independent experiments). (c) Morrbid expression of developing WT BM-derived eosinophils at indicated time points of in vitro culture (n=3 mice per group). (d) Percentage of annexin V+ WT and Morrbid-deficient BM cell populations at indicated time points of ex vivo culture (n = 3 mice per group; data are representative of two independent experiments). (e) Percentage of annexin V+ eosinophils (gated on annexin V+, CD45+, SSChi, CD11b+, Siglec F+) of BM-derived eosinophil culture on D12 in WT and Morrbid- deficient mice (n=3 mice per group, results representative of 3 independent experiments). (f) Percentage of annexin V+ WT and Morrbid-deficient neutrophils and Ly6Chi monocytes 4 days following L. monocytogenes infection (n=3 mice per group, representative of 2 independent experiments). (g) Flow cytometric analysis of percentage and absolute number of blood neutrophils from WT or Morrbid-deficient mice that were pulsed two times with 2 mg BrdU 3 hrs apart and monitored over 5 days. (n = 4 mice per group; data are representative of three independent experiments). (h) Western blot analysis of BCL2L11 protein expression in WT and Morrbid-deficient sorted BM neutrophils. (i) BCL2L11 protein expression measured by flow-cytometry in blood neutrophils from WT, Morrbid-deficient, and Bcl2l11-deficient mice (n=1-4 mice per group). (j-k) BCL2L11 protein expression in mixed-BM chimera model. Quantification of mean fluorescence intensity (MFI) of BCL2L11 protein expression in indicated cell populations from (j) blood and (k) BM (n=4-8 mice per group, results representative of two independent experiments). (l) BCL2L11 protein expression in the indicated progenitors and mature cell-types from WT and Morrbid-deficient mice. n/a indicates that too few cells were present for MFI quantification (n=3-5 mice per group, results representative of 3 independent experiments). (m) BCL2L11 expression measured in the indicated cell populations from wild-type (WT) and Morrbid-deficient mice (n=3, results representative of two independent experiments). Error bars show s.e.m. *p < 0.05, **p < 0.01, and ***p < 0.001 (two-sided t-test).
Extended Data Fig. 5
Extended Data Fig. 5. Morrbid specifically controls Bcl2l11 expression
(a) Schematic representation of genes surrounding the Morrbid locus. (b-c) Expression of indicated transcripts assessed by qPCR in (b) neutrophils and (c) Ly6Chi monocytes sorted from wild-type (WT) and Morrbid-deficient mice. N.D. (not detected) indicates expression was below the limit of detection. (n=3 mice per group, representative of 2 independent experiments). Error bars show s.e.m. *p < 0.05, **p < 0.01, and ***p < 0.001 (two-sided t-test).
Extended Data Fig. 6
Extended Data Fig. 6. Knockdown of Morrbid leads to Bcl2l11 upregulation and cell death
(a) Schematic of shRNA transduced bone marrow (BM)-derived eosinophil system. (b-d) In vitro shRNA BM-derived eosinophil competitive chimera. (b) Schematic of transduction of CD45.2+ and CD45.1+ BM cells transduced with GFP scrambled- shRNA or GFP Morrbid-specific shRNA lentiviral vectors, respectively. GFP+ cells were sorted, mixed 1:1, differentiated into eosinophils, and analyzed by flow cytometry. (c) Representative histogram and MFI quantification of BCL2L11 expression of mature eosinophils separated by congenic marker. (d) Percent contribution of each congenic BM to the total mature eosinophil pool (n=3 mice per group, each dot represents eosinophils differentiated from the BM of 1 mouse, representative of 2 independent experiments). (e) Morrbid and Bcl2l11 expression of WT BM-derived eosinophils transfected with Morrbid-specific LNA 3 and control locked nucleic acids (LNAs). (each dot represents the average of 2-3 biological replicates, data pooled from 5 independent experiments). (f) Morrbid and Bcl2l11 expression of wild-type (WT) and Morrbid-deficient BM-Derived Macrophages (BMDMs) at the indicated time points following LPS stimulation. Expression is represented as fold change from time 0 (t0) (n=3 mice per group, representative of 3 independent experiments). (g-i) LPS-stimulated BM-derived macrophages transfected with pooled Morrbid-specific (LNA 1-4) or scrambled (Cntrl LNA) antisense locked nucleic acids (LNAs). (g) Morrbid and Bcl2l11 qPCR expression. (h) Annexin V+ expression and (i) absolute BM-derived macrophage numbers (n=3 mice per group, representative of 6 independent experiments). (j-l) Morrbid promoter deletion in immortalized BMDMs. (j) Diagram of Morrbid promoter targeting in immortalized BMDMs using CRISPR-Cas9. Immortalized BMDMs were transfected with GFP expressing Cas9 and Cherry expressing gRNA vectors of the indicated sequences. GFP+/Cherry+ and GFP−/Cherry− expressing cells were sorted and assayed at the bulk level using (k) PCR for verification of promoter deletion using the indicated primers and (l) qPCR for Morrbid and Bcl2l11 expression following LPS stimulation for 6 hours. (n=3 LPS stimulated cultures, average of 3 independent experiments). (m) Morrbid and Bcl2l11 transcript expression in WT and Morrbid-deficient sorted BM neutrophils stimulated with G-CSF for 4 hours. Expression is represented as fold change from unstimulated. (n=3 mice, representative of 2 independent experiments). Error bars show s.e.m. *p < 0.05, **p < 0.01, and ***p < 0.001 (two-sided t-test).
Extended Data Fig. 7
Extended Data Fig. 7. Epigenetic impact of Morrbid deletion on its surrounding genomic region
(a) ChIP-qPCR analysis of total Pol-II enrichment within the Bcl2l11 promoter and gene body in wild-type (WT) and Morrbid-deficient neutrophils. Results are represented as Bcl2l11 enrichment relative to control Actb enrichment within each sample. Each dot represents 1-2 pooled mice. (b) ChIP-qPCR analysis of EZH2 enrichment within the Bcl2l11 promoter in WT and Morrbid-deficient bone marrow-derived macrophages (BMDMs) stimulated with LPS for 12 hours. Results are represented as Bcl2l11 enrichment relative to control MyOD1 enrichment within each sample. (n=3, each dot represents BMDMs generated from 1 mouse). (c) Relative chromatin accessibility levels at the Bcl2l11, Acoxl, Anapc1, and Mertk promoters in Morrbid−/− and WT neutrophils as assessed by ATAC-seq. Chromatin accessibility levels were estimated as an average TMM (Trimmed mean of M-values) normalized read count across the replicates. Statistics were obtained by differential open chromatin analysis using the DiffBind R package. The Bcl2l11 promoter is more open in Morrbid−/− neutrophils with a 1.52 fold change with a FDR of < 0.1%. N.D. (not detected) indicates that no peak was present at the indicated promoter. (d) Density plot of log2 fold change distribution for H3K4me1, H3K4me3, H3K27ac and H3K36me3 levels between Morrbid−/− and WT neutrophils. Relative fold changes are estimated as the ratio of TMM normalized read counts within consensus peak regions and were obtained using the DiffBind R package. Positive and negative fold changes indicate higher levels of ChIP binding in Morrbid−/− and WT neutrophils, respectively. Dashed green lines show the 5th and 95th percentiles. The green triangles on the x-axis mark the change at the Bcl2l11 promoter or gene body between WT and Morrbid−/− neutrophils. (e-f) ATAC-seq and ChIP-seq for H3K4me1, H3K4me3, H3K27ac, and H3K36me3 chromatin modifications were performed on neutrophils sorted from the bone marrow of wild-type (WT) and Morrbid-deficient mice. ATAC-seq and ChIP-seq are represented as read density (e) surrounding the Morrbid locus and (f) at the Bcl2l11 locus. ATAC-seq tracks are expressed as reads normalized to total reads, and chromatin modification tracks are expressed as reads normalized to input. Error bars show s.e.m. *p < 0.05, **p < 0.01, and ***p < 0.001 (two-sided t-test a,b; FDR of fold change as described above c,d).
Extended Data Fig. 8
Extended Data Fig. 8. Morrbid represses Bcl2l11 by maintaining its bivalent promoter in a poised state and Morrbid-haploinsufficiency
(a) Venn diagram summary of EZH2 PAR-CLIP analysis, with representation of tags and RNA-protein contact sites (RCSs) as determined by PARalyzer mapping to Morrbid. (b) Co-immunoprecipitation of the PRC2 family member EZH2 and Morrbid. Nuclear extracts of immortalized WT bone marrow-derived macrophages (BMDMs) stimulated with LPS for 6-12 hours were immunoprecipitated by IgG or anti-EZH2. Co-precipitation of indicated RNAs were assayed by qPCR. Data are represented as enrichment over IgG control (n=6 biological replicates pooled from 2 independent experiments, representative of 3 independent experiments). (c) Validation of Morrbid RNA pull-down over other RNAs using pools of Morrbid capture probes and LacZ probes (n=3, average of 3 independent experiments). (d) Visualized 3C PCR products from bait and indicated reverse primers using template from fixed and ligated bone marrow derived eosinophil DNA (S1, S2, and S3), BAC control (BAC), or water. The sequence of each reverse primer is listed in Supplementary Table 1. (e-f) Bone marrow-derived eosinophils from wild-type (WT) and Bcl2l11−/− mice treated with EZH2 inhibitor GSK126 over time. (e) Frequency of non-viable (Aqua+) and (f) annexin V staining cells on day 5 following treatment with GSK126 (n=3 independently differentiated eosinophils per dose, results representative of 2 independent experiments). (g) (Top) Total cell numbers and (Bottom) BCL2L11 protein expression of indicated cell populations from the blood of wild-type (WT), Morrbid-heterozygous, and Morrbid- deficient mice (n=3-5 mice per group, results representative of 3 independent experiments). Error bars show s.e.m. *p < 0.05, **p < 0.01, and ***p < 0.001 (two-sided t-test c,g; one way Anova with Tukey post hoc analysis e,f; Mann-Whitney U-test b).
Extended Data Fig. 9
Extended Data Fig. 9. Generation of Morrbid-Bcl2l11 double heterozygous mice
Diagram of allele specific CRISPR-Cas9 targeting of Bcl2l11. Bcl2l11 was targeted using indicated gRNA sequences in one cell embryos from a wild-type (WT) by Morrbid- deficient breeding. F1 mice with allele-specific Bcl2l11 deletions in cis or in trans of the Morrbid-deficient allele were bred to a WT background to demonstrate linkage or segregation of Bcl2l11 and Morrbid knock-out alleles. Second most right lanes of both gels contain Morrbid−/−; Bcl2l11+/+ DNA, and right most lanes contain water, as internal controls.
Extended Data Fig. 10
Extended Data Fig. 10. Morrbid regulates Bcl2l11 in an allele-specific manner and working model of the role of Morrbid
(a) Diagram of the allele-specific combinations of Morrbid- and Bcl2l11-deficient heterozygous mice studied. (b) Representative flow cytometry plots of indicated splenic cell populations in the specified allele-specific deletion genetic backgrounds. Neutrophils (CD45+, CD11b+, LY6G+), Monoctyes (CD45+, CD3−, CD19−, Ly6G, SSClo, Siglec f, Ly6Chi, CSF-1R+), and B cells (CD45+, Ly6G−, CD3−, CD19+). Wild type (WT), Morrbid heterozygote (Het), Bcl2l11 heterozygote and Morrbid heterozygote with deletions in trans (Trans), Bcl2l11 heterozygote and Morrbid heterozygote with deletions in cis (Cis). (c) Absolute counts and (d) BCL2L11 protein expression of indicated splenic cell populations in the specified genetic backgrounds (n=3-9 mice per genetic background). (e) Morrbid integrates extracellular signals to control the lifespan of eosinophils, neutrophils, and “classical” monocytes through the allele-specific regulation of Bcl2l11. Pro-survival cytokines induce Morrbid, which promotes enrichment of the PRC2 complex within the bivalent Bcl2l11 promoter through direct and potentially indirect mechanisms to maintain this gene in a poised state. Tight control of the turnover of these short-lived myeloid cells by Morrbid promotes a balance of host anti-pathogen immunity with host damage from excess inflammation. Error bars show s.e.m. *p < 0.05, **p < 0.01, and ***p < 0.001 (one-way Anova with Tukey post hoc analysis).
Figure 1
Figure 1. Long non-coding RNA Morrbid is a critical regulator of eosinophils, neutrophils, and Ly6Chi monocytes
(a) Human neutrophil and mouse granulocyte normalized RNA-seq and ChIP-seq tracks at the Morrbid locus. (b) Single molecule Morrbid RNA FISH. (c) qPCR expression of mouse (n=3; representative of 3 independent experiments) and (d) human Morrbid in indicated cell-types and tissues (n=7). (e) WT and Morrbid-deficient flow-cytometry plots and absolute counts (n=3-5; representative of 7 independent experiments). (f-g) L. monocytogenes infection of WT and Morrbid-deficient mice. (f) Survival and weight loss (n=9, representative of 3 independent experiments). (g) CFUs/g from indicated organs (n=5; representative of 3 independent experiments). Error bars show s.e.m. *p < 0.05, **p < 0.01, and ***p < 0.001 (two-sided t-test e,g, (right) f; Mantel-Cox test (left) f).
Figure 2
Figure 2. Morrbid controls eosinophil, neutrophil, and Ly6Chi monocyte lifespan
(a) Schematic of short-lived myeloid cell development and absolute numbers of the indicated cell-types in bone marrow (BM) from WT and Morrbid-deficient mice (n=3-5; representative of 3 independent experiments). (b) Frequency of Casp+ (Z-VAD-FMK+) in cultured BM cells (n=3 mice; representative of 2 independent experiments). (c) Half-life of BrdU pulse-labeled neutrophils in blood in vivo (n=4 mice; representative of 3 independent experiments). (d) Bcl2l11 qPCR expression in indicated cell-types sorted from BM (n=3; representative of 2 independent experiments). (e) BCL2L11 protein expression assessed by flow-cytometry in indicated BM cell-types. (Left) Representative histograms. (Right) MFI quantification (n=3-5 mice, representative of 3 independent experiments). Error bars show s.e.m. *p < 0.05, **p < 0.01, and ***p < 0.001 (two-sided t-test)
Figure 3
Figure 3. Pro-survival cytokines repress pro-apoptotic Bcl2l11 through induction of Morrbid RNA
(a-c) Bone marrow (BM)-derived eosinophils transduced with control or Morrbid-specific shRNAs. (a) Morrbid qPCR expression. (b) BCL2L11 protein expression and (c) absolute eosinophil counts (n=3 mice per group, representative of 2 independent experiments). (d) Morrbid and Bcl2l11 qPCR expression in BM-derived eosinophils following withdrawal/stimulation with indicated cytokines (n=3 mice, representative of 2 independent experiments). (e-f) Morrbid and Bcl2l11 qPCR expression in (e) WT and (f) Morrbid-deficient sorted BM cell-types stimulated with indicated cytokines. (n=3-4 mice, representative of 3 independent experiments). (g-i) MORRBID expression in human hypereosinophilic syndrome (HES). (g) Absolute eosinophil count, (h) purified eosinophil MORRBID qPCR expression, and (i) correlation between log(plasma IL-5) and MORRBID expression. (each dot represents one individual; n=2-12 per disease group). Familial HES (FHES), PDGFRA+ HES (PDGFRA), episodic angioedema and eosinophilia (EAE), lymphocytic variant HES (LHES), HES of undetermined significance (HEus), and parasitic infection (PARA). Error bars show s.e.m. *p < 0.05, **p < 0.01, and ***p < 0.001 (two-sided t-test a-h, Spearman's correlation i).
Figure 4
Figure 4. Morrbid represses Bcl2l11 in cis by maintaining its bivalent promoter in a poised state
(a-b) ChIP-qPCR for (a) H3K27me3 and (b) EZH2 at the Bcl2l11 promoter in sorted bone marrow (BM) neutrophils (dot represents 1-2 pooled mice). (c) ChIRP-qPCR of Morrbid RNA occupancy (average of 3 independent experiments). (d) 3C of the Bcl2l11 promoter and indicated genomic regions. (average of 3 independent experiments). (e-f) WT and Bcl2l11-deficient BM-derived eosinophils treated with the EZH2 inhibitor GSK126. (e) BCL2L11 protein expression on treatment day 5. (f) Number of cells relative to DMSO treatment control (n=3 mice per dose, representative of 2 independent experiments). (g-j) Allele-specific combinations of Morrbid- and Bcl2l11-deficient mice. (g) Schema. (h) BCL2L11 MFI of indicated cell-types. (i) Representative flow-cytometry of blood eosinophils. (j) Absolute counts of indicated splenic cell-types (n=3-9 mice per group). Error bars show s.e.m. *p < 0.05, **p < 0.01, and ***p < 0.001 (two-sided t-test a,b,c; oneway Anova with Tukey post hoc e,f,h,j).

Comment in

References

    1. Manz MG, Boettcher S. Emergency granulopoiesis. Nat. Rev. Immunol. 2014;14:302–314. - PubMed
    1. Ginhoux F, Jung S. Monocytes and macrophages: developmental pathways and tissue homeostasis. Nat. Rev. Immunol. 2014;14:392–404. - PubMed
    1. Heo JB, Sung S. Vernalization-mediated epigenetic silencing by a long intronic noncoding RNA. Science. 2011;331:76–79. - PubMed
    1. Xing Z, et al. lncRNA directs cooperative epigenetic regulation downstream of chemokine signals. Cell. 2014;159:1110–1125. - PMC - PubMed
    1. Bouffi C, et al. Transcription Factor Repertoire of Homeostatic Eosinophilopoiesis. J. Immunol. 2015;195:2683–2695. - PMC - PubMed

MeSH terms