. 2016 Nov;15(11):1212-1221.
doi: 10.1038/nmat4718. Epub 2016 Aug 15.

Mechanism of hard-nanomaterial clearance by the liver

Affiliations

Mechanism of hard-nanomaterial clearance by the liver

Kim M Tsoi et al. Nat Mater. 2016 Nov.

Abstract

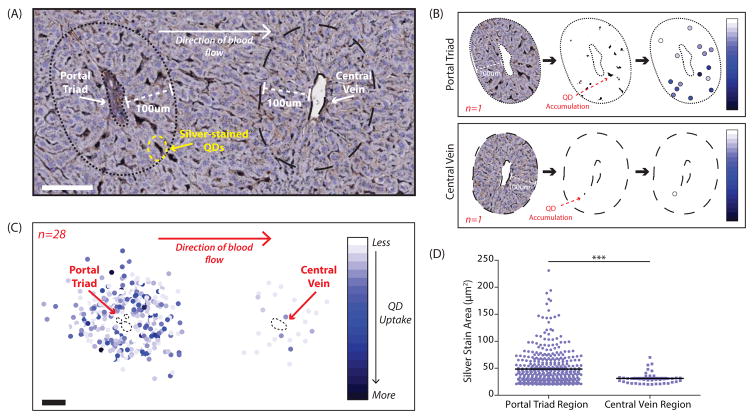
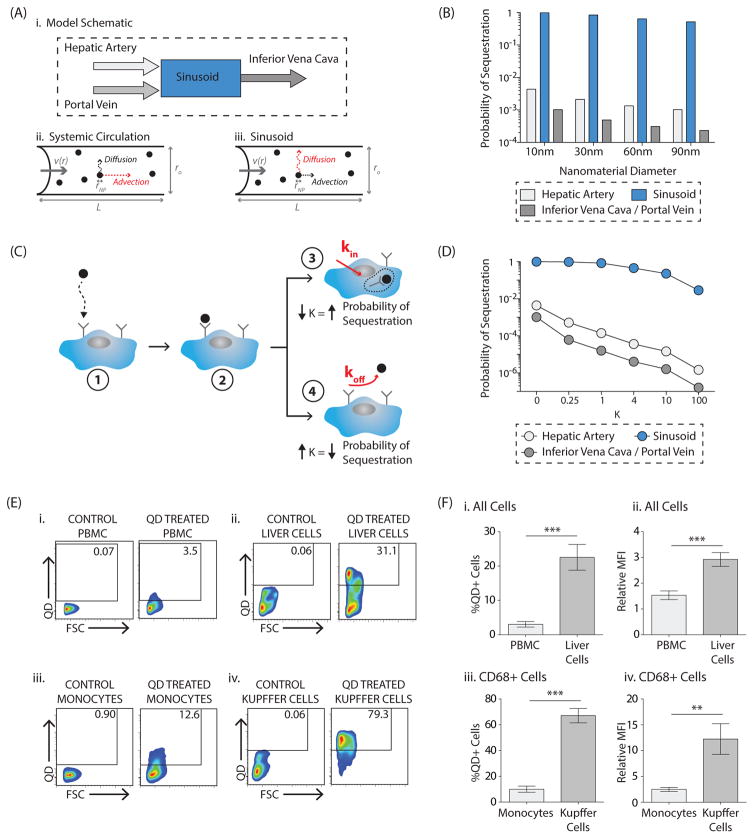
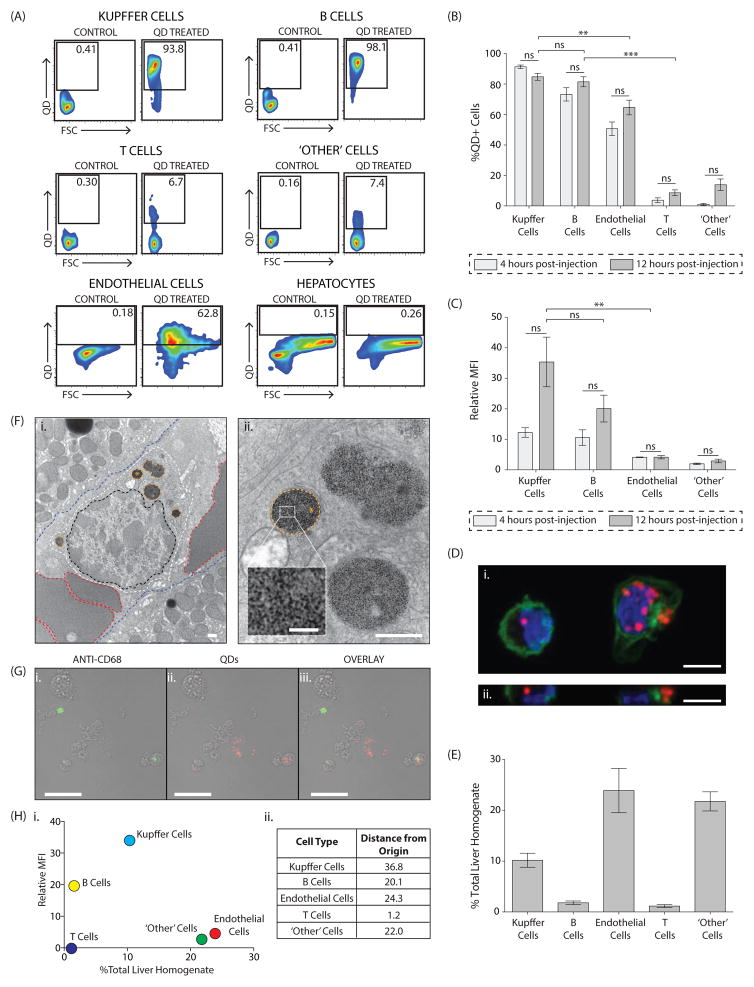
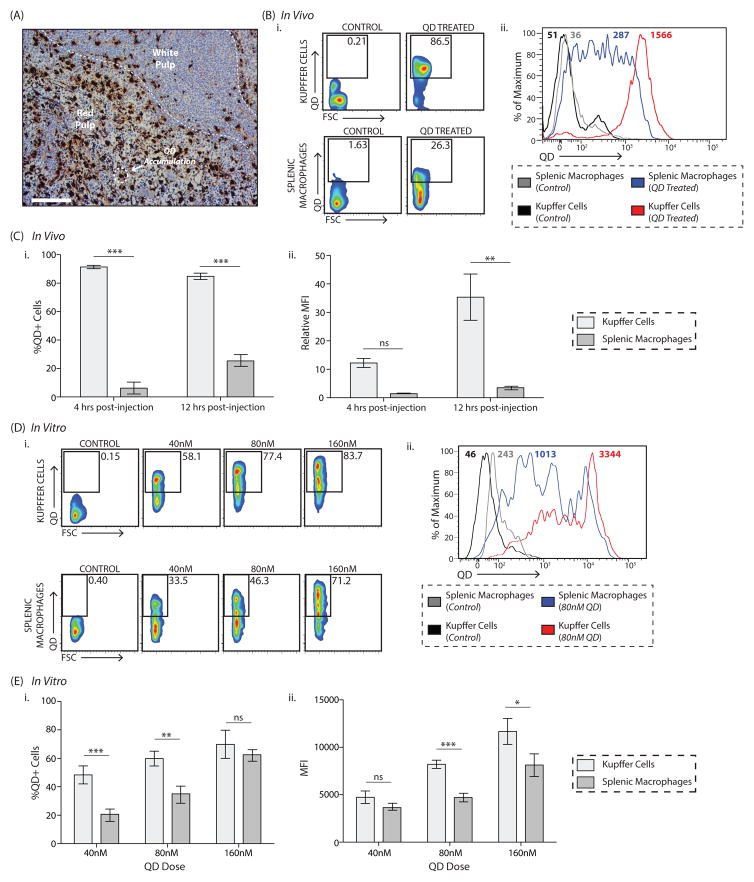
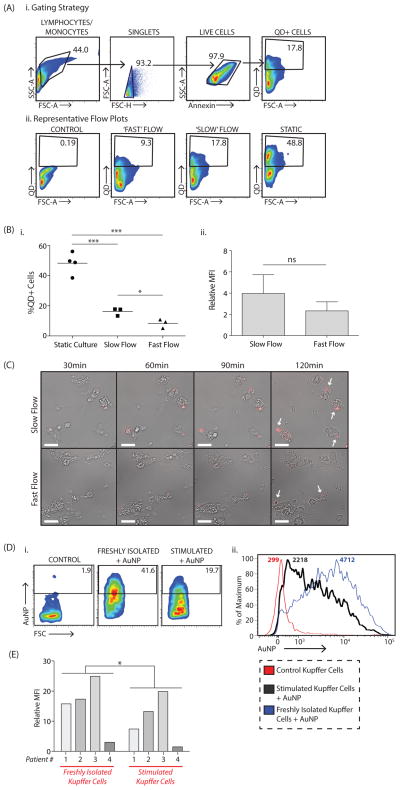
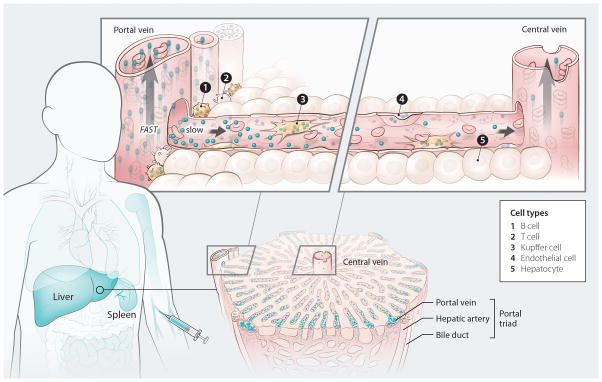
The liver and spleen are major biological barriers to translating nanomedicines because they sequester the majority of administered nanomaterials and prevent delivery to diseased tissue. Here we examined the blood clearance mechanism of administered hard nanomaterials in relation to blood flow dynamics, organ microarchitecture and cellular phenotype. We found that nanomaterial velocity reduces 1,000-fold as they enter and traverse the liver, leading to 7.5 times more nanomaterial interaction with hepatic cells relative to peripheral cells. In the liver, Kupffer cells (84.8 ± 6.4%), hepatic B cells (81.5 ± 9.3%) and liver sinusoidal endothelial cells (64.6 ± 13.7%) interacted with administered PEGylated quantum dots, but splenic macrophages took up less material (25.4 ± 10.1%) due to differences in phenotype. The uptake patterns were similar for two other nanomaterial types and five different surface chemistries. Potential new strategies to overcome off-target nanomaterial accumulation may involve manipulating intra-organ flow dynamics and modulating the cellular phenotype to alter hepatic cell interactions.


Figures

Figure 1
Figure 1. Distribution of quantum dots in the liver following systemic intravascular injection
A, Silver-stained section of a rat liver that was perfused four hours post-quantum dot injection (counter-stained with hematoxylin). Shown is one repeating unit of the liver microarchitecture. Blood flows into the liver via the hepatic artery and portal vein located in the portal triad. Blood flows out of the liver via the central vein. A zone with a radial distance of 100μm was traced around each vascular unit. Scale bar, 100μm. B, Overview of the image processing utilized to measure quantum dot accumulation in the zones bordering the portal triad and central vein. First, the zone surrounding each vascular structure was extracted using a radius of 100 3m from the vessel border. Second, the image was converted into a binary format and thresholded to isolate reduced silver. Finally, the area of each silver stain was measured along with its (x,y) coordinates relative to the center of the vessel. The area of reduced silver corresponds to the amount of quantum dot accumulation and is represented by a color spectrum where pale blue indicates a small amount of quantum dot accumulation and dark blue indicates a large amount of quantum dot accumulation in each individual location. C, Twenty-eight portal triad-central vein pairs were analyzed and the results combined. Scale bar, 100μm. D, Scatter plot comparing the area of each region of silver staining in the zone surrounding the portal triad versus in the zone surrounding the central vein. Corresponds to the data graphically illustrated in C. Statistical significance was evaluated using a two-tailed unpaired t-test (***P<0.001). Additional portal triad-central vein pairs are included in Supplementary Figure 4.
Figure 2
Figure 2. Nanomaterial sequestration in the liver versus in the systemic circulation: mathematical modeling and in vivo results
A, Model schematic (i). In the systemic circulation (e.g. hepatic artery, portal vein, inferior vena cava), advection due to blood flow is the dominant factor influencing nanomaterial transport (ii). In the liver sinusoid, diffusion due to Brownian motion is the dominant factor influencing nanomaterial transport (iii). B, Results of the mathematical model comparing the probability of a nanomaterial being sequestered in a liver sinusoid versus in the systemic circulation. An absorbing boundary condition on the vessel wall was utilized. Impact of nanomaterial size, between 10–90nm, is demonstrated. Numerical inputs to the model are included in Supplementary Table 1. C, Impact of imperfect adsorption was incorporated in the local sticking coefficient, K, where Kkoff kin. In the illustration, a nanomaterial reaches a cell by Brownian motion (1) and may bind to a cell receptor (2). There are then two possible scenarios. In (3), the nanomaterial has a higher probability of internalization into the cell cytoplasm, decreasing K and increasing the overall probability of sequestration. Alternatively, in (4), the nanomaterial has a higher probability of dissociation into the circulation, increasing K and decreasing the overall probability of sequestration. D, Results of the mathematical model probing the impact of varying values of K on the overall probability of sequestration in the systemic circulation and in the liver sinusoid for a 10nm nanomaterial. Impact of K on 30/60/90nm nanomaterials is included in Supplementary Figure 9. E, Representative flow plots comparing quantum dot uptake in vivo by cells in the peripheral blood (i, iii) versus in the liver (ii, iv) twelve hours post-injection. The first comparison is for all peripheral blood mononuclear cells (PBMCs, i) versus all cells in the total liver homogenate (ii). Full gating strategy is included in Supplementary Figure 10. The second comparison is for CD68+ monocytes (iii) with CD68+ Kupffer cells (iv). Shown are plots from the control vehicle-treated animal, ‘Control’, and the quantum dot-treated animal, ‘QD Treated’. Full gating strategy for uptake in CD68+ cells is included in Supplementary Figure 16A. F, Percentage of quantum dot-positive cells in the peripheral blood versus in the liver twelve hours after intravenous quantum dot injection (i, iii), where %QD+Cells = %QD+CellsQD Treated-%QD+CellsControl-Treated. In (i) quantum dot uptake in all PBMCs is compared with uptake in all total liver homogenate cells. In (iii) quantum dot uptake in monocytes is compared with uptake in Kupffer cells. Amount of quantum dot uptake for each cell type, where Relative Mean Fluorescence Intensity or Relative MFI=MFIQD-Treated/MFIControl-Treated. (ii, iv). Again, in (ii) the comparison is made for all cells while in (iv) the comparison is made for CD68+ cells (monocytes versus Kupffer cells). Plotted is the mean ± s.e.m. from 8 independent replicates. Statistical significance was evaluated using a two-tailed unpaired t-test (**P<0.01, ***P<0.001).
Figure 3
Figure 3. Characterization of in vivo quantum dot uptake in the liver
A, Representative flow plots illustrating quantum dot uptake in hepatic cell populations twelve hours post-injection. Shown are plots from the control vehicle-treated animal, ‘Control’, and the quantum dot-treated animal, ‘QD Treated’. Full gating strategy is included in Supplementary Figures 15, 16 and 17. Representative flow plots for the four-hour timepoint are included in Supplementary Figure 19. B, Percentage of each hepatic cell type that is quantum dot-positive at the four- and twelve-hour timepoints, where %QD+Cells = %QD+CellsQD-Treated-%QD+CellsControl-Treated. C, Amount of quantum dot uptake for each hepatic cell type at the four- and twelve-hour timepoints, where Relative Mean Fluorescence Intensity or Relative MFI=MFIQD-Treated/MFIControl-Treated. D, Confocal microscopy images demonstrating the intracellular location of quantum dots. Shown is a z-stack image of cells from the Kupffer cell-enriched fraction (i) and an orthogonal projection in the yz plane (ii). Nucleus is stained with Hoechst 33342 (blue), actin is stained with Alexa Fluor 488-labelled phalloidin (green), quantum dots appear red. Images were acquired with a 60× PlanApo oil objective (N.A 1.4) with the following excitation (ex) and emission (em) wavelengths: nuclei (λex=405nm; λem=442/35nm), actin (λex=473nm; λem=515/60nm), quantum dots (λex=559nm; λem=598/45nm). Scale bars, 5μm. E, Relative prevalence of hepatic cell types reported as a percentage of total cells in the liver homogenate. Full gating strategy is included in Supplementary Figure 21. For B,C and E, plotted is the mean ± s.e.m. from at least 6 independent replicates for the twelve-hour timepoint and 3 independent replicates for the four-hour timepoint. Statistical significance was evaluated using a two-tailed unpaired t-test (**P<0.01, ***P<0.001, ns = not significant or P>0.05). F, Transmission electron microscopy images demonstrating the presence of quantum dots within peri-nuclear membrane-bound structures in a hepatic lymphocyte-like cell twelve hours post-injection. Images of a Kupffer-like cell, an endothelial-like cell are included in Supplementary Figure 20. Shown is the location of the cell within the sinusoid (i) where the lymphocyte plasma membrane is traced in white, the nucleus in black and the quantum dot-containing membrane-bound intracellular vesicles in yellow. For orientation, red blood cells are traced in red and hepatocytes in blue. A high-resolution image of the quantum dot-containing vesicles is included in (ii) where the asterisk marks corresponding structures. The inset demonstrates individual quantum dots. Scale bars in (i) and (ii), 500nm. Scale bar in inset, 100nm. G, Confocal images demonstrating anti-CD68 staining in quantum dot-positive and negative cells. Cells from the Kupffer cell-enriched fraction of a quantum dot-treated animal were stained with an Alexa Fluor 647-labelled anti-CD68 antibody. Shown are antibody staining only (i), quantum dot uptake only (ii) and an overlay of both channels (iii). The anti-CD68 antibody appears green, quantum dots appear red and co-staining is yellow. Images were acquired with a 60× PlanApo oil objective (N.A 1.4), a zoom of 1.4× with the following excitation (ex) and emission (em) wavelengths: quantum dots (λex=559nm; λem=598/45nm), anti-CD68 (λex=635nm; λem=705/100nm). Images were overlayed and pseudo-color assigned in ImageJ. Scale bars, 30 μm. H, The relative importance of each hepatic cell type to quantum dot uptake in the liver as measured by the Distance from Origin, where: DistancefromOrigin=(RelativeMFI)2+(%TotalLiverHomogenate)2.Hepatocytes are not represented, as quantum dot uptake was not detected.
Figure 4
Figure 4. Quantum dot uptake in the liver versus in the spleen: in vivo and in vitro results
A, Quantum dot uptake in the spleen occurs primarily in the red pulp. Quantum dots are identified via silver staining (hematoxylin counter-stain). Scale bar, 100μm. B, Representative flow plots demonstrating the difference in quantum dot uptake between Kupffer cells and splenic macrophages twelve hours post-quantum dot injection (i). Corresponding histograms showing the Mean Fluorescence Intensity (MFI) are included in (ii). Shown are plots from the control vehicle-treated animal, ‘Control’, and the quantum dot-treated animal, ‘QD Treated’. Full gating strategy is included in Supplementary Figure 16. Representative flow plots from the four-hour timepoint are included in Supplementary Figure 27. C, Percentage of quantum dot-positive Kupffer cells and splenic macrophages four- and twelve-hours post-quantum dot injection (i), where %QD+Cells = %QD+CellsQD-Treated-%QD+CellsControl-Treated. The amount of quantum dots taken up by both cell types is shown in (ii), where Relative Mean Fluorescence Intensity or Relative MFI=MFIQD-Treated/MFIControl-Treated. Plotted is the mean ± s.e.m. from at least 6 independent replicates for the twelve-hour timepoint and 3 independent replicates for the four-hour timepoint. Statistical significance was evaluated using a two-way ANOVA with a Bonferroni post-test (**P<0.01, ***P<0.001, ns = not significant or P>0.05). D, Representative flow plots identifying quantum dot-positive Kupffer cells and splenic macrophages. Isolated cells were either left untreated or incubated with 40/80/160nM quantum dots. Four incubation times were investigated; shown is the six-hour timepoint. Full gating strategy is included in Supplementary Figure 11 (i). Representative histograms showing the Mean Fluorescence Intensity (MFI) in the QD channel at baseline and after a six-hour incubation with 80nM quantum dots are included in (ii). E, Percentage of quantum dot-positive cells (i) and amount of quantum dot uptake (MFI, ii) for each cell type six hours post-incubation with 40nM/80nM/160nM quantum dots. %QD+Cells = %QD+CellsQD-Treated-%QD+CellsUntreated. Full time-course is included in Supplementary Figure 28. Plotted is the mean ± s.e.m. from 3 independent replicates. Statistical significance was evaluated using a two-way ANOVA with a Bonferroni post-test for the complete time-course (*P<0.05, ns = not significant or P>0.05).
Figure 5
Figure 5. Nanomaterial uptake by Kupffer cells can be reduced by manipulating flow rate and cellular phenotype
Quantum dot uptake by primary rat Kupffer cells was compared under three conditions, traditional cell culture in a Petri dish (‘static’) or in a microfluidic chip with two different flow rates, ‘fast’ flow at 8mL/min and ‘slow’ flow at 0.6mL/min. A, Flow cytometry plots demonstrating the gating strategy (i) and representative plots showing differences in uptake between ‘static’, ‘fast’ and ‘slow’ flow conditions (ii). B, Percentage of quantum dot-positive, Annexin-negative (i.e. live) Kupffer cells under the three conditions (i). Amount of quantum dots taken up by Kupffer cells in each condition where, %QD+Cells = %QD+CellsQD-Treated-%QD+CellsUntreated and Relative Mean Fluorescence Intensity or Relative MFI=MFIQD-Treated/MFIUntreated (ii). Plotted is the mean ± s.e.m. from 3 independent replicates. Statistical significance was evaluated using a two-tailed unpaired t-test (*P<0.05, **P<0.01, ns = not significant or P>0.05). C, Time-lapse images comparing uptake under ‘slow’ and ‘fast’ flow conditions. Quantum dots are shown in red and are marked with a white arrow in the last frame. Images were acquired with a 10X DIC Fluar objective (N.A. 0.5) with the following excitation (ex) and emission (em) wavelengths for the quantum dots: λex=470nm; λem=605/70nm. Videos for quantum dots uptake under ‘slow’ and ‘fast’ flow conditions are included in Supplementary Videos 1,2. D, Primary human Kupffer cells were either left untouched, ‘Freshly Isolated’, or stimulated using a cytokine cocktail, ‘Stimulated’. Cells were then incubated with fluorescent gold nanoparticles for four hours. Representative flow plots (i) and histograms (ii) showing the reduction in nanomaterial uptake following stimulation. E, Amount of nanomaterial uptake by freshly isolated versus stimulated human Kupffer cells, where Relative Mean Fluorescence Intensity or Relative MFI=MFIAuNP Treated/MFIUntreated. Plotted are the values for cells taken from four separate patients. Statistical significance was evaluated using a two-tailed paired t-test (*P<0.05).
Figure 6
Figure 6. Mechanism of nanomaterial transport in the liver
Nanomaterials injected into the bloodstream encounter the mononuclear phagocyte system (MPS), a group of organs that contain phagocytic cells. The intensity of the blue color in the figure reflects the degree of nanomaterial uptake within each MPS organ (see outline of human body, left). As the nanomaterials transition from the peripheral circulation to the liver, their velocity reduces 1000-fold. This allows the nanomaterials to interact with a variety of cells, resulting in their gradual clearance from the bloodstream. There is a concentration gradient of nanomaterials along the length of the sinusoid and the amount leaving the liver through the central vein is lower than the amount that enters via the portal triad (see image of liver lobule, bottom right). B and T cells border the portal triad and are exposed to a high concentration of incoming nanomaterials (see schematic of a liver sinusoid, top right). The difference in nanomaterial uptake between these cell types is due to the increased endocytic/phagocytic capacity of B cells compared with T cells. Nanomaterials that escape the first set of cellular interactions move along the sinusoid and can come into contact with endothelial and Kupffer cells. Hepatocytes are separated from the bloodstream by a layer of fenestrated endothelial cells and do not take up nanomaterials. Nanomaterials that escape uptake during a pass through the liver return to the systemic circulation via the central vein and are ultimately carried back to the liver (or another MPS organ). This process repeats itself until nanomaterial clearance from the bloodstream is complete.

Comment in

References

    1. Kim BY, Rutka JT, Chan WC. Nanomedicine. New Engl J Med. 2010;363:2434–2443. - PubMed
    1. Veiseh O, Tang BC, Whitehead KA, Anderson DG, Langer R. Managing diabetes with nanomedicine: challenges and opportunities. Nat Rev Drug Discov. 2014;14:45–57. - PMC - PubMed
    1. Mulder WJM, Jaffer FA, Fayad ZA, Nahrendorf M. Imaging and nanomedicine in inflammatory atherosclerosis. Sci Transl Med. 2014;6:239sr1–239sr1. - PMC - PubMed
    1. Nasongkla N, et al. Multifunctional polymeric micelles as cancer-targeted, MRI-ultrasensitive drug delivery systems. Nano Lett. 2006;6:2427–2430. - PubMed
    1. Jaiswal JK, Mattoussi H, Mauro JM, Simon SM. Long-term multiple color imaging of live cells using quantum dot bioconjugates. Nat Biotechnol. 2002;21:47–51. - PubMed

Publication types