. 2016 Sep;18(9):979-92.
doi: 10.1038/ncb3397. Epub 2016 Aug 15.

NOTCH1 mediates a switch between two distinct secretomes during senescence

Affiliations

NOTCH1 mediates a switch between two distinct secretomes during senescence

Matthew Hoare et al. Nat Cell Biol. 2016 Sep.

Abstract

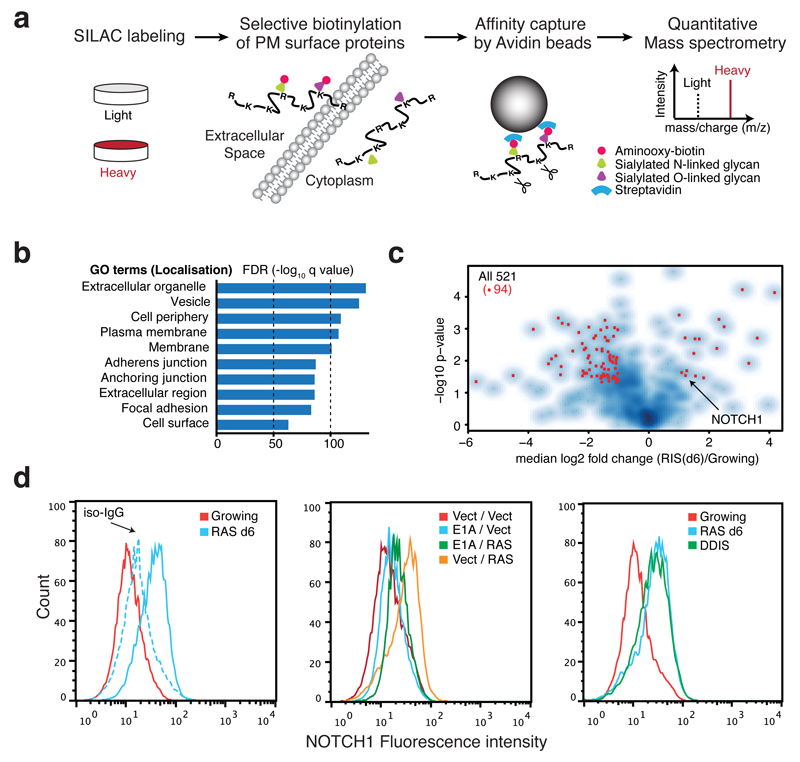
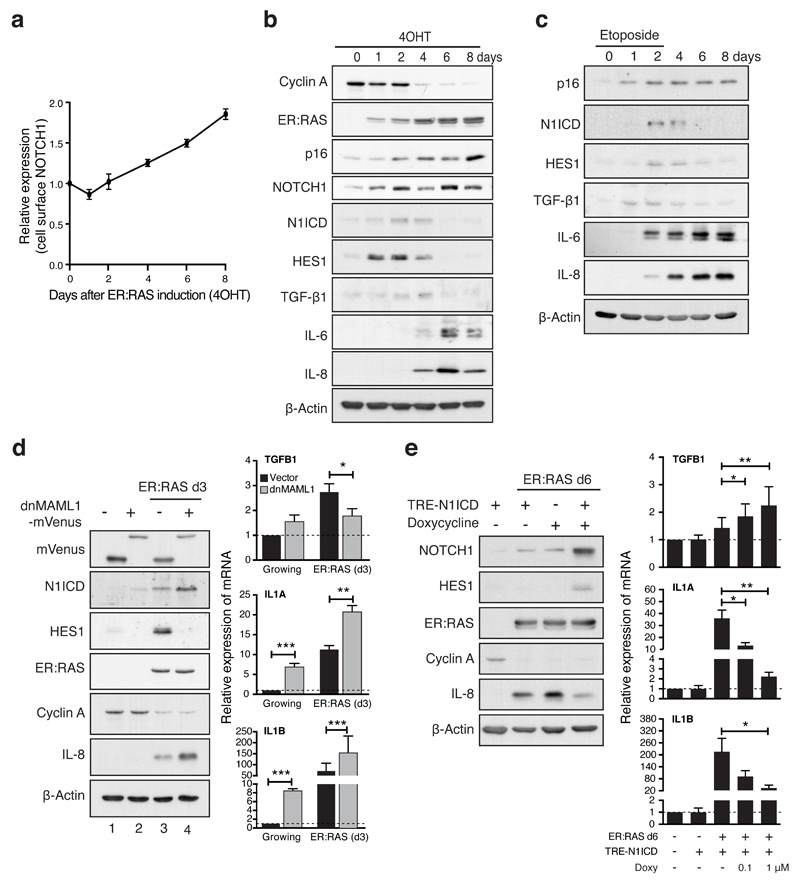
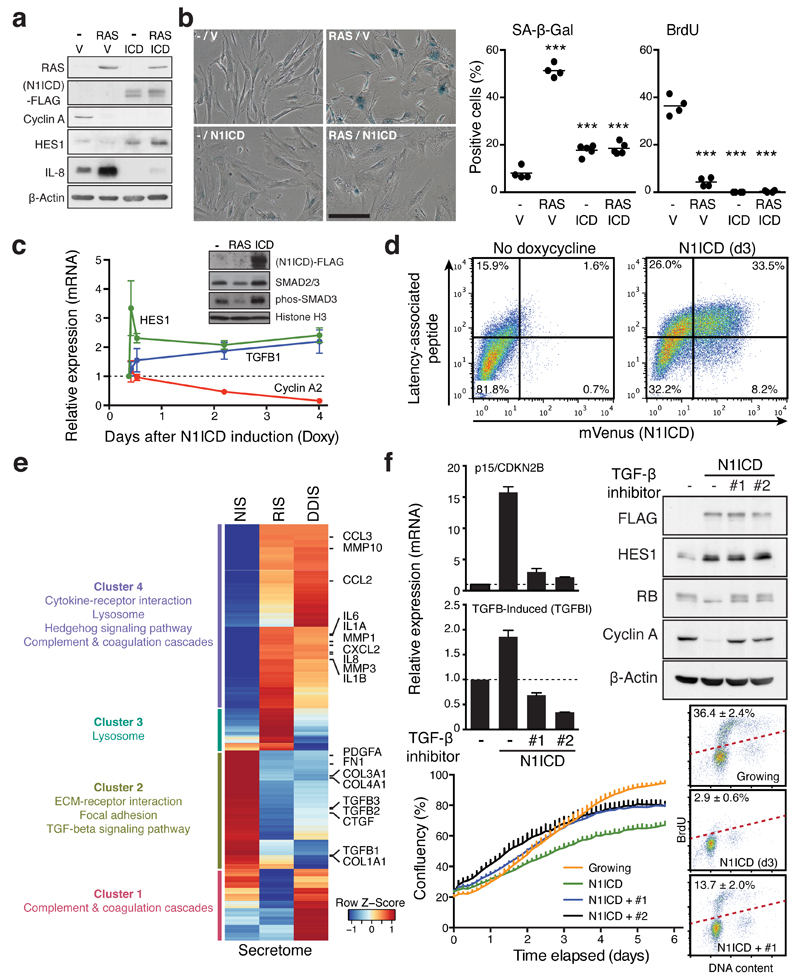
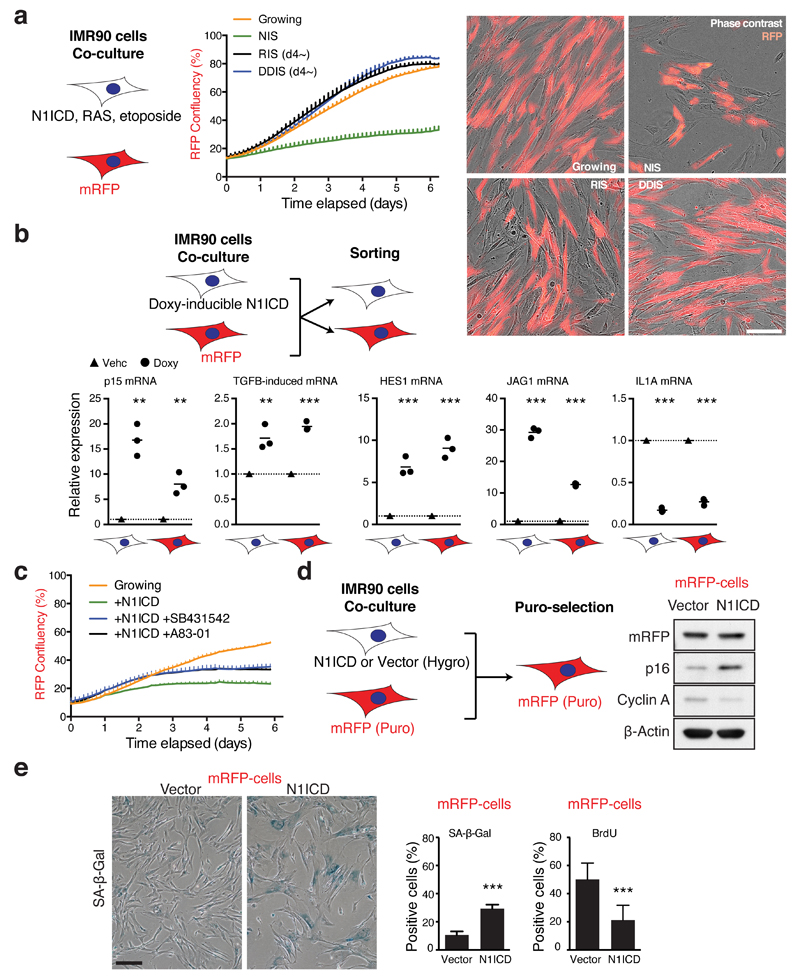
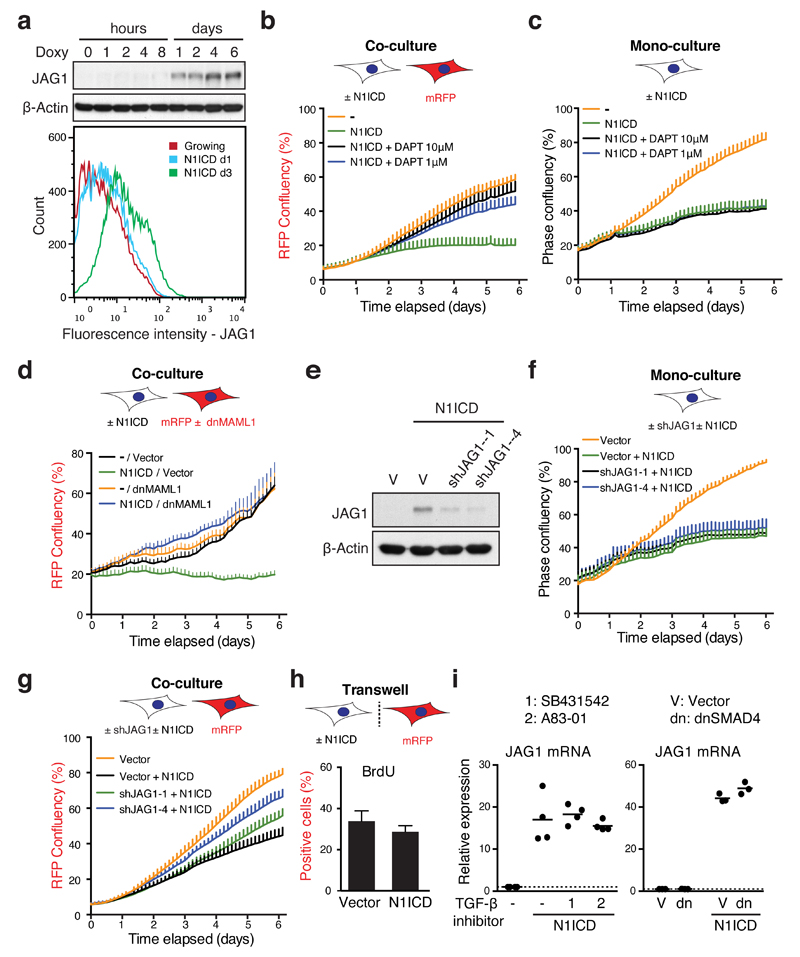
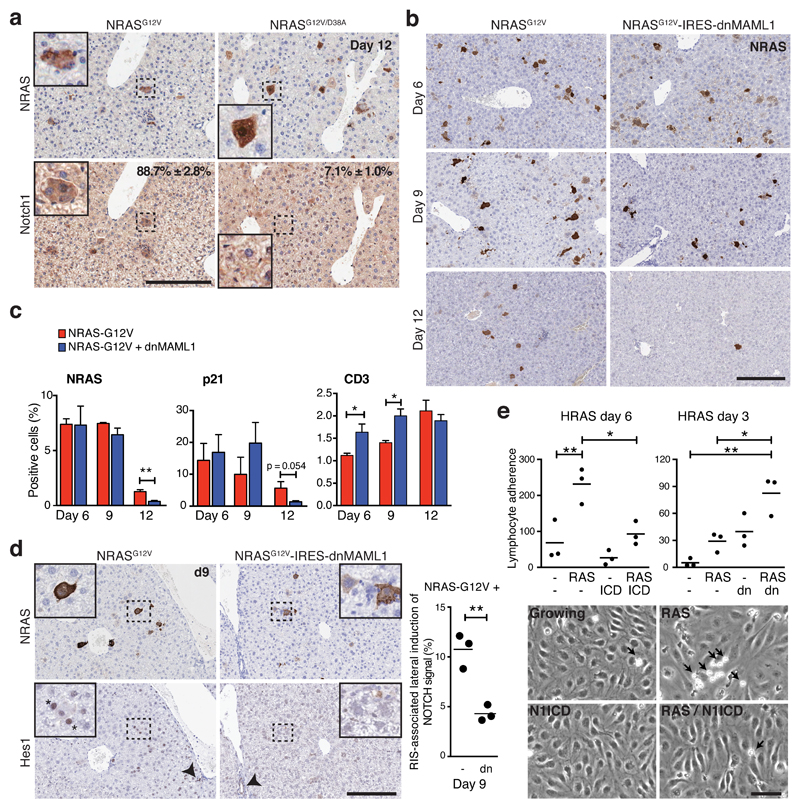
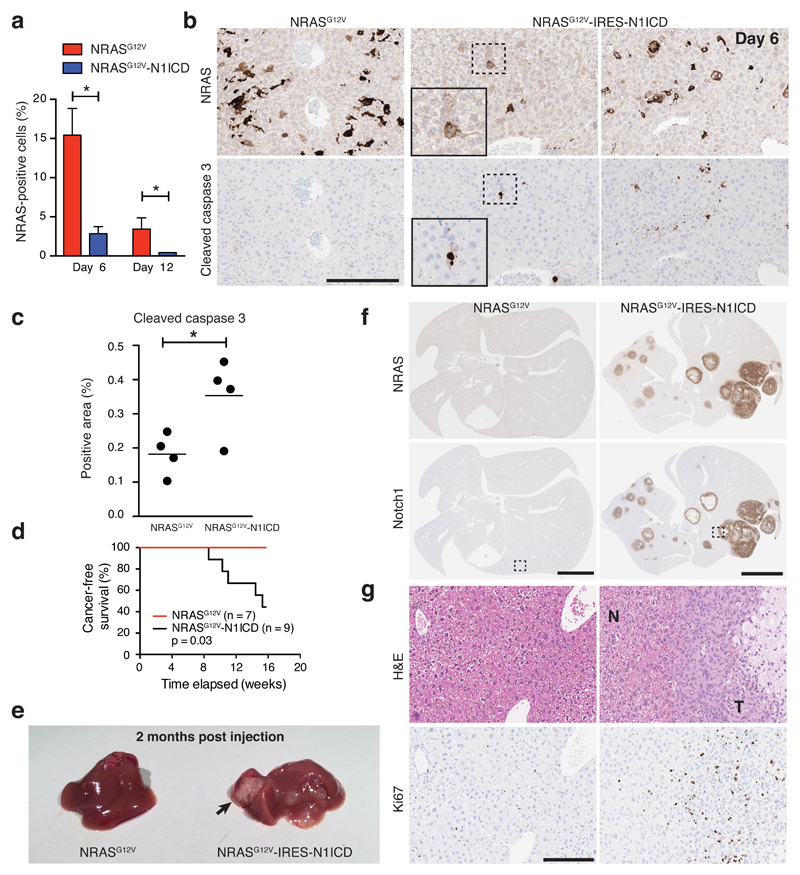
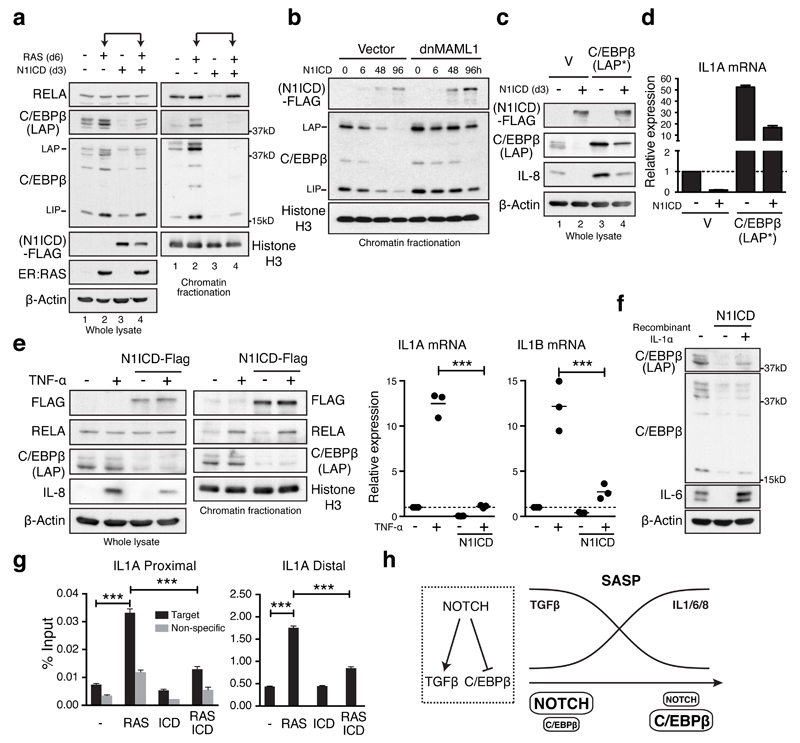
Senescence, a persistent form of cell-cycle arrest, is often associated with a diverse secretome, which provides complex functionality for senescent cells within the tissue microenvironment. We show that oncogene-induced senescence is accompanied by a dynamic fluctuation of NOTCH1 activity, which drives a TGF-β-rich secretome, while suppressing the senescence-associated pro-inflammatory secretome through inhibition of C/EBPβ. NOTCH1 and NOTCH1-driven TGF-β contribute to 'lateral induction of senescence' through a juxtacrine NOTCH-JAG1 pathway. In addition, NOTCH1 inhibition during senescence facilitates upregulation of pro-inflammatory cytokines, promoting lymphocyte recruitment and senescence surveillance in vivo. As enforced activation of NOTCH1 signalling confers a near mutually exclusive secretory profile compared with typical senescence, our data collectively indicate that the dynamic alteration of NOTCH1 activity during senescence dictates a functional balance between these two distinct secretomes: one representing TGF-β and the other pro-inflammatory cytokines, highlighting that NOTCH1 is a temporospatial controller of secretome composition.


Figures

Figure 1
Figure 1. Plasma membrane proteomics (PMP) defines NOTCH1 as upregulated in OIS.
(a) The workflow for quantitative PMP using differential SILAC labelling of growing and HRASG12V-induced senescent (RIS) IMR90 cells. (b) GO cellular compartment term enrichment for all 1502 identified proteins in both conditions. (c) Volcano plot of 521 high-confidence protein identifications from PMP demonstrating log2 fold change (RIS(d6) / Growing) against negative log10 p value (n = 4 independent experiments). Among 167 proteins differentially expressed during RIS (p<0.05), red dots indicate 94 proteins with more than two fold change. (d) Cell surface NOTCH1 expression by flow-cytometry in indicated IMR90 cells: left, ER:HRASG12V cells with (d6) or without (Growing) 4OHT, iso-IgG, isotype control IgG; centre, cells with constitutive overexpression of either HRASG12V, E1A, or both; right, DNA damage-induced senescence (DDIS). To establish DDIS, cells were treated with 100μM Etoposide for 2 days, followed by 5-days incubation in drug-free medium.
Figure 2
Figure 2. Dynamic canonical NOTCH1 signalling is responsible for reciprocal regulation of TGF-β ligands and pro-inflammatory cytokines during senescence.
(a) Time series analysis of cell surface NOTCH1 expression during RIS in IMR90 cells by flow cytometry. Values are means relative to d0 ± SEM from 3 independent experiments. (b and c) Time course of protein expression by immunoblotting during RIS (b) or DDIS (c). (d) ER:HRASG12V IMR90 cells, expressing dnMAML1-mVenus or matched control, were incubated with or without 4OHT for 3 days and analysed for expression of indicated mRNA and proteins by qRT-PCR and immunoblotting respectively; n = 5 biologically independent experiments for TGFB1 and IL1B, n = 4 biologically independent experiments for IL1A; unpaired T-test. (e) ER:HRASG12V IMR90 cells, expressing a doxycycline-inducible N1ICD-FLAG construct (TRE-N1ICD) were analysed after 6 days treatment with 4OHT with or without doxycycline at indicated concentrations from d3 by qRT-PCR and immunoblotting; n = 6 biologically independent experiments for all conditions (except 4OHT / 1 μM Doxy where n = 5); unpaired T-test. Values are mean ± SEM; *P ≤ 0.05, **P ≤ 0.01, ***P ≤ 0.001. Statistics source data for a, d & e are provided in Supplementary Table 2.
Figure 3
Figure 3. NOTCH1 drives a cell-autonomous senescence with a distinct secretory profile.
(a and b) ER:HRASG12V IMR90 cells, stably expressing N1ICD-FLAG or control vector (V), were incubated with or without 4OHT for 6 days and analysed for expression of indicated proteins by immunoblotting (a), SA-β-gal and BrdU incorporation (b). One way ANOVA with Dunnett's multiple comparison test; bars are means of ≥200 cells, n = 4 biologically independent experiments. ***P ≤ 0.001 versus control cells. Scale bar 100μm. (c) Time series analysis of indicated transcripts after doxycycline (Doxy) induction in TRE-N1ICD-FLAG IMR90 cells by qRT-PCR. Values are mean ± SEM, n = 3 biologically independent experiments. Inset, immunoblotting of fractionated chromatin in IMR90 cells expressing HRASG12V (d6) or TRE-N1ICD-FLAG (d3) for downstream TGF-β phosphorylation-target SMAD3 (phos-SMAD3). (d) TRE-N1ICD-mVenus IMR90 cells with or without 3 days of doxycycline were analysed for cell surface expression of the TGFB1 gene product latency-associated peptide by flow cytometry. (e) Differentially expressed transcripts in N1ICD-, HRASG12V- or Etoposide-induced senescent IMR90 cells (NIS, RIS, or DDIS, respectively), compared to normal control cells. Heat map shows z-score normalised fold changes of 1150 secretome genes differentially expressed in at least in one comparison. Representative KEGG pathways enriched in four clusters (False discovery rate (FDR) < 0.01) are shown. (f) TRE-N1ICD-FLAG IMR90 cells treated with or without doxycycline for 3 days with or without TGF-β receptor antagonists (#1, SB431542; #2, A83-01) were analysed by qRT-PCR and immunoblotting for the indicated mRNA and proteins in addition to proliferation and cell cycle analyses. Values are mean ± SEM, n = 5 biologically independent experiments for CDKN2B; n = 4 biologically independent experiments for TGFBI. Statistics source data for b, c & f are provided in Supplementary Table 2.
Figure 4
Figure 4. NOTCH1 drives non-cell-autonomous senescence partly dependent upon TGF-β.
(a) The proliferative ability of mRFP cells was analysed during co-culture with unlabelled senescent cells by proliferation analysis; representative images demonstrating co-cultured cells. Scale bar 150 μm. NIS, doxycycline was added at d0 to induce N1ICD; RIS, ER:HRASG12V was pre-induced for 4 days before co-culture; DDIS, senescence was induced by etoposide as in Figure 2C for 4 days before co-culture. (b) mRFP cells were co-cultured with doxycycline-inducible TRE-N1ICD cells treated with or without doxycycline for 3 days prior to flow sorting and expression analysis of the 2 cell populations for the indicated transcripts by qRT-PCR; unpaired T-test; bars are means, n = 3 independent biological replicates. (c) The proliferative ability of mRFP IMR90 cells was analysed during co-culture with TRE-N1ICD IMR90 cells treated with or without doxycycline and TGF-β receptor antagonists; representative result from 5 biologically independent experiments with similar results. (d and e) mRFP (puromycin-resistant) cells were co-cultured with cells stably expressing N1ICD-FLAG (hygromycin-resistant) for 7 days prior to puromycin selection to selectively remove N1ICD-expressing cells, yielding populations that were ~99% mRFP-positive by flow cytometry. mRFP cells were then analysed for expression of indicated proteins by immunoblotting (d), SA-β-gal and DNA synthesis by BrdU incorporation (e); unpaired T-test; values are mean ± SEM of ≥200 cells from 8 high power fields, n = 7 biologically independent experiments. *P ≤ 0.05, **P ≤ 0.01, ***P ≤ 0.001. Scale bar 200 μm. Statistics source data for b & e are provided in Supplementary Table 2.
Figure 5
Figure 5. NOTCH1 drives juxtacrine senescence through JAG1-mediated lateral induction in IMR90 cells.
(a) Time series analysis of JAG1 expression by immunoblotting (upper) and at the cell surface by flow cytometry (lower) after doxycycline induction in TRE-N1ICD cells. (b) The proliferative ability of mRFP cells was analysed during co-culture with TRE-N1ICD cells treated with or without doxycycline and the gamma secretase inhibitor DAPT at indicated concentrations; representative result from 4 biologically independent experiments with similar results. (c) The proliferative ability of TRE-N1ICD cells was analysed with or without doxycycline and DAPT at indicated concentrations; representative result from 4 biologically independent experiments with similar results. (d) The proliferative ability of mRFP cells with stable expression of dnMAML1-mVenus or mVenus alone was analysed during co-culture with TRE-N1ICD cells treated with or without doxycycline; representative result from 4 biologically independent experiments with similar results. (e and f) Expression of JAG1 and proliferation of TRE-N1ICD cells stably expressing vector or indicated shRNAs targeting JAG1, demonstrated by immunoblot (e) and proliferation analysis with or without doxycycline (f); representative result from 4 biologically independent experiments with similar results. (g) The proliferative ability of mRFP cells was analysed during co-culture with TRE-N1ICD cells with or without sh-JAG1 and with or without doxycycline. (h) mRFP cells were analysed for BrdU incorporation, when physically separated from TRE-N1ICD cells treated with or without doxycycline in a transwell chamber; unpaired T-test; ≥200 cells from 8 high power fields; n = 5 independent biological replicates. (i) TRE-N1ICD cells treated with or without doxycycline and TGF-β receptor antagonists (left) or co-transfected with vector or dnSMAD4 (right) were analysed for JAG1 expression by qRT-PCR; n = 3 biologically independent experiments; 1, SB431542; 2, A83-01. One way ANOVA with Dunnett's multiple comparison test (left) or unpaired t-test (right); bars are means (h and i) ± SEM (h). Statistics source data for h & i are provided in Supplementary Table 2.
Figure 6
Figure 6. NOTCH1 is dynamically upregulated within NRAS-senescent hepatocytes and inhibits senescence surveillance.
(a) Livers were harvested from mice 12 days after hydrodynamic tail vein injection of NRASG12V or inactive NRASG12V/D38A-bearing transposons and analysed by immunohistochemistry for NRAS and Notch1 expression in serial sections; Quantification of NRAS+ hepatocytes expressing NOTCH1; values are mean ± SEM from manual counting of ≥200 cells; n = 3 mice per condition. Insets, magnified pictures of dotted rectangular areas. Scale bar 200 μm. (b) Time series analysis of hepatic NRAS-expression by immunohistochemistry after injection of NRASG12V(-IRES-mVenus) or NRASG12V-IRES-dnMAML1(-mVenus). Scale bar 200 μm. (c) Quantification of NRAS, p21, or CD3 (T-lymphocyte marker) positive cells within livers of mice treated as in (b); unpaired T-test; values are mean ± SEM from manual counting (NRAS) or automated image analysis of ≥105 cells (p21 / CD3) from liver sections (see METHODS); for NRASG12V injected animals at D6, 9 & 12, n = 3, 3 & 4 mice respectively; for NRASG12V-IRES-dnMAML1 injected animals at D6, 9 & 12, n = 4, 3 & 5 mice respectively; *P ≤ 0.05, **P ≤ 0.01. (d) Lateral induction of Notch signalling in mouse livers treated as in (b). Representative immunohistochemistry of NRAS and Hes1 at d9 in serial sections. Insets, magnified pictures of dotted rectangle areas. Asterisk demonstrates Hes1-expressing, NRAS-negative cells adjacent to NRAS-expressing hepatocytes. Arrowheads demonstrate positive internal control staining of Hes1 within cholangiocytes. The percentage of NRAS-positive cells with adjacent Hes1-positive (but not NRAS) were manually counted; n = 3 mice per condition; bars are means; unpaired T-test. Similar results were also obtained using dual staining in the same section (Supplemental Fig. 6C). Scale bar 200 μm. (e) Flow-based assay of peripheral blood lymphocyte (PBL) adherence (cells/mm2/106) to human liver sinusoidal endothelial cells (HSEC) from 3 separate individuals pre-incubated with conditioned media (CM) from IMR90 cells expressing ER:HRASG12V and TRE-N1ICD with or without 4OHT (d6) and/or doxycycline (d3) (left; n = 3 biologically independent replicates or CM from ER:HRASG12V IMR90 cells, expressing dnMAML1-mVenus or matched control and incubated with or without 4OHT for 3 days (right; n = 3 biologically independent replicates) (see Supplementary Fig. 7A, B). Representative images (bottom) demonstrating adherent PBLs (arrows) to HSEC after pre-incubation with indicated CM. One way ANOVA with Dunnett's multiple comparison test; bars are mean; *P ≤ 0.05, **P ≤ 0.01. Scale bar 50μm. Statistics source data for a, c, d & e are provided in Supplementary Table 2.
Figure 7
Figure 7. Co-expression of NRASG12V and N1ICD drives short-term apoptosis and long-term tumourigenesis in the liver.
(a-c) Livers from mice injected with either NRASG12V or NRASG12V-IRES-N1ICD were subjected to IHC for NRAS and cleaved caspase 3 staining at the indicated time points in serial sections. Relatively fewer NRAS-positive hepatocytes were detected in the NRASG12V-IRES-N1ICD cohort (a), and these NRAS-positive cells were mostly positive for cleaved caspase 3 (d6) (b, c). Insets are magnified pictures of dotted rectangular areas (b). Bars are means from automated image analysis of ≥105 cells from each liver section; D6 NRASG12V n = 4 mice, D12 NRASG12V n = 6 mice, D6 NRASG12V-IRES-N1ICD n = 4 mice, D12 NRASG12V-IRES-N1ICD n = 7 mice; unpaired t-test. Scale bar 200 μm. (d) Mice injected with NRASG12V (n = 7 mice) or NRASG12V-IRES-N1ICD (n = 9 mice) underwent long-term follow-up; necropsy was performed in all to confirm the presence of liver tumours. Kaplan-Meier plots of cancer-free survival from the 2 cohorts; survival analysis by Log-rank test. (e) Example images of gross liver pathology at 2 months post-HDTV injection of one mouse from each cohort revealing a large tumour (long black arrow) and multiple small cystic lesions in the liver injected with NRASG12V-IRES-N1ICD. (f - g) Immunohistochemical and H&E staining of serial liver sections from each cohort for the indicated proteins. H&E staining demonstrating tumour (T) infiltrating the surrounding normal parenchyma (N) and strong tumoural immunohistochemical staining for the proliferative marker ki67 in serial sections (g). Images in (g) are magnified views of dotted rectangular areas in (f). *P ≤ 0.05, **P ≤ 0.01. Scale bar upper panels 5mm, lower panels 200 μm. Statistics source data for a & c are provided in Supplementary Table 2.
Figure 8
Figure 8. NOTCH1 controls the pro-inflammatory SASP through repression of C/EBPβ.
(a) ER:HRASG12V/TRE-N1ICD-FLAG IMR90 cells treated with or without 6 days of 4OHT and 3 days of doxycycline were analysed for expression of RELA and C/EBPβ in whole cell lysate and fractionated chromatin by immunoblotting. (b) Time series analysis of chromatin-bound N1ICD-FLAG and C/EBPβ after doxycycline treatment of TRE-N1ICD IMR90 cells with or without dnMAML1. (c and d) TRE-N1ICD IMR90 cells with or without ectopic C/EBPβ-LAP* and 3 days of doxycycline treatment were analysed for C/EBPβ, IL-8 (c) and IL1A (d) expression by immunoblot and qRT-PCR; n = 3 biologically independent experiments. (e) TRE-N1ICD IMR90 cells treated with or without doxycycline for 3 days, then with or without 100ng/ml TNF-α for 1 hour were analysed for expression and chromatin binding of indicated mRNA and proteins by qRT-PCR and immunoblot respectively; unpaired T-test; n = 3 biologically independent experiments; bars are means. (f) TRE-N1ICD IMR90 cells treated with or without doxycycline for 3 days, and 10ng/ml IL-1α for the final 24 hours were analysed by immunoblotting. (g) ER:HRASG12V- and TRE-N1ICD-FLAG-expressing IMR90 cells treated with or without 6 days of 4OHT and 3 days of doxycycline were subjected to chromatin immunoprecipitation of endogenous C/EBPβ and subsequent qPCR for proximal and distal sites at the IL1A locus (Supplemental Figure 8E and METHODS); n = 3 biologically independent experiments; One way ANOVA with Dunnett's multiple comparison test; values are mean ± SEM. (h) Model for NOTCH-mediated SASP switch during senescence. *P ≤ 0.05, **P ≤ 0.01, ***P ≤ 0.001. Statistics source data for d, e & g are provided in Supplementary Table 2.

References

    1. Campisi J. Aging, cellular senescence, and cancer. Annu Rev Physiol. 2013;75:685–705. - PMC - PubMed
    1. Kuilman T, Peeper DS. Senescence-messaging secretome: SMS-ing cellular stress. Nat Rev Cancer. 2009;9:81–94. - PubMed
    1. Childs BG, Durik M, Baker DJ, van Deursen JM. Cellular senescence in aging and age-related disease: from mechanisms to therapy. Nat Medicine. 2015;21:1424–1435. - PMC - PubMed
    1. Acosta JC, et al. A complex secretory program orchestrated by the inflammasome controls paracrine senescence. Nat Cell Biol. 2013;15:978–990. - PMC - PubMed
    1. Hubackova S, Krejcikova K, Bartek J, Hodny Z. IL1- and TGFβ-Nox4 signaling, oxidative stress and DNA damage response are shared features of replicative, oncogene-induced, and drug-induced paracrine 'Bystander senescence'. Aging (Albany NY) 2012;4:932–951. - PMC - PubMed

Publication types