Comparative Study
. 2016 Aug 15;11(8):e0160711.
doi: 10.1371/journal.pone.0160711. eCollection 2016.

Comparative Single-Cell Analysis of Different E. coli Expression Systems during Microfluidic Cultivation

Affiliations
Comparative Study

Comparative Single-Cell Analysis of Different E. coli Expression Systems during Microfluidic Cultivation

Dennis Binder et al. PLoS One. .

Abstract

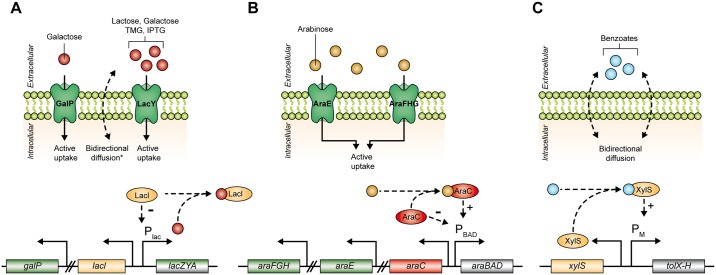
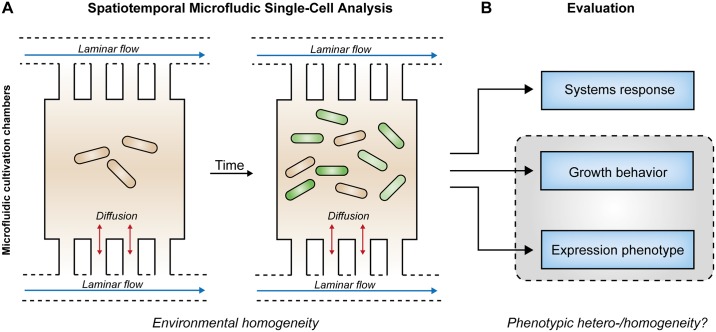
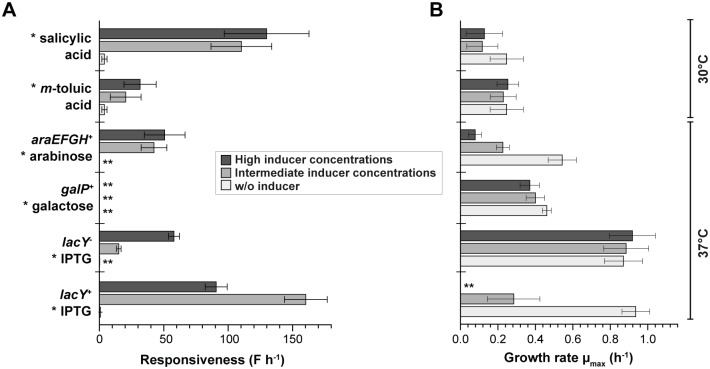
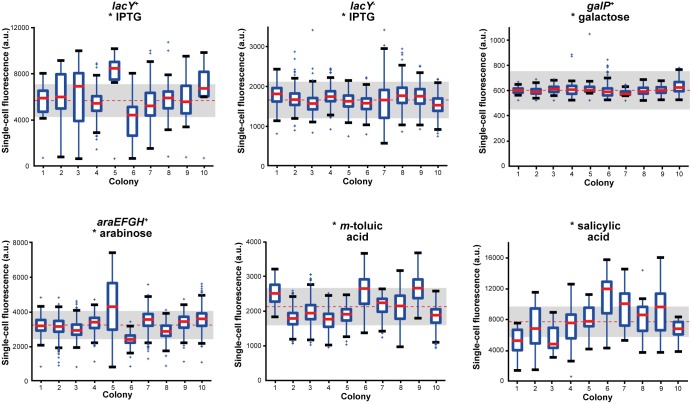
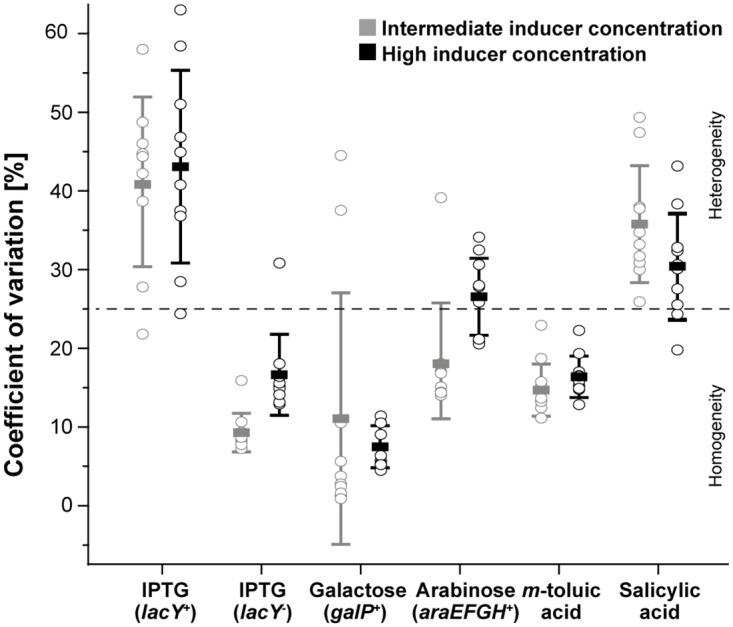
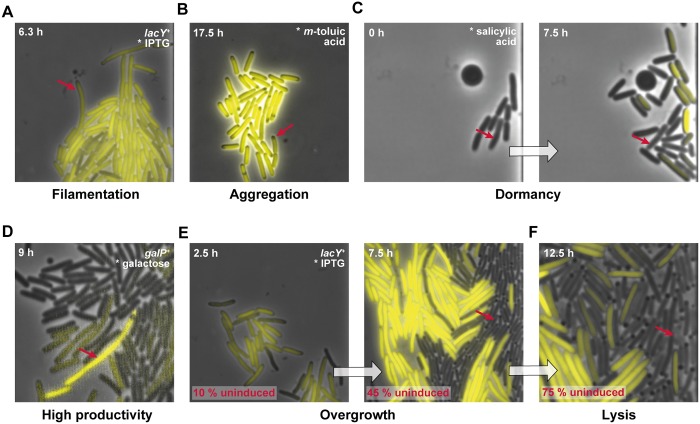
Recombinant protein production is mostly realized with large-scale cultivations and monitored at the level of the entire population. Detailed knowledge of cell-to-cell variations with respect to cellular growth and product formation is limited, even though phenotypic heterogeneity may distinctly hamper overall production yields, especially for toxic or difficult-to-express proteins. Unraveling phenotypic heterogeneity is thus a key aspect in understanding and optimizing recombinant protein production in biotechnology and synthetic biology. Here, microfluidic single-cell analysis serves as the method of choice to investigate and unmask population heterogeneities in a dynamic and spatiotemporal fashion. In this study, we report on comparative microfluidic single-cell analyses of commonly used E. coli expression systems to uncover system-inherent specifications in the synthetic M9CA growth medium. To this end, the PT7lac/LacI, the PBAD/AraC and the Pm/XylS system were systematically analyzed in order to gain detailed insights into variations of growth behavior and expression phenotypes and thus to uncover individual strengths and deficiencies at the single-cell level. Specifically, we evaluated the impact of different system-specific inducers, inducer concentrations as well as genetic modifications that affect inducer-uptake and regulation of target gene expression on responsiveness and phenotypic heterogeneity. Interestingly, the most frequently applied expression system based on E. coli strain BL21(DE3) clearly fell behind with respect to expression homogeneity and robustness of growth. Moreover, both the choice of inducer and the presence of inducer uptake systems proved crucial for phenotypic heterogeneity. Conclusively, microfluidic evaluation of different inducible E. coli expression systems and setups identified the modified lacY-deficient PT7lac/LacI as well as the Pm/XylS system with conventional m-toluic acid induction as key players for precise and robust triggering of bacterial gene expression in E. coli in a homogeneous fashion.


Conflict of interest statement

Competing Interests: The authors have declared that no competing interests exist.

Figures

Fig 1
Fig 1. Simplified mechanisms of inducer uptake and regulation of target gene expression in common E. coli expression systems.
(A) Lac based gene expression via natural (lactose, galactose) or synthetic (TMG, IPTG) inducers. Uptake basically occurs through GalP (mainly galactose) or LacY (all inducers) transport proteins and by passive diffusion (* only synthetic inducers TMG and IPTG). Inducer binding leads to the release of the LacI repressor from the Plac promoter and thus induces gene expression. (B) Arabinose inducible gene expression upon active uptake via AraE and AraFGH transport proteins. In the presence of arabinose AraC positively regulates PBAD promoter activity, whereas in the absence of arabinose AraC tightly represses target gene expression. (C) Pm/XylS regulated gene expression driven by benzoates that are imported via passive diffusion and initiate the XylS regulator-dependent activation of Pm promoter based expression. Abbreviations: galP: galactose permease gene; lacI: lac repressor gene; lacZYA: lactose metabolization and uptake genes; araFGH: arabinose transporter genes; araE: arabinose transporter genes; araC: ara regulator gene; araBAD: arabinose metabolization genes; xylS: xyl regulator gene; tolX-H: toluene degradation operon.
Fig 2
Fig 2. Microfluidic single-cell cultivation experiments.
A) Spatiotemporal microfluidic single-cell analysis of isogenic populations enables well-defined environmental conditions (environmental homogeneity) within growth chambers due to constant laminar media flow through nutrient supply channels. B) Exact evaluation of expression systems response, growth behavior and expression phenotype to expose phenotypic heterogeneity (grey box) of analyzed expression systems.
Fig 3
Fig 3. System responsiveness and growth analysis of characterized E. coli expression systems.
A) Responsiveness was calculated using the initial linear slope of the averaged single-cell fluorescence increase in the first 60 min of cultivation. B) For the correlation between cellular growth and the level of induction, growth rates were calculated for at least 10 populations of microfluidic expression cultures without inducer (light grey), as well as with intermediate (grey) and high inducer concentrations (dark grey). Mean and standard deviations derive from 10 individual colonies. Inductors are labeled by asterisks (*). Double asterisks (**) indicate that no calculation was possible.
Fig 4
Fig 4. Box plot analysis depicting cell-to-cell variations in gene expression for different optimally induced E. coli expression systems.
Cell-to-cell fluorescence distributions of optimally induced expression systems are depicted with the total mean (dotted red line) and the spread interval (25% of mean, grey box) for ten individual microcolonies evaluated at the end of each experiment (end point criteria: cultivation chambers fully filled with cells or μmax ~ 0). Exact inducer concentrations for optimal induction were 0.1 mM IPTG (for each system), 1 mM galactose, 1 mM arabinose, 0.1 mM m-toluic acid and 1.5 mM salicylic acid. For each individual colony, medians (bold red line) indicate values above which 50% of cells are located, blue boxes indicate interval into which 50% of fluorescence values fall. Top or bottom of the box show areas, where 25% of cells are located above or below, respectively. Antenna indicate the 1.5-fold interquartile distance (IQR, 1 IQR = box height) or the last data point detected inside the 1.5-fold IQR. Outliers outside of the 1.5-fold IQR were marked as crosses.
Fig 5
Fig 5. Expression heterogeneity analysis of different E. coli expression systems during microfluidic cultivation for intermediate (grey) and high inducer concentrations (black).
CVs for ten individual colonies (open circles) are plotted together with the respective overall mean (bold dash) and the corresponding standard deviation. The grey dotted line indicates the threshold for expression heterogeneity (CV > 25%) above which colonies are considered as heterogeneous.
Fig 6
Fig 6. Rare cell-to-cell variation phenomena selected from conducted microfluidic analyses.
(A) Filamentous cells that grow but do not divide. (B) Formation of dark spots indicating aggregates in highly producing cells. (C) Dormant cells, which are significantly delayed or irresponsive in growth and expression. (D) Highly producing cells in an otherwise sparely producing population. (E) Overgrowth of slowly—dividing producer cells by rapidly growing non-producers. (F) Cell lysis of stressed overproducer cells or even rapidly growing non-producer cells. Red arrows indicate cells exhibiting the respective phenomena.

References

    1. Veening J-W, Smits WK, Kuipers OP. Bistability, epigenetics, and bet-hedging in bacteria. Annu Rev Microbiol. 2008;62: 193–210. 10.1146/annurev.micro.62.081307.163002 - DOI - PubMed
    1. Eldar A, Elowitz MB. Functional roles for noise in genetic circuits. Nature. Nature Publishing Group; 2010;467: 167–73. - PMC - PubMed
    1. Wang Y-H, Wei KY, Smolke CD. Synthetic Biology: Advancing the Design of Diverse Genetic Systems. Annu Rev Chem Biomol Eng. 2013; 69–102. 10.1146/annurev-chembioeng-061312-103351 - DOI - PMC - PubMed
    1. Sleight SC, Bartley BA, Lieviant JA, Sauro HM. Designing and engineering evolutionary robust genetic circuits. J Biol Eng. 2010;4: 12 10.1186/1754-1611-4-12 - DOI - PMC - PubMed
    1. Terpe K. Overview of bacterial expression systems for heterologous protein production: from molecular and biochemical fundamentals to commercial systems. Appl Microbiol Biotechnol. 2006;72: 211–22. - PubMed

Publication types

MeSH terms

LinkOut - more resources