. 2016 Aug 22;213(9):1881-900.
doi: 10.1084/jem.20151563. Epub 2016 Aug 15.

Exogenous TNFR2 activation protects from acute GvHD via host T reg cell expansion

Affiliations

Exogenous TNFR2 activation protects from acute GvHD via host T reg cell expansion

Martin Chopra et al. J Exp Med. .

Abstract

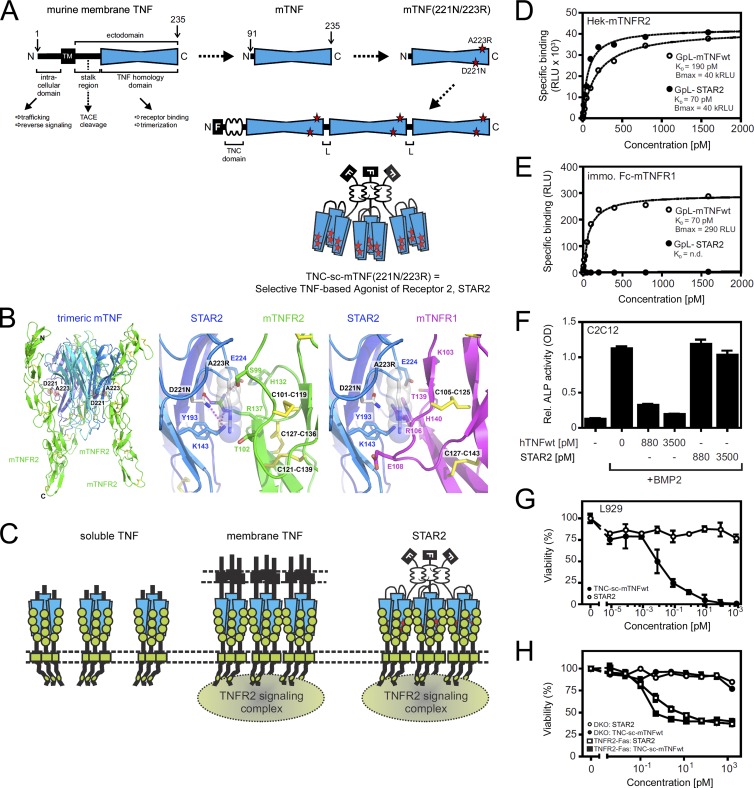
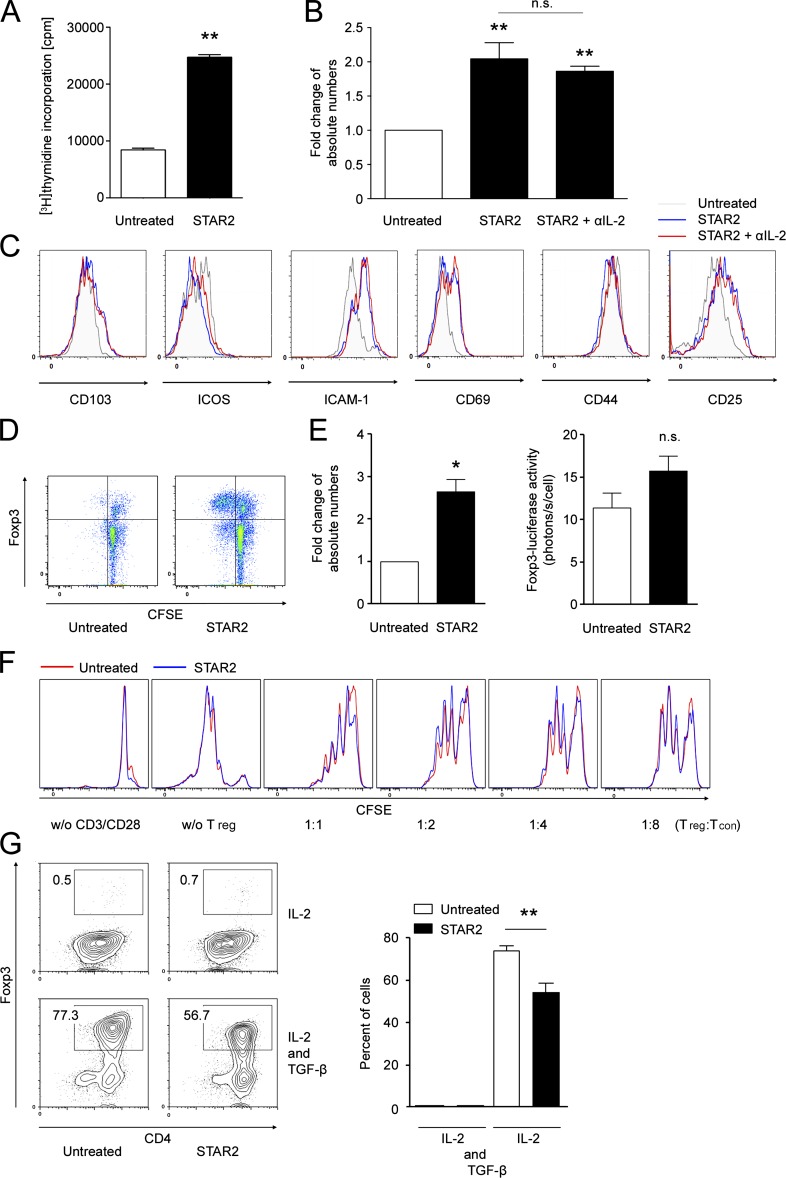
Donor CD4(+)Foxp3(+) regulatory T cells (T reg cells) suppress graft-versus-host disease (GvHD) after allogeneic hematopoietic stem cell transplantation (HCT [allo-HCT]). Current clinical study protocols rely on the ex vivo expansion of donor T reg cells and their infusion in high numbers. In this study, we present a novel strategy for inhibiting GvHD that is based on the in vivo expansion of recipient T reg cells before allo-HCT, exploiting the crucial role of tumor necrosis factor receptor 2 (TNFR2) in T reg cell biology. Expanding radiation-resistant host T reg cells in recipient mice using a mouse TNFR2-selective agonist before allo-HCT significantly prolonged survival and reduced GvHD severity in a TNFR2- and T reg cell-dependent manner. The beneficial effects of transplanted T cells against leukemia cells and infectious pathogens remained unaffected. A corresponding human TNFR2-specific agonist expanded human T reg cells in vitro. These observations indicate the potential of our strategy to protect allo-HCT patients from acute GvHD by expanding T reg cells via selective TNFR2 activation in vivo.


Figures

Figure 1.
Figure 1.
STAR2 is a selective agonist for TNFR2. (A) Three linker-connected mouse TNF(D221N-A223R) protomers were fused to the trimerization domain of chicken TNC, resulting in the formation of the STAR2 molecule with three covalently linked TNF trimers. F, Flag tag; L, linker; TACE, TNF-α converting enzyme; TM, transmembrane domain. (B) Homology model of the extracellular part of mouse TNF (mTNF) bound to the ectodomain of mouse TNFR2 (overview; left). The arginine side chain introduced at position 223 of STAR2 fits into mouse TNFR2 (middle) but leads to a steric clash with mouse TNFR1 (right). (C) Soluble trimeric TNF binds to but does not properly activate TNFR2, whereas membrane-bound TNF binds to and activates TNFR2. Both soluble and membrane-bound TNF bind and activate TNFR1 (not depicted). Nonameric STAR2 binds to and activates only TNFR2 because of mutations preventing TNFR1 binding. (D) Binding assay for mouse TNFR2. Hek293 cells were transiently transfected with mouse TNFR2 and incubated with a GpL fusion protein of mouse TNF and STAR2. (E) Binding assay for mouse TNFR1. Immobilized (immo.) Fc–mouse TNFR1, an Fc fusion protein containing the ectodomain of mouse TNFR1, was incubated with GpL–mouse TNF and GpL-STAR2. n.d., not determined. (D and E) Representative data are from two independent experiments. RLU, relative light units. (F) Mouse preosteoblastic C2C12 cells were treated with BMP2 in the presence and absence of STAR2 and human TNF (hTNF) before the BMP2-induced production of ALP was determined. Rel., relative. (G) Mouse L929 cells were challenged with nonameric wild-type TNF and STAR2. Viability was determined by crystal violet staining. (H) Immortalized mouse TNFR1–TNFR2 double KO (DKO) embryonic fibroblasts expressing a chimeric receptor of the mouse TNFR2 ectodomain and the intracellular part of human CD95 were stimulated in 96-well plates in triplicates with nonameric wild-type TNF and STAR2. Viability was determined by crystal violet staining. (F–H) Data are mean ± SEM of triplicates and are representative of two independent experiments.
Figure 2.
Figure 2.
STAR2 expands and activates T reg cells in vitro. (A) Wild-type or TNFR2 KO B6 CD4+/CD8+ T cells were treated with 1.67 nM STAR2 for 96 h and analyzed for CD4 and Foxp3 expression. Representative data are from five independent experiments. (B) B6.Foxp3.Luci.DTR-4 CD4+/CD8+ T cells were treated with STAR2 for 96 h and analyzed for CD4 and Foxp3-eGFP expression. Combined data are from six independent experiments. (C) CD4 T cells were purified from spleens of B6 (n = 6), BALB/c (n = 6), and FVB/N (n = 3) mice and treated with STAR2 for 96 h. The frequency of T reg cells among CD4 T cells was assessed by flow cytometry. Combined data are from three independent experiments. (D) CD4 T cells were purified from spleens of wild-type, TNF KO, TNFR1 KO, TNFR2 KO, or TNFR1/R2 KO B6 mice, stained with CFSE, and treated with STAR2 for 96 h. CFSE dilution in T reg cells and T con cells was assessed by flow cytometry. Representative data are from three independent experiments. (E) B6.Foxp3.Luci.DTR-4 CD4+/CD8+ T cells treated with STAR2 for 96 h were analyzed for activation marker expression on CD4+Foxp3-eGFP T con cells and CD4+Foxp3-eGFP+ T reg cells. Representative data are from three independent experiments. (F) B6.Foxp3.Luci.DTR-4 CD4 T cells were treated with STAR2, IL-2, and rapamycin alone or in combination for 96 h and analyzed for CD4 and Foxp3-eGFP expression. Combined data are from four independent experiments. (G) B6.Foxp3.Luci.DTR-4 CD4+/CD8+ T cells were treated with STAR2 in the presence or absence of IL-2–blocking antibodies (αIL-2) for 96 h and analyzed for CD4 and Foxp3-eGFP expression. Combined data are from seven independent experiments. (B, C, F, and G) Data are mean ± SEM. (H) B6.Foxp3.Luci.DTR-4 or BALB/c CD4+/CD8+ T cells were treated with STAR2 in the presence or absence of IL-2–blocking antibodies for 96 h and analyzed for proliferation (CellTrace Violet dilution). Representative data are from four independent experiments. (I) Wild-type B6 CD4 T cells were treated with STAR2 and IL-2 alone or in combination for 96 h and analyzed for CD4 and Foxp3 expression and STAT5 phosphorylation. Representative data are from three independent experiments. (J) B6.Foxp3.Luci.DTR-4 or BALB/c CD4+/CD8+ T cells were treated with STAR2 in the presence or absence of IL-2–blocking antibodies for 96 h and analyzed for activation marker expression on CD4+Foxp3-eGFP+ T reg cells. Representative data are from four independent experiments. *, P ≤ 0.05; **, P ≤ 0.01, two-tailed unpaired Student’s t test.
Figure 3.
Figure 3.
STAR2 expands purified T reg cells but neither modifies T reg cell suppressive activity on a per cell basis nor induces the conversion of T reg cells from T con cells. (A) [3H]thymidine incorporation into purified wild-type B6 T reg cells upon STAR2 exposure for 72 h. Data show quadruplicate culture of cells pooled from seven mice. (B) Purified B6.Foxp3.Luci.DTR-4 CD4+CD25+ T reg cells were treated with STAR2 for 96 h and quantified by flow cytometry. Combined data are from three independent experiments. (C) Purified B6.Foxp3.Luci.DTR-4 CD4+CD25+ T reg cells were treated with STAR2 in the presence or absence of IL-2–blocking antibodies (αIL-2) for 96 h and analyzed for the expression of activation markers on CD4+Foxp3-eGFP+ T reg cells. Representative data are from three independent experiments. (D) Wild-type CD4+ T cells were isolated, labeled with CFSE, and either left untreated or treated with 1.67 nM STAR2 for 96 h. Cells were analyzed by flow cytometry for Foxp3 expression and CFSE dilution after gating on CD4+ cells. Representative data are from three independent experiments. (E) B6.Foxp3.Luci.DTR-4 CD4+/CD8+ T cells were treated with 1.67 nM STAR2 for 96 h, and the T reg cell (CD4+Foxp3-eGFP+) numbers in the cultures were assessed by flow cytometry. Foxp3-luciferase expression was analyzed by BLI, and the luciferase activity mirroring the activity of the Foxp3 promoter per cell was determined. Combined data are from eight independent experiments. (F) Wild-type T reg cells were purified, treated overnight with STAR2 or left untreated, and then co-cultured with CD3/CD28-activated, CFSE-labeled T con cells for 72 h to assess the suppressive activity of T reg cells. Representative data are from two independent experiments. (G) CD4+CD25 T con cells were stimulated with αCD3, αCD28, and IL-2 for 72 h in the presence or absence of TGF-β and STAR2. Combined data are from three or seven independent experiments. (A, B, E, and G) Data are mean ± SEM. *, P ≤ 0.05; **, P ≤ 0.01, two-tailed unpaired Student’s t test. n.s., not significant.
Figure 4.
Figure 4.
A human TNFR2-specific STAR2 equivalent expands human T reg cells in vitro. (A) Human CD4+ T cells were isolated from healthy donor PBMCs and treated with 1.67 nM TNC-scTNF(143N/145R) for 96 h. Combined data are from 16 independent experiments and show mean ± 95% confidence interval. (B) Large bowel biopsies from allo-HCT patients stained for TNFR2 (green) and Foxp3 (red); representative image from five patients. Bar, 25 µm.
Figure 5.
Figure 5.
STAR2 expands T reg cells in vivo. (A) Albino B6.Foxp3.Luci.DTR-4 mice were treated with 75 µg (416 pM) STAR2 in PBS i.p. on days 0, 2, 4, 7, 9, and 11. T reg cell numbers were evaluated in vivo using Foxp3-driven luciferase activity. Representative images are from 11 untreated and 9 STAR2-treated mice. (B) Ex vivo imaging of internal organs: cervical lymph nodes (cLN), thymus (th), heart (h), lungs (lu), kidneys (ki), inguinal lymph nodes (iLN), liver (li), stomach (st), pancreas (pa), small bowel (sb), mesenteric lymph nodes (mLN), cecum (ce), large bowel (lb), and spleen (sp). Combined data are from 11 untreated and 9 STAR2-treated mice from two independent experiments. (C) Representative microphotographs for CD4+Foxp3+ cells in small bowel, spleen, and mesenteric lymph nodes of five untreated and three STAR-treated wild-type mice. (D) T reg cells were counted among small and large bowels of untreated (n = 5) and STAR2-treated (n = 3) wild-type mice and untreated (n = 4) and STAR2-treated (n = 3) TNFR2 KO mice. Combined data are from two independent experiments. (E) Representative microphotographs and quantification of CD4+Foxp3+Ki67+ cells in mesenteric lymph nodes of untreated (n = 5) and STAR2-treated (n = 3) wild-type mice. Combined data are from two independent experiments. (F) TNFR2 expression on CD4+ T con cells, T reg cells, and CD8+ T cells in the spleen (top and bottom) and the small bowel (bottom only). Representative flow cytometry plots and combined data are from two independent experiments with eight untreated and seven STAR2-treated mice. (G) B6 wild-type mice were treated with STAR2 i.p. for 2 wk, and the expression of activation-associated surface proteins was assessed by flow cytometry on CD4+Foxp3+ T reg cells and CD4+Foxp3+ T con cells. Combined data are from two independent experiments with seven untreated and six STAR2-treated mice. (A, B, and D–G) Data are mean ± SEM. MFI, mean fluorescence intensity. *, P ≤ 0.05; **, P ≤ 0.01, two-tailed unpaired Student’s t test.
Figure 6.
Figure 6.
STAR2 does not confer proinflammatory side effects in immunologically naive mice. (A) B6 wild-type mice were treated with STAR2 i.p. for 2 wk, and the immune cell composition of the spleen and the lungs was assessed by flow cytometry. Monocytes were identified as CD11b+Ly6C+Ly6G, neutrophils as CD11b+Ly6C+Ly6G+, splenic macrophages as CD11bdimCD11cCD14+F4/80hi, interstitial macrophages as CD11b+CD11cCD14dimF4/80+, and alveolar macrophages as CD11bCD11chiCD14+F4/80+. Combined data are from two independent experiments with five untreated and three STAR2-treated mice *, P ≤ 0.05; **, P ≤ 0.01, two-tailed unpaired Student’s t test. (B) bw’s of untreated (n = 30) and STAR2-treated (n = 30) mice. Combined data are from six independent experiments. (C) Serum samples were collected from STAR2-treated mice and analyzed by cytometric bead array for cytokine levels (untreated, n = 9; and STAR2, n = 9). Combined data are from three independent experiments. (D) Lung, small bowel, and liver samples were collected from STAR2-treated mice, homogenized, and analyzed by cytometric bead array for cytokine levels (untreated, n = 6; and STAR2, n = 6). Combined data are from two independent experiments. Data are mean ± SEM.
Figure 7.
Figure 7.
STAR2 pretreatment protects allo-HCT recipient mice from acute GvHD. (A–C) Albino B6.Foxp3.Luci.DTR-4 mice were lethally irradiated with 9 Gy and transplanted with 5 × 10⁶ B6 wild-type bone marrow cells. *, P ≤ 0.05; **, P ≤ 0.01, two-tailed unpaired Student’s t test. (A) Representative in vivo BLI images of Foxp3-driven luciferase activity before and 20 d after syngenic bone marrow transfer from five mice per group are shown. (B, top) Representative ex vivo BLI images of Foxp3-driven luciferase activity of internal organs before and 20 d after syngenic bone marrow transfer from five mice per group. (Bottom) Quantification of ex vivo BLI data. Combined data are from two independent experiments with five mice per group and show mean ± SEM. mLN, mesenteric LN; pLN, peripheral LN. (C, left) Representative flow cytometry plots of CD4+Foxp3-eGFP+ cells among live CD45.2+ immune cells in the spleen before and 20 d after bone marrow transfer from five mice per group. (Right) Quantification of CD4+Foxp3-eGFP+ cells among live CD45.2+ immune cells in the spleen and small bowel. Combined data are from two independent experiments with five mice per group and show mean ± SEM. (D–F) Albino B6.Foxp3.Luci.DTR-4 mice and their wild-type littermates (H-2b) were treated with STAR2 i.p. for 2 wk and injected with 15 ng DTx/g bw on days 2 and 1 before allo-HCT with 5 × 10⁶ FVB/N (H-2q) bone marrow cells and 106 FVB/N (H-2q)-enriched T cells (wild type untreated, n = 10; wild type STAR2, n = 10; Foxp3.Luci.DTR-4 untreated, n = 10; Foxp3.Luci.DTR-4 STAR2, n = 9; irradiation control, n = 5; and bone marrow control, n = 5). Combined data are from two independent experiments. (D) Survival. (E) Relative weight change. (F) Clinical scoring. (G–I) B6 wild-type and TNFR2 KO mice (H-2b) were treated with STAR2 i.p. for 2 wk before allo-HCT with 5 × 10⁶ FVB/N (H-2q) bone marrow cells and 106 FVB/N (H-2q)-enriched T cells (wild type untreated, n = 5; wild type STAR2, n = 5; TNFR2 KO untreated, n = 4; TNFR2 KO STAR2, n = 4; irradiation control, n = 5; and bone marrow control, n = 5). Combined data are from two independent experiments. (G) Survival. (H) Relative weight change. (I) Clinical scoring. (J–L) BALB/c mice (H-2d) were treated with STAR2 i.p. for 2 wk before allo-HCT with 5 × 10⁶ B6 (H-2b) bone marrow cells and 106 luc+ B6.L2G85.CD90.1 (H-2b)-enriched T cells (untreated, n = 15; STAR2, n = 15; irradiation control, n = 10; and bone marrow control, n = 10). Combined data are from three independent experiments. (J) Survival. (D, G, and J) **, P ≤ 0.01, log-rank test. (K) Relative weight change. (L) Clinical scoring. Data are mean ± SEM.
Figure 8.
Figure 8.
STAR2 protects from GvHD by reducing early alloreactive donor T cell expansion and tissue destruction without modulating MDSCs. (A–E) BALB/c mice (H-2d) were treated with STAR2 i.p. for 2 wk before allo-HCT with 5 × 10⁶ B6 (H-2b) bone marrow cells and 106 B6.L2G85.CD90.1 (H-2b)-enriched T cells. (A) Representative in vivo BLI images and quantification of luc+ donor T cell expansion and migration in transplanted mice (untreated, n = 15; and STAR2, n = 15). Combined data are from three independent experiments and show mean ± SEM. (B–E) On day 6 after allo-HCT, recipient mice were dissected. (B) Internal organs were imaged ex vivo for donor T cell–derived bioluminescence (untreated, n = 5; STAR2, n = 5; and bone marrow control, n = 5). Combined data are from two independent experiments. mLN, mesenteric LN. (C) Internal organs were prepared for immunofluorescence microscopy for the expression of CD90.1, CD4, and CD8 (untreated, n = 5; and STAR2, n = 5). Combined data are from two independent experiments. (D) Internal organs were prepared for flow cytometry (cells were gated on live CD45.2+ immune cells and analyzed for CD90.1 expression–representing donor T cells; untreated, n = 5; and STAR2, n = 5). Combined data are from two independent experiments. (E) Internal organs were assessed for tissue damage after hematoxylin/eosin staining (untreated, n = 8; STAR2, n = 8; and bone marrow control, n = 6). Combined data are from three independent experiments. (F) B6 wild-type mice (H-2b) were treated with STAR2 i.p. for 2 wk, and MDSCs in the lungs, the small bowel (SB), and spleen were assessed by flow cytometry 6 d after allo-HCT with 5 × 10⁶ FVB (H-2q) BM cells and 106 FVB (H-2q) T cells (untreated, n = 3; and STAR2, n = 3). Representative data are from two independent experiments. (G) CD11b+ cells were isolated from either the spleen or the small bowel of STAR2-treated B6 mice before (top) or after (middle and bottom) allogeneic transplantation. Cells of three animals were pooled for analysis. Triplicates of 3 × 10⁵ lymph node cells from BALB/c mice as a source of responder T cells were cultured together with 3 × 10⁴ LPS-matured allogeneic DCs from B6 mice and different numbers of sorted B6 MDSCs. After 3 d, cells were pulsed with [3H]thymidine overnight to measure cell proliferation. Representative data are from two independent experiments. Data are mean ± SEM. *, P ≤ 0.05; **, P ≤ 0.01, two-tailed unpaired Student’s t test.
Figure 9.
Figure 9.
STAR2 pretreatment does not interfere with GvL properties of transplanted T cells. (A–E) BALB/c (H-2d) mice were treated with STAR2 i.p. for 2 wk before allo-HCT. Lethally irradiated mice were injected i.v. with 105 luciferase-expressing A20 B cell lymphoma cells (H-2d) and transplanted with 5 × 10⁶ B6 (H-2b) bone marrow cells. To induce GvHD, 106 B6 (H-2b)-enriched T cells were injected i.v. (A20 + BM, n = 10; A20 + BM + T cells, n = 10; A20 + BM + STAR2, n = 8; and A20 + BM + T cells + STAR2, n = 8). Combined data are from two independent experiments. (A) Representative in vivo BLI images. (B) Graphic evaluation of BLI images taken from a ventral view. **, P ≤ 0.01, two-tailed unpaired Student’s t test. (C) Survival using log-rank test. (D) Relative weight change. (E) Clinical scoring. (F–J) BALB/c (H-2d) mice were treated with STAR2 i.p. for 2 wk before allo-HCT. Mice were injected i.v. with 105 luciferase-expressing IM380 B cell lymphoma cells (H-2d) 6 d before allo-HCT. Lethally irradiated mice were transplanted with 5 × 10⁶ B6 (H-2b) bone marrow cells. To induce GvHD, 106 B6 (H-2b)-enriched T cells were injected i.v. (IM380 + BM, n = 7; IM380 + BM + T cells, n = 7; IM380 + BM + STAR2, n = 7; and IM380 + BM + T cells + STAR2, n = 7). Combined data are from two independent experiments. (F) Representative in vivo BLI images. (G) Graphic evaluation of BLI images taken from a ventral view. *, P ≤ 0.05, two-tailed unpaired Student’s t test. (H) Survival using log-rank test. (I) Relative weight change. (J) Clinical scoring. Data are mean ± SEM.
Figure 10.
Figure 10.
STAR2 does not interfere with the immunological clearance of mCMV infection after transplantation. (A–C) BALB/c (H-2d) recipients of syngenic HCT were pretreated with STAR2 for 2 wk and analyzed 4 wk after HCT and infection. (A) Infectious virus (expressed as PFU) in lungs and spleen. (B) Immunohistochemical detection of infected cells (red stain) and CD3ε+ infiltrate lymphocytes (black stain) in liver tissue sections. Please note that there are no infected red cells visible because the infection is controlled in both groups at this point. (Left) Representative images. Bars, 50 µm. (Middle and right) Quantification of infected cells (middle) and of infiltrating CD3ε+ lymphocytes (right). (A and B) Symbols represent individual mice. Median values are marked (PBS, n = 11; and STAR2, n = 10). Combined data are from two independent experiments. The dotted line shows the detection limit. (C) Cytofluorometric quantitation and characterization of pulmonary CD8 T cells. (Left) Percentage of CD8 T cells in the lymphocyte gate. (Middle) Percentage of viral m164 epitope–specific cells among the CD8 T cells. (Right) Percentage of short-lived effector cells among the m164 epitope–specific CD8 T cells. Symbols represent three independent pools, each composed of cells from three to four mice representing their experimental mean. (D and E) BALB/c (H-2d) recipients of allo-HCT (with BALB/c-H-2dm2 mice as donors) were pretreated with STAR2 for 2 wk and analyzed 18 d after HCT (PBS, n = 8; and STAR2, n = 3). Combined data are from two independent experiments. (D) Infectious virus (expressed as PFU) in spleen, lungs, salivary glands, and liver. (E) Immunohistochemical detection and quantification of infected cells (left) and of infiltrating CD3ε+ lymphocytes (right). (A–E) Two-tailed unpaired Student’s t test was used. All p-values were calculated with Welch’s correction to account for unequal variance. Data from exponential growth curves (virus titers and numbers of infected cells) were log-transformed for the Student’s t test.

Similar articles

Cited by

References

    1. Anderson B.E., McNiff J.M., Matte C., Athanasiadis I., Shlomchik W.D., and Shlomchik M.J.. 2004. Recipient CD4+ T cells that survive irradiation regulate chronic graft-versus-host disease. Blood. 104:1565–1573. 10.1182/blood-2004-01-0328 - DOI - PubMed
    1. Ban L., Kuhtreiber W., Butterworth J., Okubo Y., Vanamee É.S., and Faustman D.L.. 2015. Strategic internal covalent cross-linking of TNF produces a stable TNF trimer with improved TNFR2 signaling. Mol. Cell. Ther. 3:7 10.1186/s40591-015-0044-4 - DOI - PMC - PubMed
    1. Beilhack A., Schulz S., Baker J., Beilhack G.F., Wieland C.B., Herman E.I., Baker E.M., Cao Y.A., Contag C.H., and Negrin R.S.. 2005. In vivo analyses of early events in acute graft-versus-host disease reveal sequential infiltration of T-cell subsets. Blood. 106:1113–1122. 10.1182/blood-2005-02-0509 - DOI - PMC - PubMed
    1. Beilhack A., Schulz S., Baker J., Beilhack G.F., Nishimura R., Baker E.M., Landan G., Herman E.I., Butcher E.C., Contag C.H., and Negrin R.S.. 2008. Prevention of acute graft-versus-host disease by blocking T-cell entry to secondary lymphoid organs. Blood. 111:2919–2928. 10.1182/blood-2007-09-112789 - DOI - PMC - PubMed
    1. Brunstein C.G., Miller J.S., Cao Q., McKenna D.H., Hippen K.L., Curtsinger J., Defor T., Levine B.L., June C.H., Rubinstein P., et al. . 2011. Infusion of ex vivo expanded T regulatory cells in adults transplanted with umbilical cord blood: safety profile and detection kinetics. Blood. 117:1061–1070. 10.1182/blood-2010-07-293795 - DOI - PMC - PubMed

Publication types

MeSH terms

Substances