. 2016 Aug 16:7:12436.
doi: 10.1038/ncomms12436.

miR-625-3p regulates oxaliplatin resistance by targeting MAP2K6-p38 signalling in human colorectal adenocarcinoma cells

Affiliations

miR-625-3p regulates oxaliplatin resistance by targeting MAP2K6-p38 signalling in human colorectal adenocarcinoma cells

Mads Heilskov Rasmussen et al. Nat Commun. .

Abstract

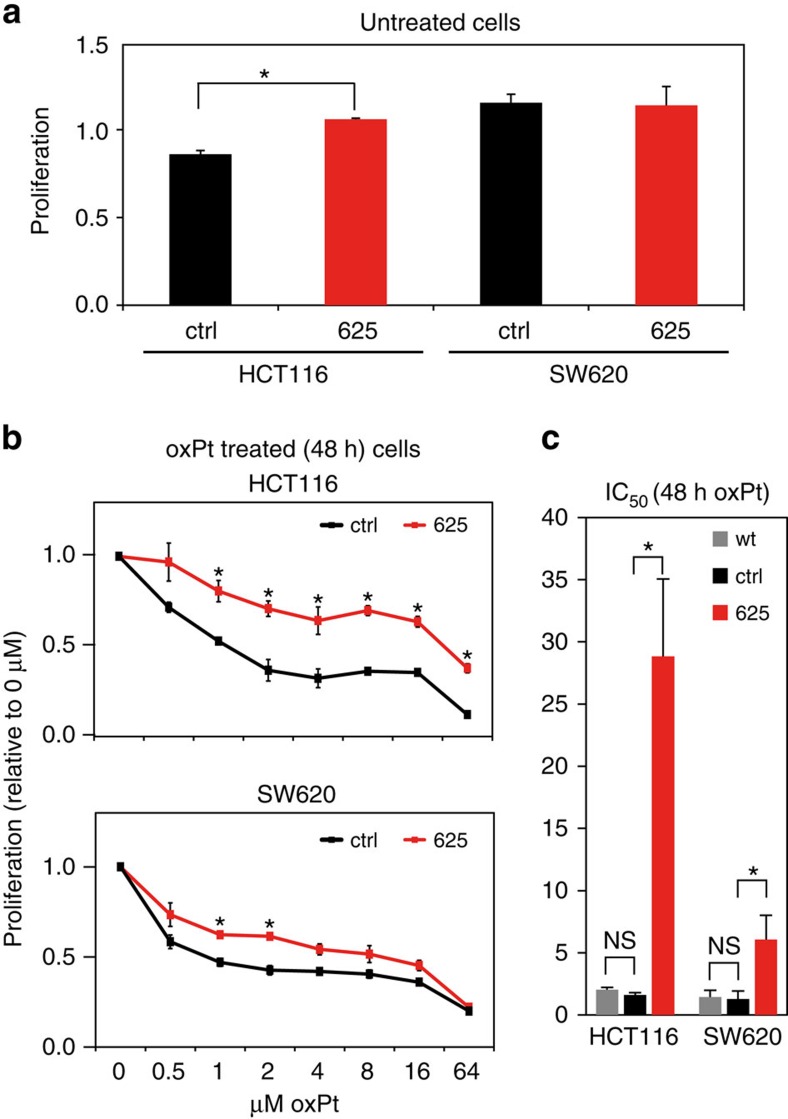
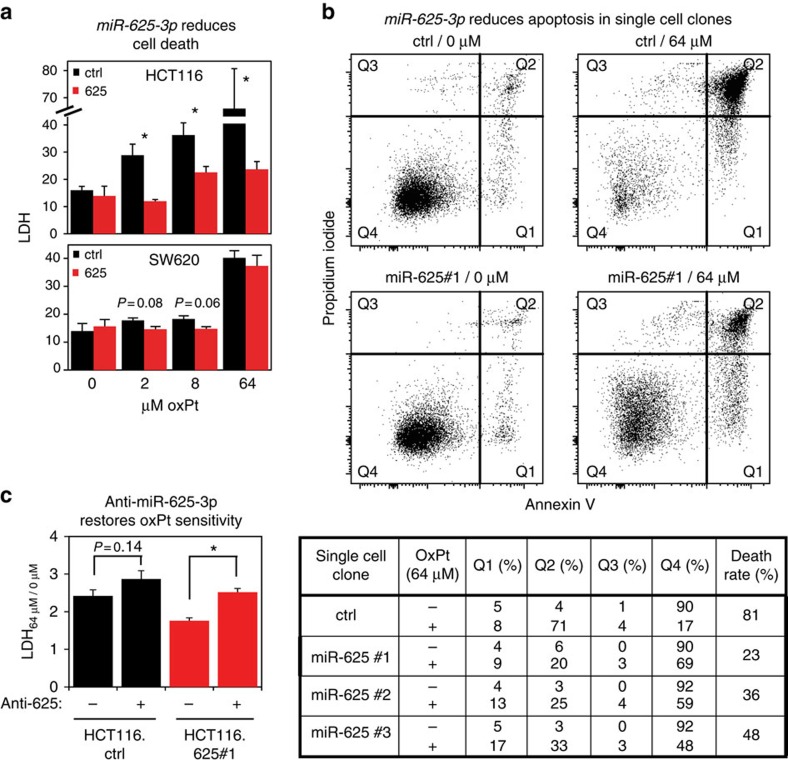
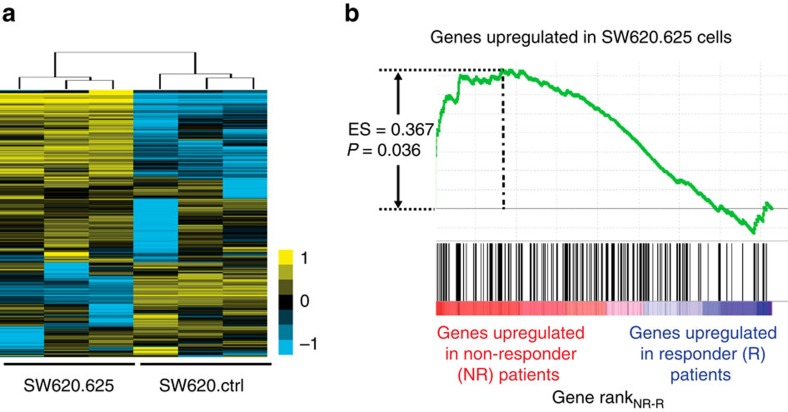
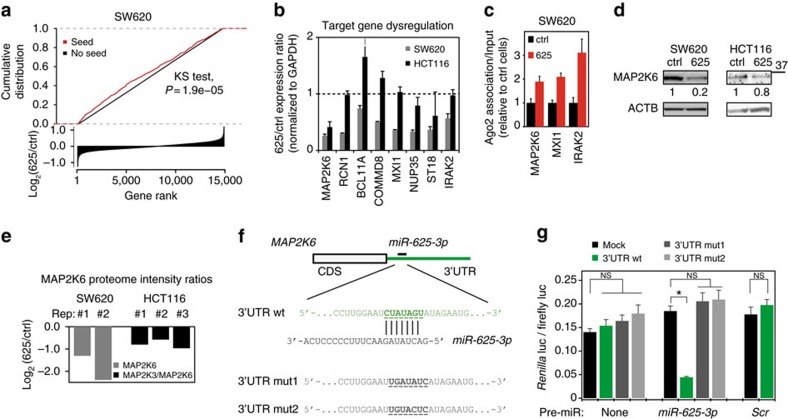
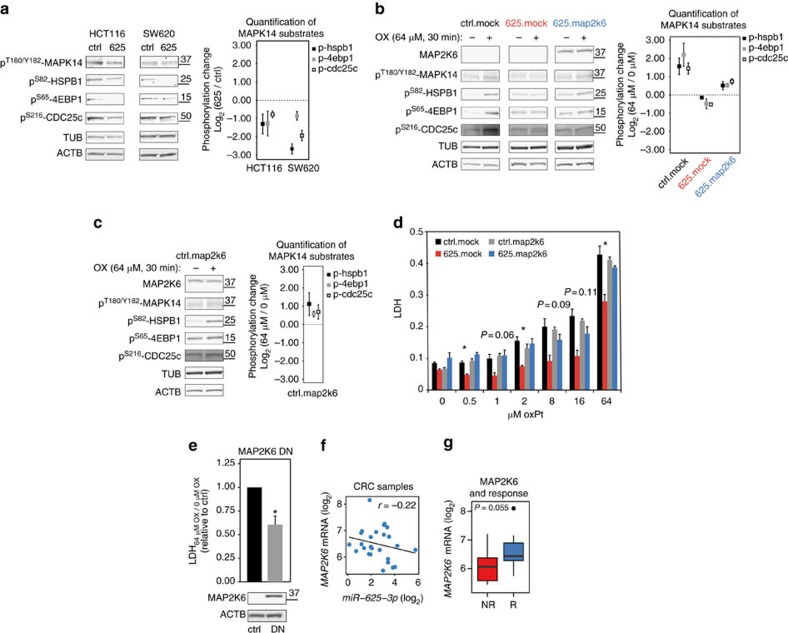
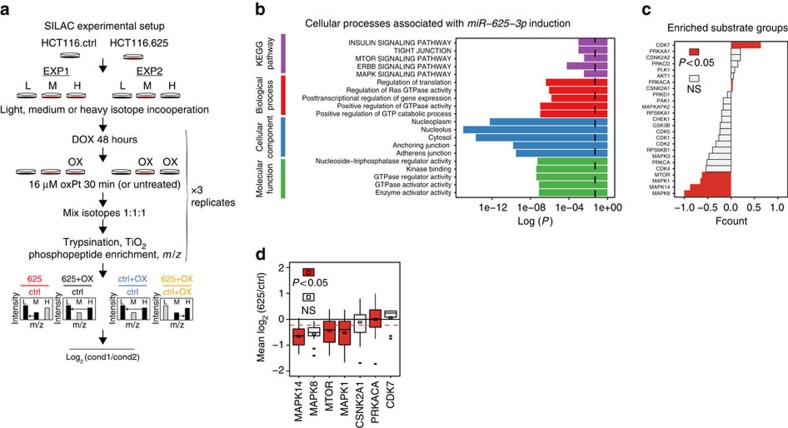
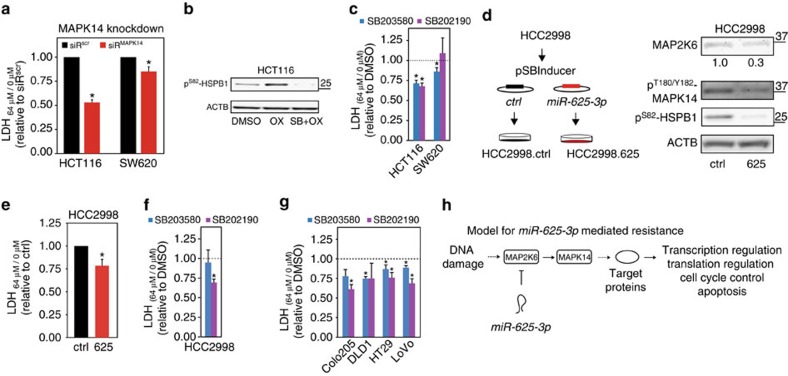
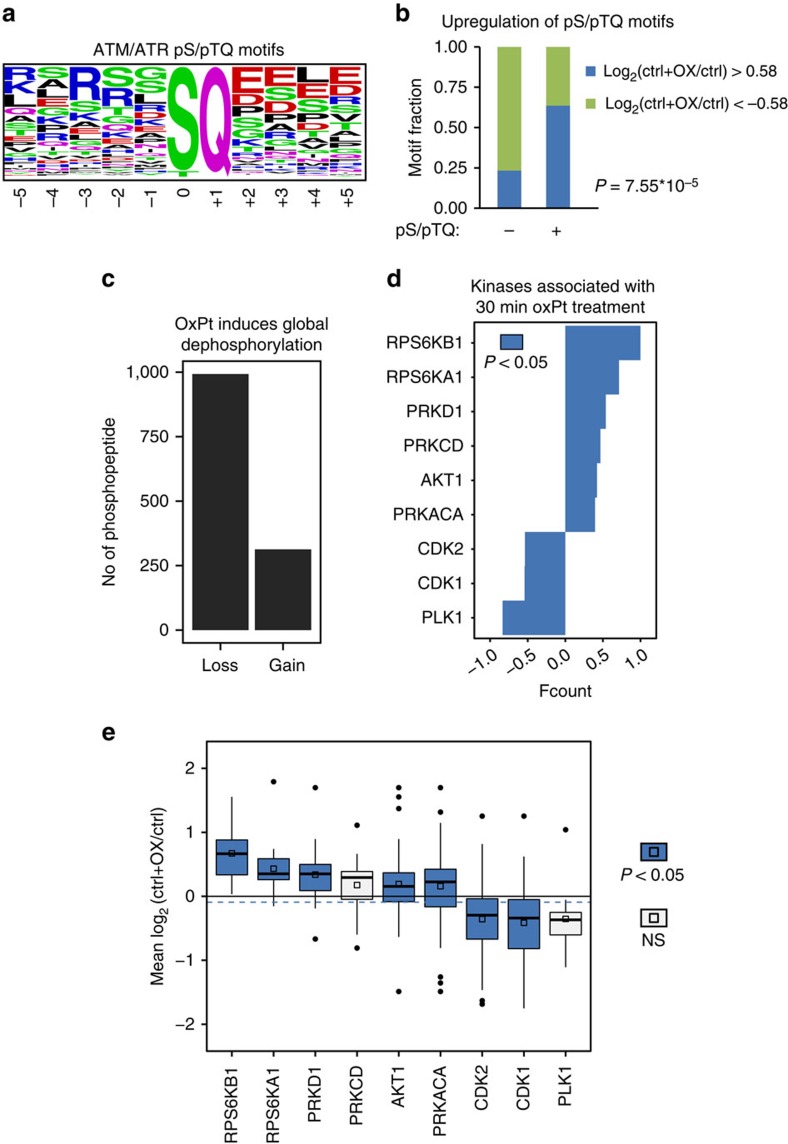
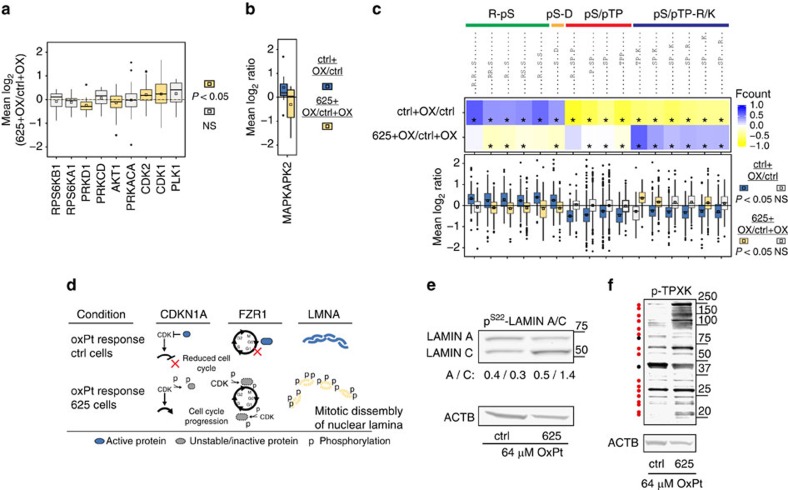
Oxaliplatin resistance in colorectal cancers (CRC) is a major medical problem, and predictive markers are urgently needed. Recently, miR-625-3p was reported as a promising predictive marker. Herein, we show that miR-625-3p functionally induces oxaliplatin resistance in CRC cells, and identify the signalling networks affected by miR-625-3p. We show that the p38 MAPK activator MAP2K6 is a direct target of miR-625-3p, and, accordingly, is downregulated in non-responder patients of oxaliplatin therapy. miR-625-3p-mediated resistance is reversed by anti-miR-625-3p treatment and ectopic expression of a miR-625-3p insensitive MAP2K6 variant. In addition, reduction of p38 signalling by using siRNAs, chemical inhibitors or expression of a dominant-negative MAP2K6 protein induces resistance to oxaliplatin. Transcriptome, proteome and phosphoproteome profiles confirm inactivation of MAP2K6-p38 signalling as one likely mechanism of oxaliplatin resistance. Our study shows that miR-625-3p induces oxaliplatin resistance by abrogating MAP2K6-p38-regulated apoptosis and cell cycle control networks, and corroborates the predictive power of miR-625-3p.


Figures

Figure 1
Figure 1. Ectopic expression of miR-625-3p is associated with increased viability in oxPt medium.
(a) Cell proliferation upon DOX induction of miR-625-3p in the CRC cell lines HCT116.625, SW620.625 and control cells expressing a scrambled shRNA was determined by an MTT assay after 72 h of growth. Displayed as mean±s.e.m. (n=3). (b) Cell proliferation after 48 h of oxPt treatment was assessed by MTT in DOX-induced HCT116.625, SW620.625. Displayed relative to untreated cells as mean±s.e.m. (n=3). (c) IC50 values were calculated on the basis of experiments from b as well as from wild-type cells not subjected to pSBInducer transposition. Displayed as mean IC50±s.e.m. (n=3). *P≤0.05 (t-test); NS, not significant.
Figure 2
Figure 2. miR-625-3p inhibits oxPt-induced cell death in CRC cell lines.
(a) DOX-induced HCT116.625 and SW620.625 together with control cells were treated for 48 h with oxPt. Cell death was determined with the LDH assay as 100%*(LDHmedium/(LDHmedium+LDHlysate)). Displayed as mean±s.e.m. (n=3). (b) DOX-induced HCT116.625 and HCT116.ctrl single colony-derived cells were treated with media containing 0 or 64 μM oxPt for 48 h. In the top panel, representative results from HCT116.ctrl and HCT116.625#1 single cell clones are shown. Quadrants Q1, Q2 and Q3 contain early apoptotic, late apoptotic and necrotic cells, respectively, while quadrant Q4 contains living cells. The bottom panel reports the fraction of cells in each quadrant for three independent HCT116.625 single cell clones. The death rate was calculated as 100%*(1−[Q464 μM/Q40 μM]). (c) HCT116.625#1 and HCT116.ctrl cells were induced with DOX and transfected with 20 nM anti-miR-625-3p oligo. Twenty-four hours after transfection, cells were cultivated in 0 or 64 μM oxPt for 48 h before cell death was assessed by LDH assay. Data are presented as mean increase in 64 μM oxPt-induced cell death±s.e.m. (n=5). *P≤0.05 (t-test).
Figure 3
Figure 3. miR-625-3p regulates networks associated with therapy response.
(a) Unsupervised clustering of the most variable probe sets across three SW620.625 and three SW620.ctrl samples after DOX induction. (b) Expression profiles of primary tumours from first-line oxPt-treated mCRC patients were generated and 20,693 genes ranked according to difference in median expression between non-responder (n=9) and responder (n=17) patients. Genes upregulated in the SW620.625 cells (black vertical bars) were significantly associated with the non-responder phenotype (enrichment score=0.367, P=0.036, Kolmogorov–Smirnov test).
Figure 4
Figure 4. MAP2K6 is a direct and functional target of miR-625-3p.
(a) Genes were ranked according to differential expression after miR-625-3p induction in SW620 cells (log2(625/ctrl) (bottom panel). The cumulative distribution of genes with a miR-625-3p seed sequence (red) was significantly different from the distribution of genes without a seed sequence (black) (P=1.9*10−5, Kolmogorov–Smirnov test; top panel). Note that for clarity, the log2(625/ctrl)-scale is truncated at −1 and 1. (b) The 625/ctrl-expression ratios of eight candidate target genes were determined by qRT–PCR after induction of miR-625-3p (or control) in SW620 cells and HCT116 CRC cells. Shown are mean expression ratio±s.e.m. (n=3). (c) qRT–PCR quantification of candidate target genes in RNA from AGO2-associated precipitates and normalized to GAPDH in input. Mean association±s.e.m. (n=3) displayed relative to control cells. (d) Representative western blots of MAP2K6 in SW620 and HCT116 cells after DOX-induction for 48 h. β-Actin (ACTB) was used as loading control. Quantification of MAP2K6 band intensities (normalized to ACTB) is indicated. (e) Quantification of MAP2K6 downregulation after induction of miR-625-3p as determined by mass-spec proteome analysis of two (SW620) or three (HCT116) independent DOX inductions. Displayed as log2 mean peptide intensity ratio. For SW620 data, 20–45 kDa proteins were excised from a denaturing gel and subjected to unlabelled proteome quantification. For HCT116 data, we used isotope-labelled whole cell lysates described below (see Fig. 6a). Note that while one MAP2K6 specific peptide was quantified in the SW620 lysates, only peptides (n=2) shared between MAP2K3 and MAP2K6 were detected in HCT116 cells. (f) Structure of the 3′UTR of MAP2K6 (ENSG00000108984, miR-625-3p binding site at 3′UTR position 173–180). The close-up depicts miR-625-3p annealed to the wild-type target sequence (underlined) as well as the two mutated sequences used in g. (g) Mean normalized Renilla Luc signal±s.e.m. (n=3) from HEK293T cells 24 h after transfection with psiCHECK-2 reporter containing MAP2K 3′UTR, either of the mutated 3′UTR sequences shown in f or mock. Experiments where a miR-625-3p or control (Scr) pre-miR were co-transfected together with psiCHECK-2 are indicated. *P<0.05 (t-test); NS, not significant.
Figure 5
Figure 5. miR-625-3p regulates resistance to oxPt through MAP2K6 and MAPK14.
(a) Western blotting using antibodies against the phosphorylated forms of MAPK14T180/Y182, HSPB1Ser82, 4EBP1Ser64 and CDC25cS216 in HCT116.625 and SW620.625 cells 48 h after DOX induction. β-Actin and tubulin was used as loading control (left). Quantification of HSPB1Ser82, 4EBP1Ser64 and CDC25cS216 western blot bands from three to five western blots normalized to α-tubulin and β-actin and displayed as log2(625/ctrl)±s.e.m. In one case the HSPB1Ser82 signal in SW620.625 was below detection level, and for this sample the median value for the two other replicates was used (right). (b) Changes in phosphorylation of activated pT180/Y182-MAPK14 and downstream substrates in HCT116.ctrl.mock, HCT116.625.mock and HCT116.625.map2k6 cells after 48 h of DOX induction followed by 30 min of 64 μM oxPt treatment (left). Quantification of HSPB1Ser82, 4EBP1Ser64 and CDC25cS216 substrate phosphorylation from three to five western blots normalized to α-tubulin and β-actin and displayed as oxPt-induced phosphorylation change compared with untreated cells (log2(64 μM/0 μM)±s.e.m. (right). (c) Same as b for the HCT116.ctrl.map2k6 cells. (d) Cells were DOX-induced for 48 h and treated with 0–64 μM oxPt for 48 h before cell death was determined (LDH assay). Bars represent the mean percentage of cell death±s.e.m. (n=3). Significant difference between HCT116.625.mock and HCT116.625.map2k cells is indicated (*P≤0.05, t-test). (e) Control HCT116 cells (ctrl) and cells expression a dominant-negative version of MAP2K6 (DN) were induced for 48 h and treated with 64 μM oxPt or left untreated for 48 h before the increase in cell death (64 μM/0 μM) was determined by LDH. Results are displayed relative to control cells (set to 1; mean±s.e.m. from n=4 experiments; *P≤0.05; t-test). Western blot against MAP2K6 (f) Correlation between MAP2K6 mRNA levels and mir-625-3p in clinical samples (P=0.212, Pearson's correlation). (g) MAP2K6 mRNA was downregulated in tumours from mCRC patients not responding (NR, n=9) compared with responders (R, n=17) to first-line oxPt-based therapy (t-test).
Figure 6
Figure 6. Decreased MAPK signalling is associated with miR-625-3p induction.
(a) Phosphopeptide-enriched SILAC mass-spectrometry analysis was performed on HCT116.ctrl and HCT116.625 cells in two experimental setups done in parallel (‘EXP1' and ‘EXP2') each involving three experimental conditions labelled with light (‘L'), medium (‘M') or heavy (‘H') isotopes. Each experimental condition was done in triplicate. Four data sets were generated by calculating the mean log2 peptide intensity ratios from triplicate experiments for the following conditions: (i) HCT116.625/HCT116.ctrl (red), (ii) oxPt-treated HCT116.625/HCT116.ctrl (black), (iii) oxPt-treated HCT116.ctrl/HCT116.ctrl (blue) and (iv) oxPt-treated HCT116.625/oxPt-treated HCT116.ctrl (yellow). (b) Proteins with significantly dysregulated phosphopeptides after miR-625-3p induction were subjected to GO term and KEGG pathway enrichment analysis. The adjusted P-values for the most associated terms are shown. P=0.05 is indicated with a stippled line. (c) Kinase substrate enrichment analysis (KSEA) on log2(625/ctrl) ratios was calculated for substrate groups as the difference in the number of phosphopeptides with increased phosphorylation minus the number with decreased phosphorylation, and displayed as the fractional delta count (fcount), that is, the delta count divided with the sum of phosphopeptides in each substrate group (coloured bars indicate P≤0.05, hypergeometric test). (d) Mean log2(625/ctrl) phosphorylation levels were calculated for the significant substrate groups in c), and significance of the difference to the population mean (stippled line) calculated with a z-test (P≤0.05 indicated with coloured boxes). Mean and median are shown with a squared box and a horizontal line, respectively, the interquartile range is marked by the lower and upper hinges, respectively, and the whiskers indicate 1.5 times the interquartile range.
Figure 7
Figure 7. Inhibition of MAPK14 induces oxaliplatin resistance in CRC cells.
(a) MAPK14 was specifically depleted from HCT116 and SW620 cells by transfection of a pool of MAPK14 targeting siRNAs (siRMAPK14) 48 h before being treated with 64 μM oxPt for 48 h (or left unexposed; see Supplementary Fig. 9 for knockdown efficiencies). The impact on cell death (64 μM/0 μM) was determined by LDH and are displayed relative to cells transfected with a scrambled siRNA (siRscr, set to 1). Mean±s.e.m. from at least n=4 experiments with ‘*' indicating a significant reduction in oxPt-induced cells death compared with siRscr transfected cells (P≤0.05, t-test). (b) A phospho-specific western blot versus the MAPK14/MAPKAPK2 substrate Ser82-HSPB1 was applied to show increased MAPK14 activity after oxPt treatment and the inhibitory effect of 10 μM SB203580 on this activity. (c) HCT116 and SW620 cells were treated for 1 h with MAPK11/14 inhibitors SB203580 (10 μM, blue) or SB202190 (5 μM, purple), then exposed to 64 μM oxPt (or left unexposed) for 48 h before the increase in cell death (64 μM/0 μM) was determined by LDH. Presented relative to cells not treated with inhibitor (DMSO treated; mean±s.e.m. from at least n=4 experiments with ‘*' indicating a significant reduction in oxPt-induced death compared with DMSO-treated cells, P≤0.05, t-test). (d) Stable, inducible expression of miR-625-3p was generated using pSBInducer transposition in HCC2998 CRC cells (left). Phospho-specific western blot for MAP2K6 and MAPK14 activity 48 h after DOX induction of HCC2998.ctrl and HCC2998.625 cells (right). (e) HCC2298.ctrl and HCC2998.625 cells DOX-induced for 48 h, then treated (or left untreated) with 64 μM oxPt for 48 h before the increase in cell death (64 μM/0 μM) was determined by LDH. Results are displayed relative to control cells (set to 1; mean±s.e.m. from n=3 experiments; *P≤0.05, t-test). (f,g) HCC2998, Colo205, DLD1, HT29 and LoVo CRC cells were treated for 1 h with MAPK11/14 inhibitors SB203580 (10 μM, blue) or SB202190 (5 μM, purple) then exposed to 64 μM oxPt (or left unexposed) for 48 h before the increase in cell death (64 μM/0 μM) was determined by LDH. Displayed relative to DMSO-treated cells (mean±s.e.m. from n=3–4 experiments with ‘*' indicating a significant reduction, P≤0.05, t-test). (h) A schematic model showing how miR-625-3p mediated downregulation of MAP2K6 could modulate response to oxPt by abrogating MAPK14 stress-induced signalling. In the canonical model MAP2K6 in complex with MAP2K3 phosphorylates and activates MAPK14, which in turn—directly or indirectly via substrate kinases such as MAPKAPK2—activates a diverse number of target proteins central to stress-induced transcription, translation, cell cycle control and apoptosis.
Figure 8
Figure 8. The phosphoproteome response to oxPt in CRC cells.
(a) A sequence logo was generated based on 205 detected phosphopeptides with potential ATM/ATR phosphorylation sites (pS/pTQ). (b) Fisher's exact test on counts of dysregulated (log2(ctrl+OX/ctrl)±0.58 and false discovery rate (FDR) ≤0.1) phosphopeptides revealed significantly increased upregulation of pS/pTQ motifs after oxPt treatment. (c) The number of altered phosphopeptides after 30 min of 16 μM oxPt treatment were counted and grouped into peptides with decreased phosphorylation (log2(ctrl+OX/ctrl)<0.58) (‘Loss') and increased phosphorylation (log2(ctrl+OX/ctrl)>0.58) (‘Gain'). (d) KSEA was done on log2(ctrl+OX/ctrl) ratios (as described in Fig. 5). Only substrate groups with indication of altered activities after oxPt exposure are shown (*P≤0.05, hypergeometric test). (e) Mean log2 phosphorylation ratios for the nine substrate groups in d; (coloured boxes indicate P≤0.05, z-test). NS, not significant.
Figure 9
Figure 9. Critical components of the cellular response to oxPt are blocked in cells with increased miR-625-3p levels.
(a) Mean log2 ratios of substrates groups involved in oxPt response were calculated for the 625+OX/ctrl+OX data. (b) Mean log2 for the MAPKAPK2 substrate group. (c) The most significantly altered substrate phosphorylation motifs identified for the ctrl+OX/ctrl and 625+OX/ctrl+OX experiments identified using KSEA (displayed as fcounts, P≤0.05 indicated with "*"). Mean log2 ratios for substrates with these motifs were calculated. Coloured boxes in the boxplots of a, b and c indicate P≤0.05, z-test; and NS, not significant. On the basis of similarity, the 16 individual motifs were grouped into the four motif groups indicated above. Note that the experimental mean log2 ratios for clarity have been omitted in b and c. (d) oxPt treatment in HCT116.ctrl cells led to dephosphorylation of Serine 130 (S130) of Cyclin-Dependent Kinase Inhibitor 1 (CDKN1A, also known as p21CIP1), which has been linked to increased stability of CDKN1A and inhibition of CDK/cyclin-mediated cell cycle progression. In contrast, increased S130 phosphorylation was seen in cells with ectopic miR-625-3p expression. As indicated, this phosphorylation may itself be mediated by elevated CDK activity. Increased CDK activity at the G1/S checkpoint or in early M phase was also indicated by S138/S151 phosphorylations on inactivated FZR1 (also known as CDH1) in miR-625-3p expressing cells, whereas unphosphorylated FZR1 in control cells suggested decreased CDK signalling at G0 or early G1 (ref. 67). In support of mitotic-induced nuclear lamina breakdown, increased phosphorylation was observed on multiple residues on LMNA in miR-625-3p cells; On the contrary, these became dephosphorylated after oxPt treatment in control cells indicating decreased cell cycle progression (also see Supplementary Fig. 14). (e) Western blotting against the CDK1 substrate phospho-LAMIN A/CS22 on lysates from oxPt-treated HCT116.ctrl and HCT116.625 cells. Quantification of bands representing Lamin A and C isoforms are indicated (normalized to β-actin signal). (f) Western blotting against the phosphorylated CDK motif p-TPXK on lysates from oxPt-treated HCT116.ctrl and HCT116.625 cells. Individual substrates are indicated with a dot with red and black indicating increase or decrease/no change in intensity, respectively, in HCT116.625 as compared with HCT116.ctrl cells.

References

    1. Jemal A. et al. Global cancer statistics. CA Cancer J. Clin. 61, 69–90 (2011). - PubMed
    1. Schmoll H. J. et al. ESMO Consensus Guidelines for management of patients with colon and rectal cancer: a personalized approach to clinical decision making. Ann. Oncol. 23, 2479–2516 (2012). - PubMed
    1. Bartel D. P. MicroRNAs: genomics, biogenesis, mechanism, and function. Cell 116, 281–297 (2004). - PubMed
    1. Blower P. E. et al. MicroRNAs modulate the chemosensitivity of tumor cells. Mol. Cancer Ther. 7, 1–9 (2008). - PubMed
    1. Rasmussen M. H. et al. High expression of microRNA-625-3p is associated with poor response to first-line oxaliplatin based treatment of metastatic colorectal cancer. Mol. Oncol. 7, 637–646 (2013). - PMC - PubMed

Publication types

MeSH terms