. 2016 Sep;148(3):227-37.
doi: 10.1085/jgp.201611616. Epub 2016 Aug 15.

Structural basis of control of inward rectifier Kir2 channel gating by bulk anionic phospholipids

Affiliations

Structural basis of control of inward rectifier Kir2 channel gating by bulk anionic phospholipids

Sun-Joo Lee et al. J Gen Physiol. 2016 Sep.

Abstract

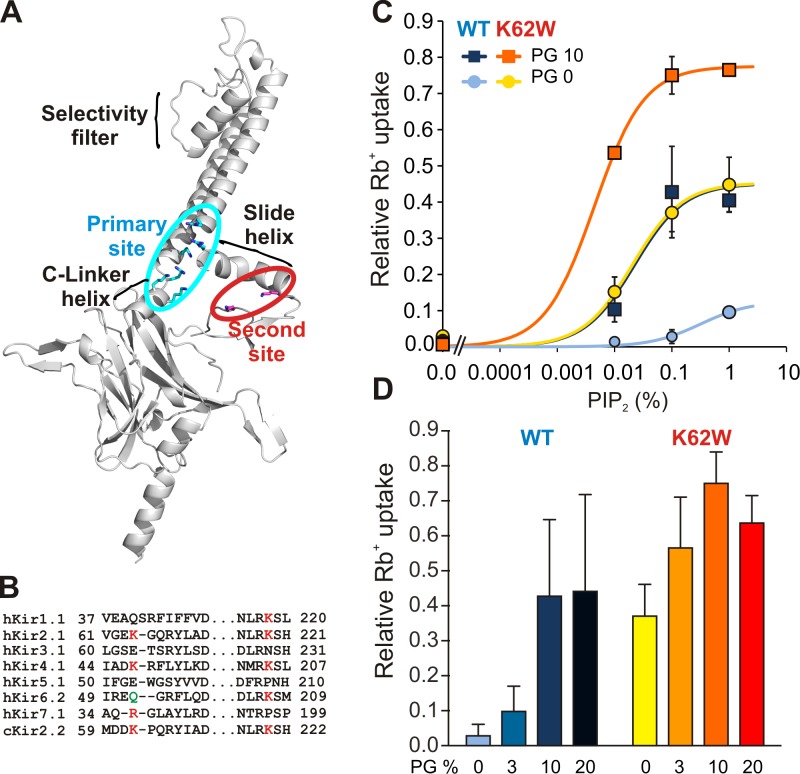
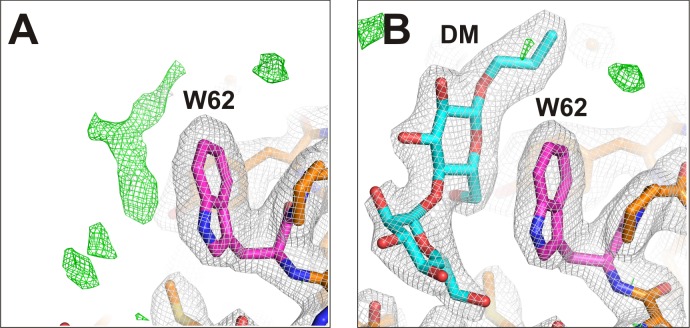
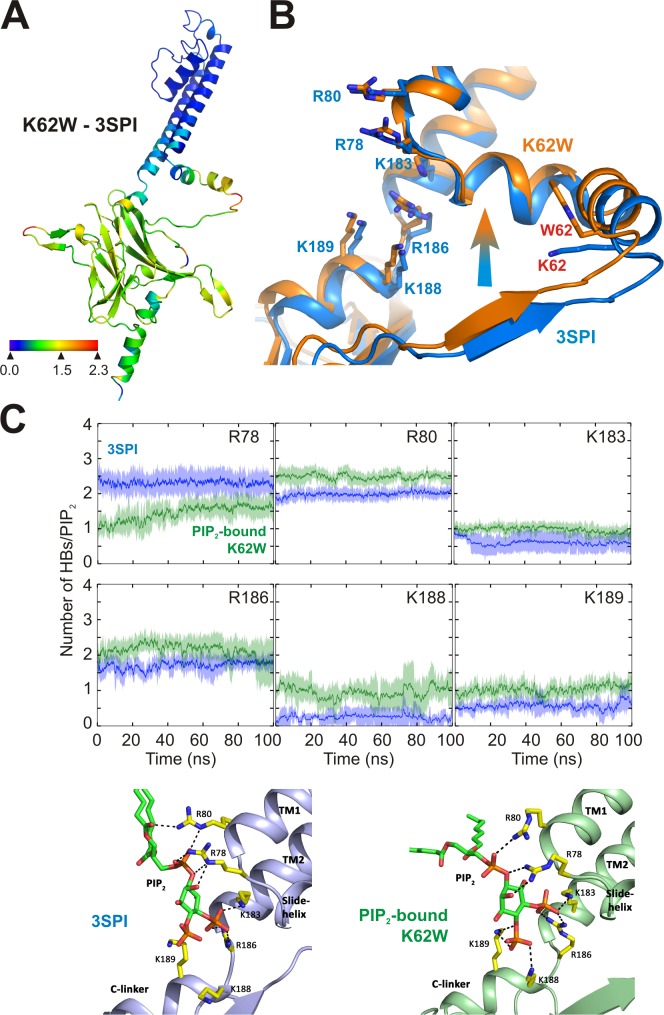
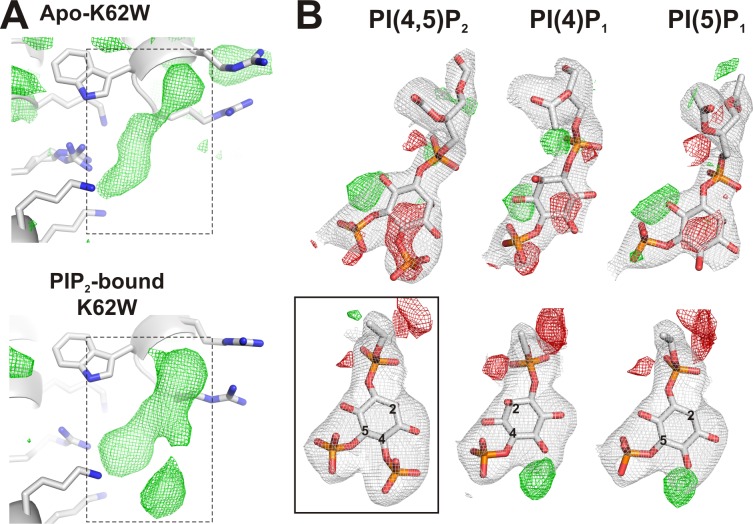
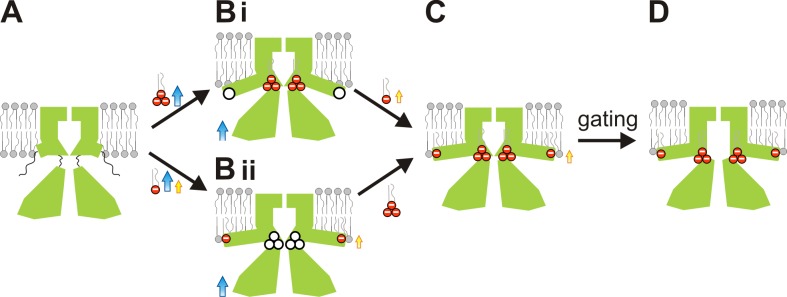
Inward rectifier potassium (Kir) channel activity is controlled by plasma membrane lipids. Phosphatidylinositol-4,5-bisphosphate (PIP2) binding to a primary site is required for opening of classic inward rectifier Kir2.1 and Kir2.2 channels, but interaction of bulk anionic phospholipid (PL(-)) with a distinct second site is required for high PIP2 sensitivity. Here we show that introduction of a lipid-partitioning tryptophan at the second site (K62W) generates high PIP2 sensitivity, even in the absence of PL(-) Furthermore, high-resolution x-ray crystal structures of Kir2.2[K62W], with or without added PIP2 (2.8- and 2.0-Å resolution, respectively), reveal tight tethering of the C-terminal domain (CTD) to the transmembrane domain (TMD) in each condition. Our results suggest a refined model for phospholipid gating in which PL(-) binding at the second site pulls the CTD toward the membrane, inducing the formation of the high-affinity primary PIP2 site and explaining the positive allostery between PL(-) binding and PIP2 sensitivity.


Figures

Figure 1.
Figure 1.
Increased PIP2 sensitivity but decreased PL sensitivity in K62W channels. (A) Ribbon diagram of Kir2.2 monomer structure (3SPI). Key functional parts of the protein are labeled, with residues comprising the primary and second sites shown in blue and red sticks, respectively. (B) Sequence alignments of selected regions of Kir subfamily members. Residues important for secondary PL interaction are shown in red. Q52 of Kir6.2 shown in green causes gain-of-function if mutated to Arg. (C) 86Rb+ uptake versus PIP2 concentration for reconstituted chicken Kir2.2 WT and K62W mutant channels, in the presence of 0 or 10% POPG lipids (mean ± SE, n = 3). The line is the best fit of the one-site binding model in each case. (D) The same experiment was performed at constant 0.1% PIP2, with increasing POPG concentrations as indicated (mean ± SE, n = 3).
Figure 2.
Figure 2.
Apo- and PIP2-bound K62W crystal structures. (A) K62W mutant channel structures determined without (Apo-, orange; PDB no. 5KUK) or with PIP2 (PIP2-bound, red; PDB no. 5KUM) are shown in ribbon diagram (PIP2 shown as space-filling balls). (B) Ribbon diagrams, colored to indicate the conformational displacement perpendicular to the membrane plane (along the z axis) between the two structures. The distance changes along the z axis at every Cα were computed after alignment of the two crystal structures at selectivity filter backbone atoms (residue 143–148). (C) I177 and M181 residues in the bundle crossing region are shown as space-filling spheres, for Apo (left) and PIP2 bound (right).
Figure 3.
Figure 3.
K62W structure at the second PL site. (A and B) The Apo-K62W structural model was generated by molecular replacement with 3SPI residue 62 as Trp (A), and final electron density and a model with a decylmaltoside detergent head group are shown (B). In each case, 2fo-fc electron density at 2.0-Å resolution, contoured at 1σ, is shown in gray. Positive fo-fc electron density at 2.0-Å resolution, contoured at 3σ, is shown in green. Pink indicates carbon atoms of the residue mutated; orange indicates carbon atoms of the wild-type residues; cyan indicates carbon atoms of the ligand (DM); blue indicates nitrogen atoms; red indicates oxygen atoms.
Figure 4.
Figure 4.
Tighter tethering of the CTD to the membrane in K62W channels. (A) Ribbon diagrams, colored to indicate the conformational displacement perpendicular to the membrane plane (along the z axis) between the Apo-K62W and PIP2-bound WT (3SPI) structures. Positive distances indicate that the corresponding residues in the first structure are closer to the membrane plane. (B) Ribbon diagram showing overlaid structures of Apo-K62W (orange) and PIP2-bound WT (blue). The residues directly interacting with PIP2 are shown in sticks and labeled in blue, and residue 62 for bulk anionic lipid binding is shown in sticks and labeled in red. (C) Three independent MD simulations were performed for 100 ns, with PIP2-bound WT (3SPI) and K62W mutant structures. After 5-ns equilibration, hydrogen bond formation between PIP2 and neighboring basic residues (Arg78, Arg80, Lys 183, Arg186, Lys188, and Arg189) was assessed, based on the distance (3.5 Å) between donor and acceptor atoms and D-A-H angle (<30o). The results are means ± SD, three independent simulations of 100 ns in each case and of four tetramers in each case. (D) Snapshots showing details of the PIP2-binding site in the PIP2-bound WT (3SPI; left) and K62W (right) structures after 100 ns. Hydrogen bonds between PIP2 and the neighboring residues (yellow sticks) are shown as black dashes.
Figure 5.
Figure 5.
Positive density at the primary site in Apo-K62W. (A) Electron density at the primary site with no ligands modeled for Apo-K62W (top) or PIP2-bound K62W (bottom). Only fo-fc electron density calculated at 2.8-Å resolution and contoured at 2.5σ (green) is shown for clarity. The dashed boxes indicate the space corresponding to electron densities shown in B. Blue indicates nitrogen atoms. (B) Electron density recalculated after refinement in the presence of putative ligands, PI(4,5)P2, PI(4)P1, or PI(5)P1 (shown as sticks). The solid box indicates the correct assignment. 2fo-fc electron density at 2.8-Å resolution for Apo-K62W and PIP2-bound K62W, respectively, contoured at 1σ, is shown in gray. fo-fc electron density at 2.8-Å resolution contoured at 3σ and −3σ is shown in green and red, respectively. Orange indicates phosphate atoms.
Figure 6.
Figure 6.
Lipid-dependent gating of Kir2 channels. (A) In the absence of any PLs, the two binding sites are unstructured and the CTD is displaced away from the membrane. (B) Binding of PIP2 at the primary site or of PL binding at the second site initiates upward movement of the CTD toward the membrane and induces the formation of the other site (white circles). (C) Subsequent binding to the other site places the channel in a preactivated state (D), from which opening is favored.

References

    1. Aryal P., Dvir H., Choe S., and Slesinger P.A.. 2009. A discrete alcohol pocket involved in GIRK channel activation. Nat. Neurosci. 12:988–995. 10.1038/nn.2358 - DOI - PMC - PubMed
    1. Berendsen H.J.C., Grigera J.R., and Straatsma T.P.. 1987. The missing term in effective pair potentials. J. Phys. Chem. 91:6269–6271. 10.1021/j100308a038 - DOI
    1. Berger O., Edholm O., and Jähnig F.. 1997. Molecular dynamics simulations of a fluid bilayer of dipalmitoylphosphatidylcholine at full hydration, constant pressure, and constant temperature. Biophys. J. 72:2002–2013. 10.1016/S0006-3495(97)78845-3 - DOI - PMC - PubMed
    1. Braun P., and von Heijne G.. 1999. The aromatic residues Trp and Phe have different effects on the positioning of a transmembrane helix in the microsomal membrane. Biochemistry. 38:9778–9782. 10.1021/bi990923a - DOI - PubMed
    1. Chen V.B., Arendall W.B. III, Headd J.J., Keedy D.A., Immormino R.M., Kapral G.J., Murray L.W., Richardson J.S., and Richardson D.C.. 2010. MolProbity: all-atom structure validation for macromolecular crystallography. Acta Crystallogr. D Biol. Crystallogr. 66:12–21. 10.1107/S0907444909042073 - DOI - PMC - PubMed

Publication types

MeSH terms

LinkOut - more resources