. 2016 Aug 5;21(8):1018.
doi: 10.3390/molecules21081018.

Modulation of Neural Network Activity through Single Cell Ablation: An in Vitro Model of Minimally Invasive Neurosurgery

Affiliations

Modulation of Neural Network Activity through Single Cell Ablation: An in Vitro Model of Minimally Invasive Neurosurgery

Alessandro Soloperto et al. Molecules. .

Abstract

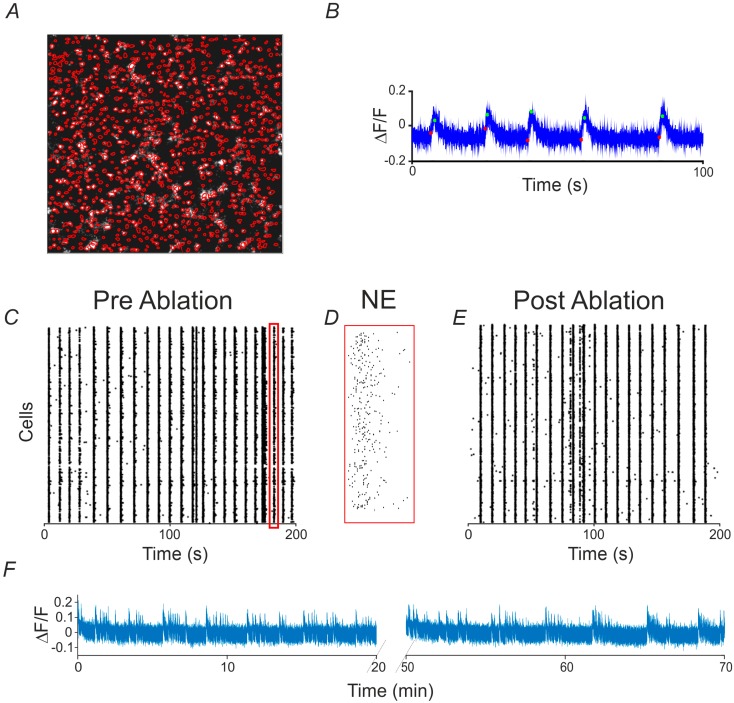
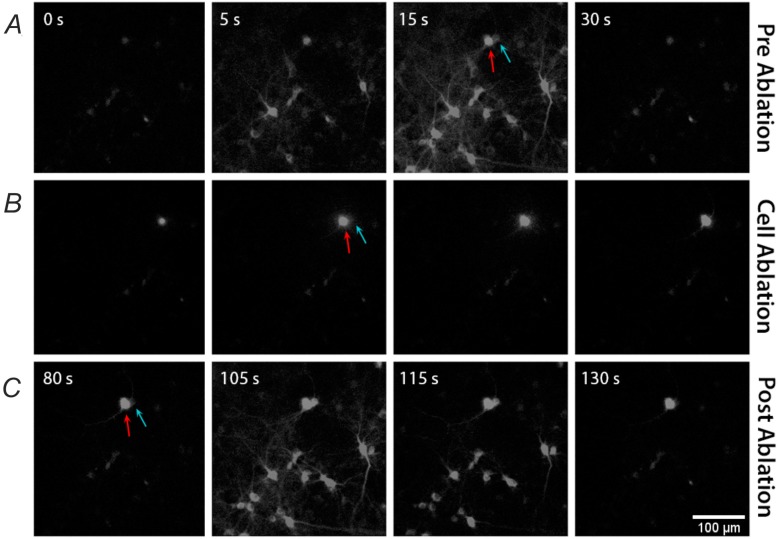
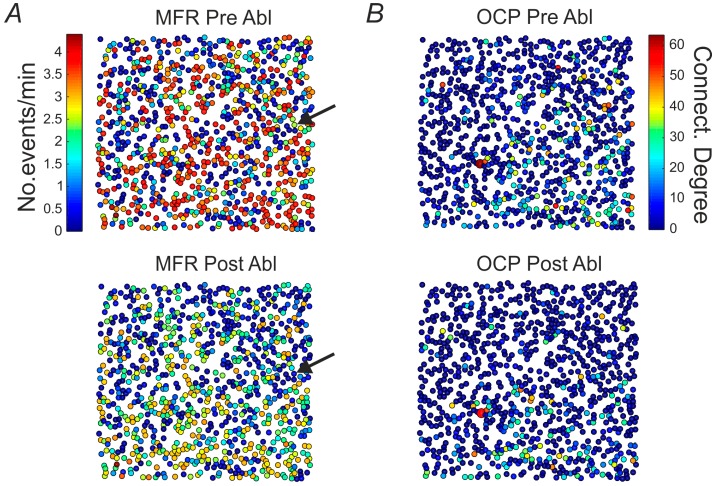
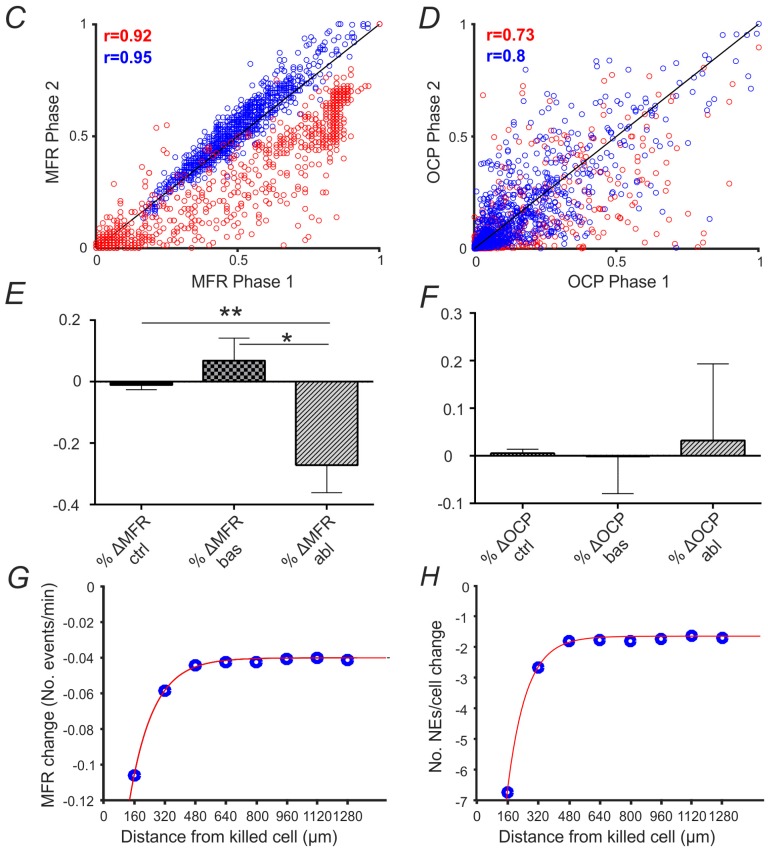
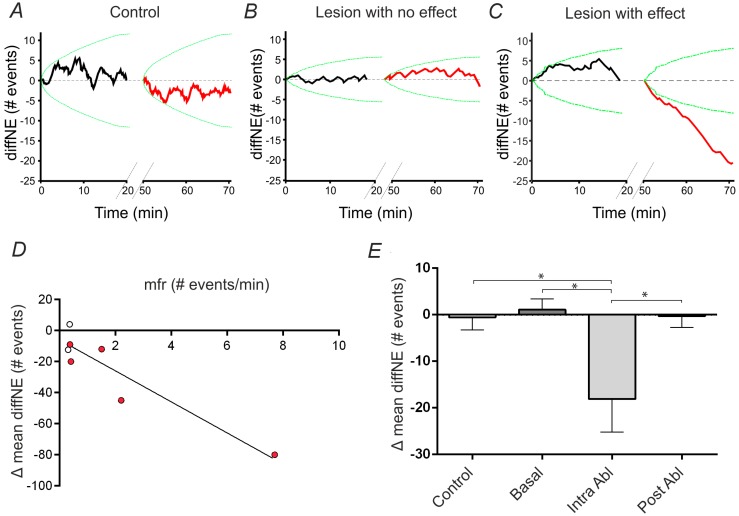
The technological advancement of optical approaches, and the growth of their applications in neuroscience, has allowed investigations of the physio-pathology of neural networks at a single cell level. Therefore, better understanding the role of single neurons in the onset and progression of neurodegenerative conditions has resulted in a strong demand for surgical tools operating with single cell resolution. Optical systems already provide subcellular resolution to monitor and manipulate living tissues, and thus allow understanding the potentiality of surgery actuated at single cell level. In the present work, we report an in vitro experimental model of minimally invasive surgery applied on neuronal cultures expressing a genetically encoded calcium sensor. The experimental protocol entails the continuous monitoring of the network activity before and after the ablation of a single neuron, to provide a robust evaluation of the induced changes in the network activity. We report that in subpopulations of about 1000 neurons, even the ablation of a single unit produces a reduction of the overall network activity. The reported protocol represents a simple and cost effective model to study the efficacy of single-cell surgery, and it could represent a test-bed to study surgical procedures circumventing the abrupt and complete tissue removal in pathological conditions.

Keywords: GCaMP; long-term calcium imaging; network firing rate; single neuron ablation; single neuron firing rate.


Conflict of interest statement

The authors declare no conflict of interest.

Figures

Figure 1
Figure 1
Long-term calcium imaging of neural networks. (A) ΔF/F image of the analyzed field of view with all the automatically detected cells’ contours superimposed in red; (B) Zoom (100 s) of a cell’s calcium trace with the automatically detected onsets and offsets of the calcium events, marked in red and green respectively; (C) A 200 s raster plot, corresponding to the basal recording before performing the ablation, in which each black dot corresponds to a calcium event onset; (D) Zoom on a NE highlighted by the red rectangle reported on the previous raster plot; (E) A 200 s raster plot corresponding to the recording phase after performing the ablation; (F) Calcium traces of two consecutive recording phases, lasting 20 min each. The two dotted oblique lines along the x-axis indicate the “dark phase”, i.e., with no recording, lasting 30 min.
Figure 2
Figure 2
Single cell ablation in neural network. (A) Calcium activity for zoomed subset of neurons before single cell ablation; (B) Focused laser ablation of a single cell. The laser ablation were performed by delivering the laser beam for approximately 200 ms at a pulse repetition rate of 100 Hz and with an average laser power of 15 µW; (C) Calcium activity of the same neural subset after single cell laser ablation. The red arrows indicate the ablated cell. Note that the cell (marked with the blue arrows) nearby to the ablated cell shows a regular fluorescent calcium signal is not affected by the adjacent laser manipulation. The subfield of view is 330 µm × 330 µm. Time lapse calcium imaging was acquired at 50 Hz.
Figure 3
Figure 3
Mean firing Rate and Output Connections Percentage of single cells and neural networks before and after cell ablation. (A) MFR map obtained before (top) and after ablating a single cell (bottom) in which a global decrease of the mean firing rate is observable according to the common color legend shown next to the upper map. Each colored dot represents the location of a neuron in the network. The arrows indicate the cell that has been ablated. The color-bar indicates the number of calcium events per minute; (B) OCP map obtained before (top) and after ablating a single cell (bottom) in which no significant difference is produced in the OCP map after ablating a cell. The color-bar represents the normalized connectivity degree (see Methods); (C) MFR computed before performing the ablation vs. MFR computed after performing the ablation (red scatter plot), and MFR of a control experiment computed for two consecutive basal recording phases (blue scatter plot), reported for all the cells detected in the studied field of view; (D) OCP computed before performing the ablation vs. OCP computed after performing it (red scatter plot), and OCP of a control experiment computed for two consecutive basal recording phases (blue scatter plot), reported for all the cells detected in the studied field of view; (E) Percentage difference of the average MFR values computed between two consecutive basal recording phases of a control experiment (left bar), of an experiment with ablation (middle bar) and between two consecutive recording phases interspersed by a single cell ablation (right bar). The first and the second data group are statistically different from the third one and the used statistical test is the unpaired Student’s t test (two-sided) (* p < 0.05 and ** p < 0.01); (F) Percentage difference of the average OCP computed between two consecutive basal recording phases of a control experiment (left bar), of an experiment with ablation (middle bar) and between two consecutive recordings interspersed by a single cell ablation (right bar). The three data groups are not statistically different and the used statistical test is the unpaired Student’s t test (two-sided). In both cases, the number of experiments used to perform the statistical analysis is 9. Data were collected from independent experiments and are expressed as mean ± SEM (i.e., Standard Error of the Mean); (G) Average MFR change between the pre-ablation and the post-ablation phase with respect to the distance from the killed cell; (H) Average number of NEs per cell variation between the pre-ablation and the post-ablation phase with respect to the distance from the killed cell. The red lines correspond to the exponential fitting.
Figure 3
Figure 3
Mean firing Rate and Output Connections Percentage of single cells and neural networks before and after cell ablation. (A) MFR map obtained before (top) and after ablating a single cell (bottom) in which a global decrease of the mean firing rate is observable according to the common color legend shown next to the upper map. Each colored dot represents the location of a neuron in the network. The arrows indicate the cell that has been ablated. The color-bar indicates the number of calcium events per minute; (B) OCP map obtained before (top) and after ablating a single cell (bottom) in which no significant difference is produced in the OCP map after ablating a cell. The color-bar represents the normalized connectivity degree (see Methods); (C) MFR computed before performing the ablation vs. MFR computed after performing the ablation (red scatter plot), and MFR of a control experiment computed for two consecutive basal recording phases (blue scatter plot), reported for all the cells detected in the studied field of view; (D) OCP computed before performing the ablation vs. OCP computed after performing it (red scatter plot), and OCP of a control experiment computed for two consecutive basal recording phases (blue scatter plot), reported for all the cells detected in the studied field of view; (E) Percentage difference of the average MFR values computed between two consecutive basal recording phases of a control experiment (left bar), of an experiment with ablation (middle bar) and between two consecutive recording phases interspersed by a single cell ablation (right bar). The first and the second data group are statistically different from the third one and the used statistical test is the unpaired Student’s t test (two-sided) (* p < 0.05 and ** p < 0.01); (F) Percentage difference of the average OCP computed between two consecutive basal recording phases of a control experiment (left bar), of an experiment with ablation (middle bar) and between two consecutive recordings interspersed by a single cell ablation (right bar). The three data groups are not statistically different and the used statistical test is the unpaired Student’s t test (two-sided). In both cases, the number of experiments used to perform the statistical analysis is 9. Data were collected from independent experiments and are expressed as mean ± SEM (i.e., Standard Error of the Mean); (G) Average MFR change between the pre-ablation and the post-ablation phase with respect to the distance from the killed cell; (H) Average number of NEs per cell variation between the pre-ablation and the post-ablation phase with respect to the distance from the killed cell. The red lines correspond to the exponential fitting.
Figure 4
Figure 4
Quantification of the single cell ablation effect on neural network activity. (A) Difference between expected and measured NEs as function of time (diffNE(t)) for a control stable experiment. The reference frequency of expected events has been calculated in the first basal phase (same applies to panel D and E). The two oblique lines along the x axis represent the “dark phase”, lasting 30 min, during which cultures are kept in the set-up at rest, without exposing them to light (same applies to panel D and E). The variability of the activity of the second basal phase follow within the chance-level limit (green lines, p = 0.01) estimated on random sequences of inter-NEs the latter ones measured in the first basal phase. A dataset of a thousand surrogate NE time series was used; (B) Same as panel A, but for a representative lesion-experiment in which the ablation of a cell has no clear effect on the overall network’s firing activity. Such an experiment preciously passed the stability criteria described in panel A; (C) Same as panel B, but for a representative lesion-experiment in which the ablation of a cell impact significantly the overall network’s firing activity; (D) Difference between the mean “diffNE” value computed within the 20 min duration of the second phase and the mean “diffNE” value computed within the 20 min of the first phase as a function of the ablated cell’s mean firing rate, evaluated in the first basal phase. The red dots represent the experiments in which the lesion had a significant effect, as described in the right figure of panel A; (E) Difference between the mean “diffNE” value computed within the 20 min duration of the second phase and the mean “diffNE” value computed within the 20 min of the first phase. From left to right, the reported bars have been obtained considering the two following consecutive recording phases: (i) two phases of a control experiment, in which no lesion is present between the two phases; (ii) two consecutive basal phases preceding the lesion (see the protocol of experiment with a lesion, in Supplementary Materials Figure S2); (iii) two phases in which in between the lesion has been performed; (iv) two phases acquired after performing the lesion. The asterisks indicate which groups are statistically different (one way ANOVA test (* p < 0.05)). Data were collected from independent experiments and are expressed as mean ± SEM (i.e., Standard Error of the Mean).

References

    1. Vogel A., Noack J., Hüttman G., Paltauf G. Mechanisms of femtosecond laser nanosurgery of cells and tissues. Appl. Phys. B. 2005;81:1015–1047. doi: 10.1007/s00340-005-2036-6. - DOI
    1. Diaspro A. Confocal and Two-Photon Microscopy: Foundations, Applications and Advances. Wiley; Hoboken, NJ, USA: 2001.
    1. Eklof-Ljunggren E., Haupt S., Ausborn J., Dehnisch I., Uhlen P., Higashijima S.-I., El Manira A. Origin of excitation underlying locomotion in the spinal circuit of zebrafish. Proc. Natl. Acad. Sci. USA. 2012;109:5511–5516. doi: 10.1073/pnas.1115377109. - DOI - PMC - PubMed
    1. Habibey R., Golabchi A., Latifi S., Difato F., Blau A. Microchannel device for selective laser dissection, long-term microelectrode array electrophysiology and imaging of confined axonal projections. Lab Chip. 2015;15:4578–4590. doi: 10.1039/C5LC01027F. - DOI - PubMed
    1. Kirkpatrick J.B., Higgins M.L., Lucas J.H., Gross G.W. In vitro simulation of neural trauma by laser. J. Neuropathol. Exp. Neurol. 1985;44:268–284. doi: 10.1097/00005072-198505000-00005. - DOI - PubMed

LinkOut - more resources