. 2016 Aug 5;17(8):1272.
doi: 10.3390/ijms17081272.

Gene Set-Based Integrative Analysis Revealing Two Distinct Functional Regulation Patterns in Four Common Subtypes of Epithelial Ovarian Cancer

Affiliations

Gene Set-Based Integrative Analysis Revealing Two Distinct Functional Regulation Patterns in Four Common Subtypes of Epithelial Ovarian Cancer

Chia-Ming Chang et al. Int J Mol Sci. .

Abstract

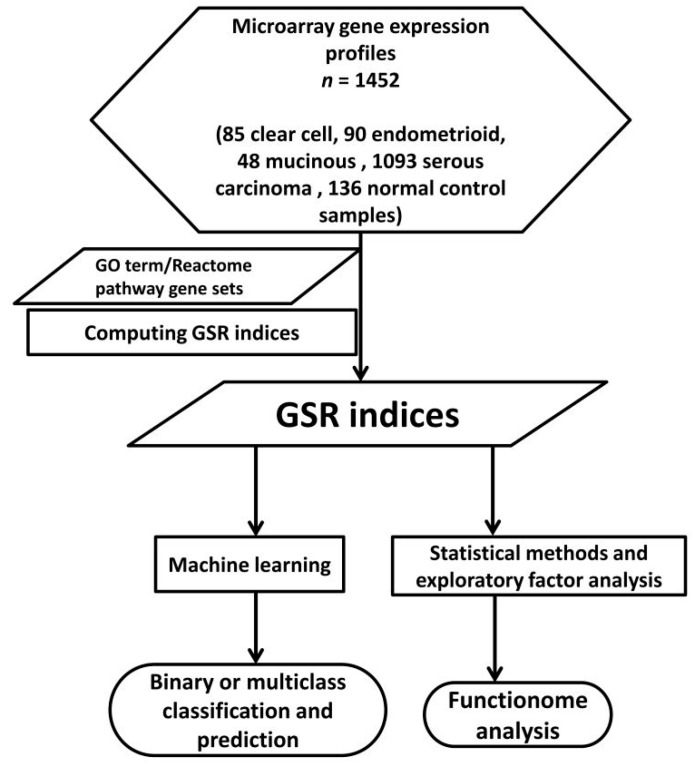
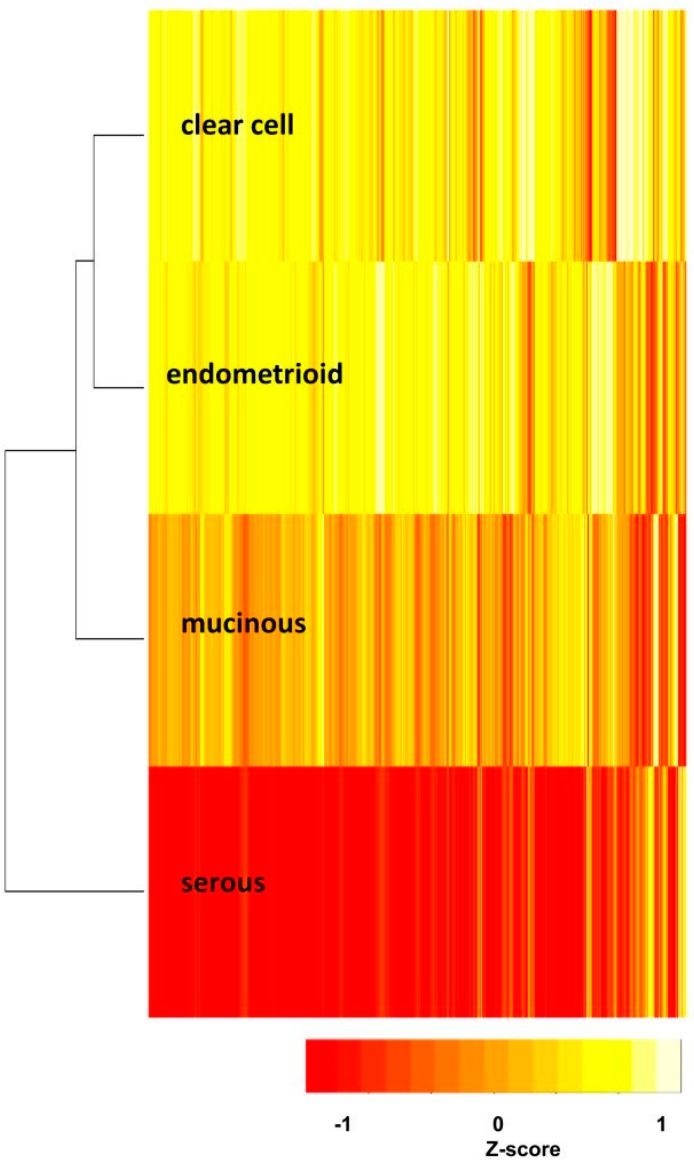
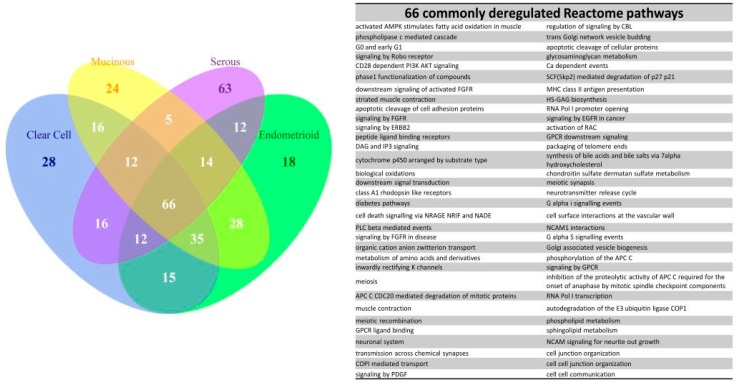
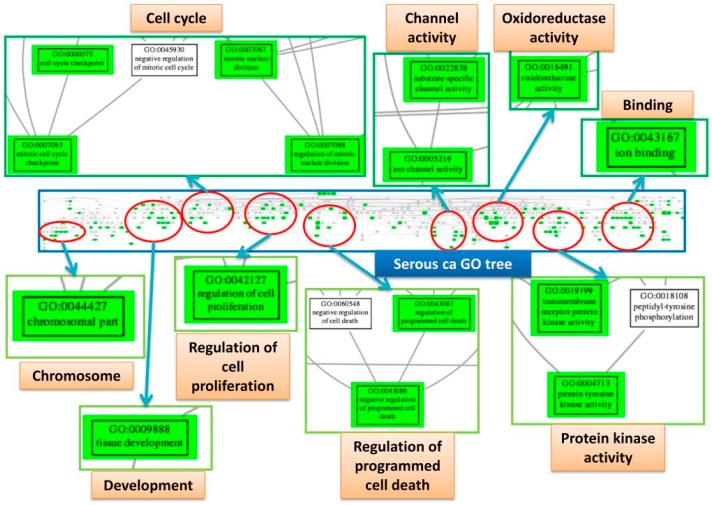
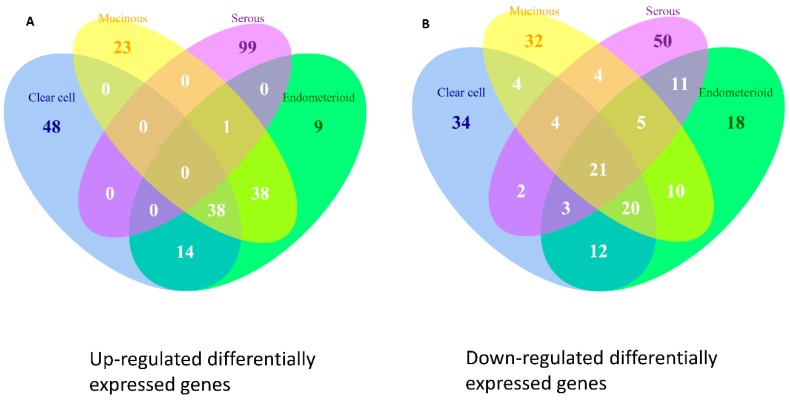
Clear cell (CCC), endometrioid (EC), mucinous (MC) and high-grade serous carcinoma (SC) are the four most common subtypes of epithelial ovarian carcinoma (EOC). The widely accepted dualistic model of ovarian carcinogenesis divided EOCs into type I and II categories based on the molecular features. However, this hypothesis has not been experimentally demonstrated. We carried out a gene set-based analysis by integrating the microarray gene expression profiles downloaded from the publicly available databases. These quantified biological functions of EOCs were defined by 1454 Gene Ontology (GO) term and 674 Reactome pathway gene sets. The pathogenesis of the four EOC subtypes was investigated by hierarchical clustering and exploratory factor analysis. The patterns of functional regulation among the four subtypes containing 1316 cases could be accurately classified by machine learning. The results revealed that the ERBB and PI3K-related pathways played important roles in the carcinogenesis of CCC, EC and MC; while deregulation of cell cycle was more predominant in SC. The study revealed that two different functional regulation patterns exist among the four EOC subtypes, which were compatible with the type I and II classifications proposed by the dualistic model of ovarian carcinogenesis.

Keywords: epithelial ovarian cancer; function; gene expression microarray; gene set; integrative analysis; machine learning.


Figures

Figure 1
Figure 1
Workflow of the gene set regularity model. The gene set regularity (GSR) index was computed by converting the gene expression rankings of each epithelial ovarian carcinoma (EOC) subtype or normal ovarian control sample through each gene Contrology (GO) term or Reactome pathway gene set. Machine learning algorithm was trained to recognize the patterns consisted of the GSR indices then executed the binary (EOC vs. control) or multiclass (four EOC subtypes + control) classifications. Functionome analyses were carried out by statistical methods, hierarchical clustering and exploratory factor analysis.
Figure 2
Figure 2
Histograms of the four subtypes. The gene set regularity (GSR) indices for each subtype and normal control group were displayed on the histograms by density. The GSR indices for the two groups showed two distinguishable distributions on the histograms; the distribution consisted of the GSR indices for the EOC subtypes (orange) located on the left side had smaller levels, indicating the biological functions were generally more deregulated in the EOC subtypes than the normal control group (blue).
Figure 3
Figure 3
Heatmap and dendrogram of the four subtypes. The heatmap and dendrogram (left side of the heatmap) demonstrated the relationships of the four EOC subtypes. The heatmap showed the CCC and EC groups were the closest, while the SC group exhibited farthest relationship from the others and the most seriously deregulated functions. The red color in the heatmap was correlated with lower, and yellow color with higher value of gene set regularity index.
Figure 4
Figure 4
Venn diagram of the top 200 significantly deregulated GO terms for the four subtypes. The results of set analysis for the four ECO subtypes with the top 200 significantly deregulated GO terms ranked by the p values were displayed on the Venn diagram to show the gene set numbers of all possible logical relations among the four subtypes. The 27 common deregulated GO terms among the four subtypes were listed on the right side of the diagram.
Figure 5
Figure 5
Venn diagram of the top 200 significantly deregulated Reactome pathways for the four subtypes. The results of set analysis for the four EOC subtypes with the top 200 significantly deregulated Reactome pathways ranked by the p values were displayed on the Venn diagram to show the gene set numbers of all possible logical relations among the four subtype groups. The 66 common deregulated Reactome pathways among the four subtype groups were listed on the right side of the diagram.
Figure 6
Figure 6
GO tree of SC. This figure displayed the screenshot of the full GO tree for SC (middle). After mapping to the GO tree, the similar GO terms clustered together. Each cluster was circled (red) and some of the important deregulated GO terms (green boxes) in the cluster were magnified to view the details. Each cluster was labeled by the common parental GO term (orange rectangle).
Figure 7
Figure 7
Venn diagram of the top 100 up- and down-regulated differentially expressed genes (DEGs) for the four subtypes. The results of set analysis for the four ECO subtypes with (A) the top 100 up-regulated; and (B) top 100 down-regulated DEGs were ranked by the p values, and the DEG numbers of all possible logical relationships among the four subtypes were shown.

References

    1. Kurman R.J., Shih Ie M. Pathogenesis of ovarian cancer: Lessons from morphology and molecular biology and their clinical implications. Int. J. Gynecol. Pathol. 2008;27:151–160. doi: 10.1097/PGP.0b013e318161e4f5. - DOI - PMC - PubMed
    1. Cho K.R., Shih Ie M. Ovarian cancer. Annu. Rev. Pathol. 2009;4:287–313. doi: 10.1146/annurev.pathol.4.110807.092246. - DOI - PMC - PubMed
    1. Eddy J.A., Hood L., Price N.D., Geman D. Identifying tightly regulated and variably expressed networks by Differential Rank Conservation (DIRAC) PLoS Comput. Biol. 2010;6:1272. doi: 10.1371/journal.pcbi.1000792. - DOI - PMC - PubMed
    1. Ashburner M., Ball C.A., Blake J.A., Botstein D., Butler H., Cherry J.M., Davis A.P., Dolinski K., Dwight S.S., Eppig J.T., et al. Gene ontology: Tool for the unification of biology. Nat. Genet. 2000;25:25–29. doi: 10.1038/75556. - DOI - PMC - PubMed
    1. Milacic M., Haw R., Rothfels K., Wu G., Croft D., Hermjakob H., D'Eustachio P., Stein L. Annotating cancer variants and anti-cancer therapeutics in reactome. Cancers (Basel) 2012;4:1180–1211. doi: 10.3390/cancers4041180. - DOI - PMC - PubMed