Review
. 2017 Feb;45(2):323-336.
doi: 10.1002/jmri.25419. Epub 2016 Aug 16.

Restriction spectrum imaging: An evolving imaging biomarker in prostate MRI

Affiliations
Review

Restriction spectrum imaging: An evolving imaging biomarker in prostate MRI

Ryan L Brunsing et al. J Magn Reson Imaging. 2017 Feb.

Abstract

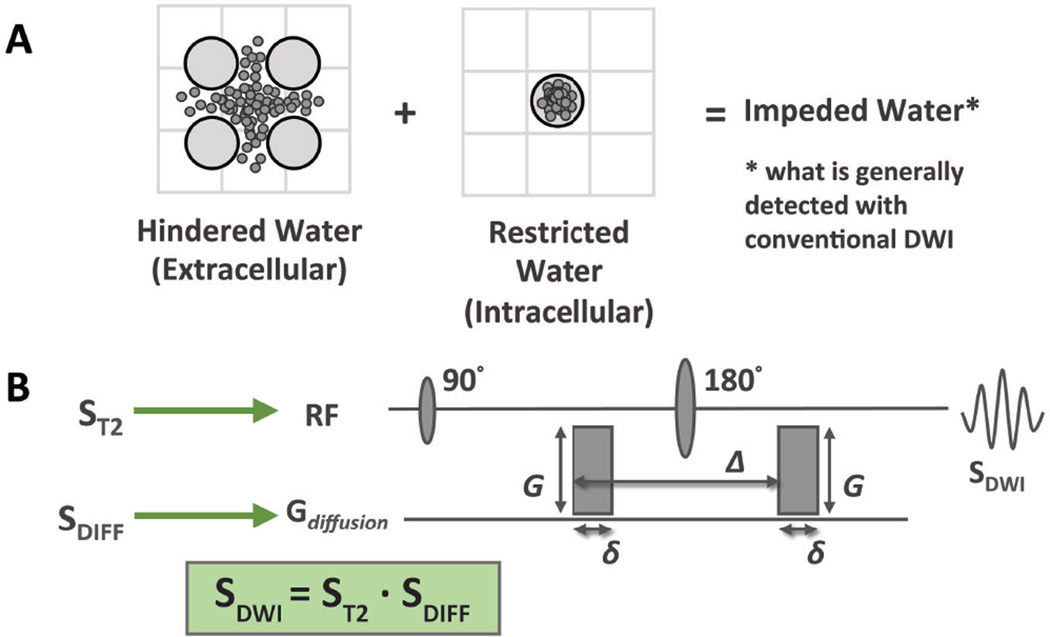
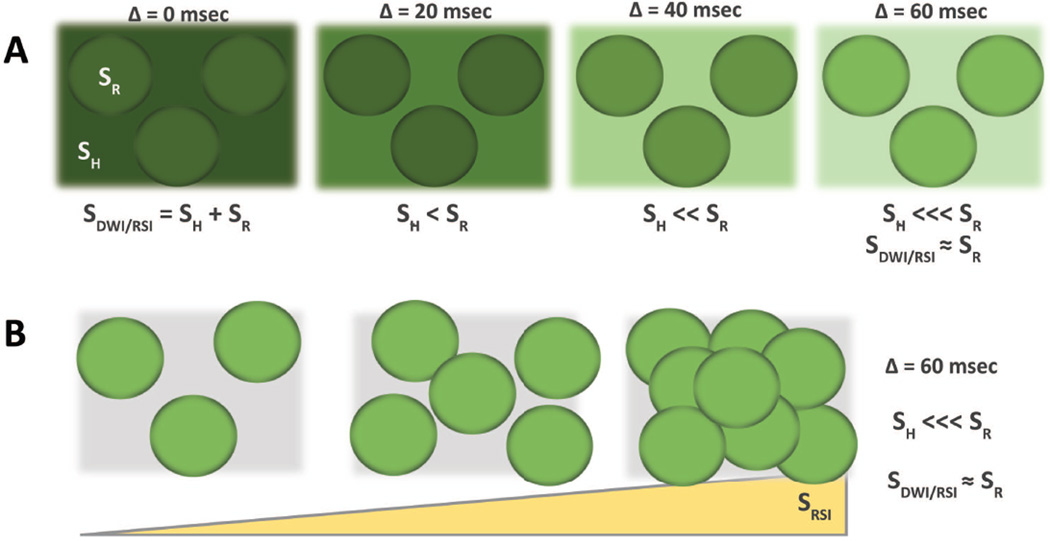
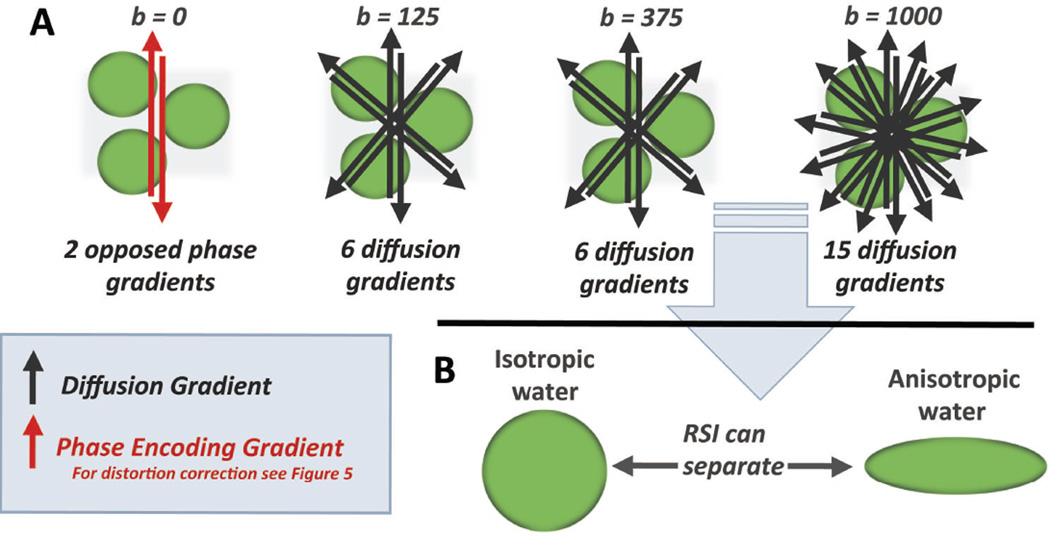
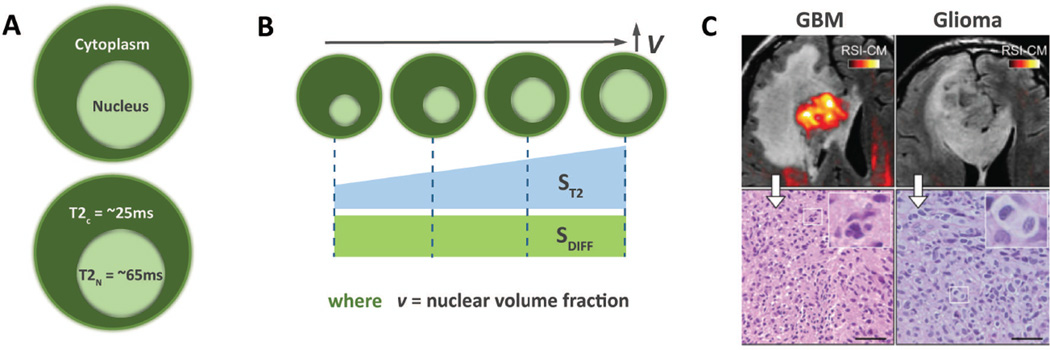
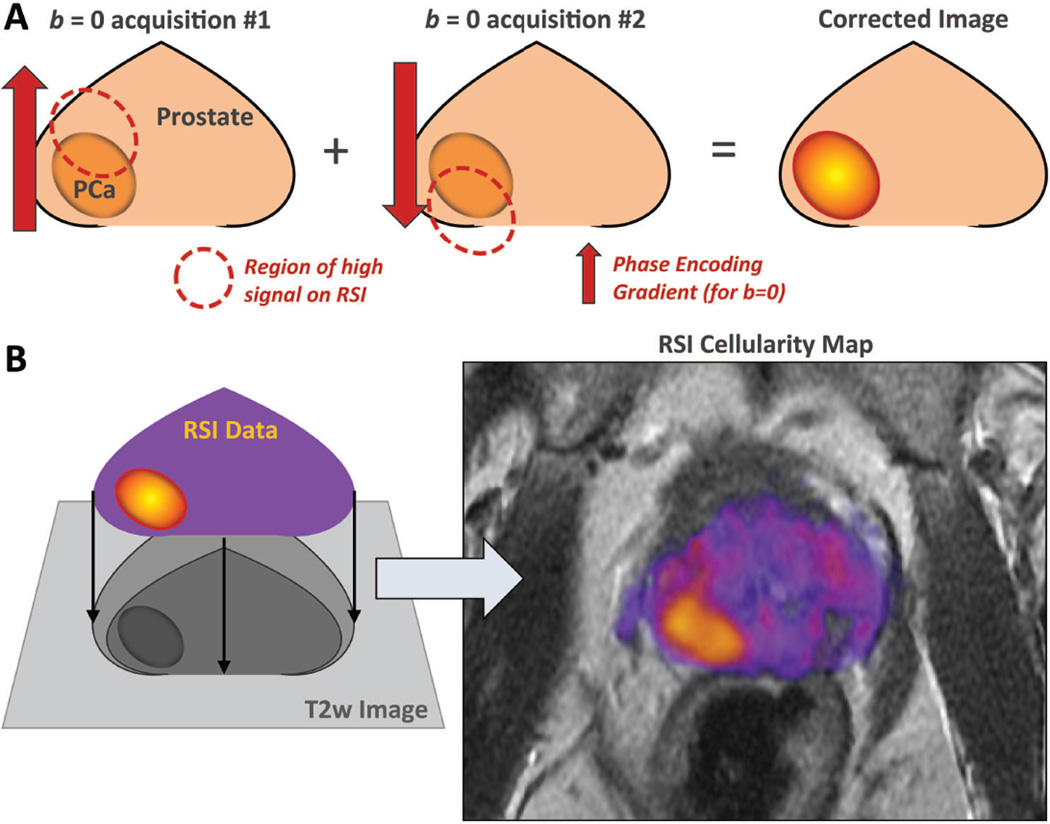
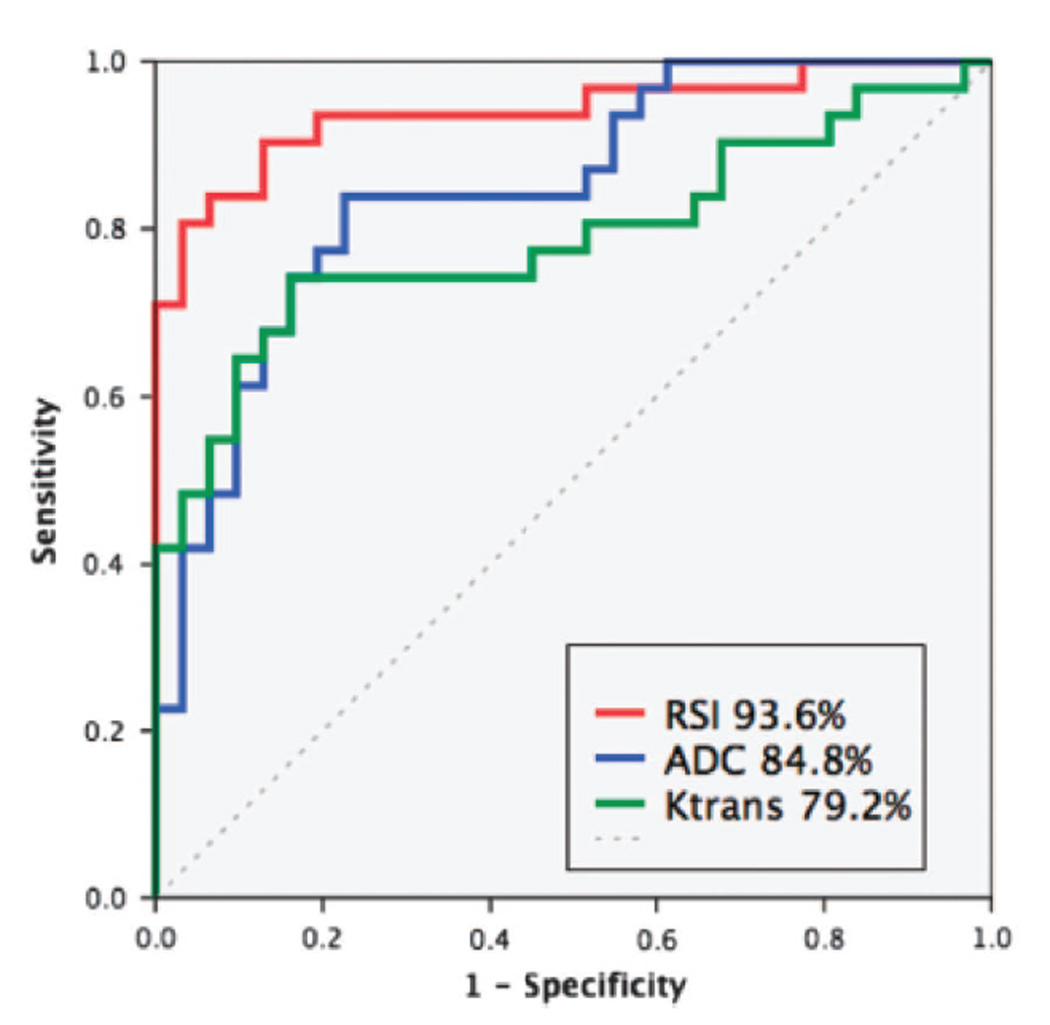
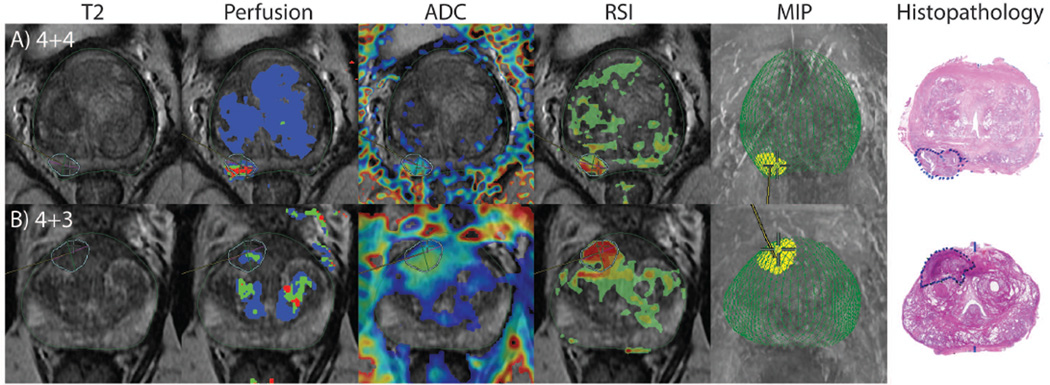
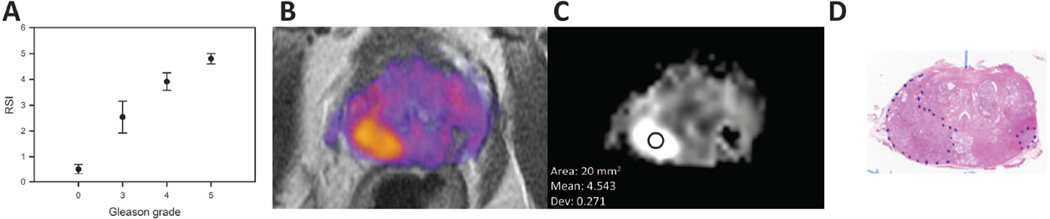
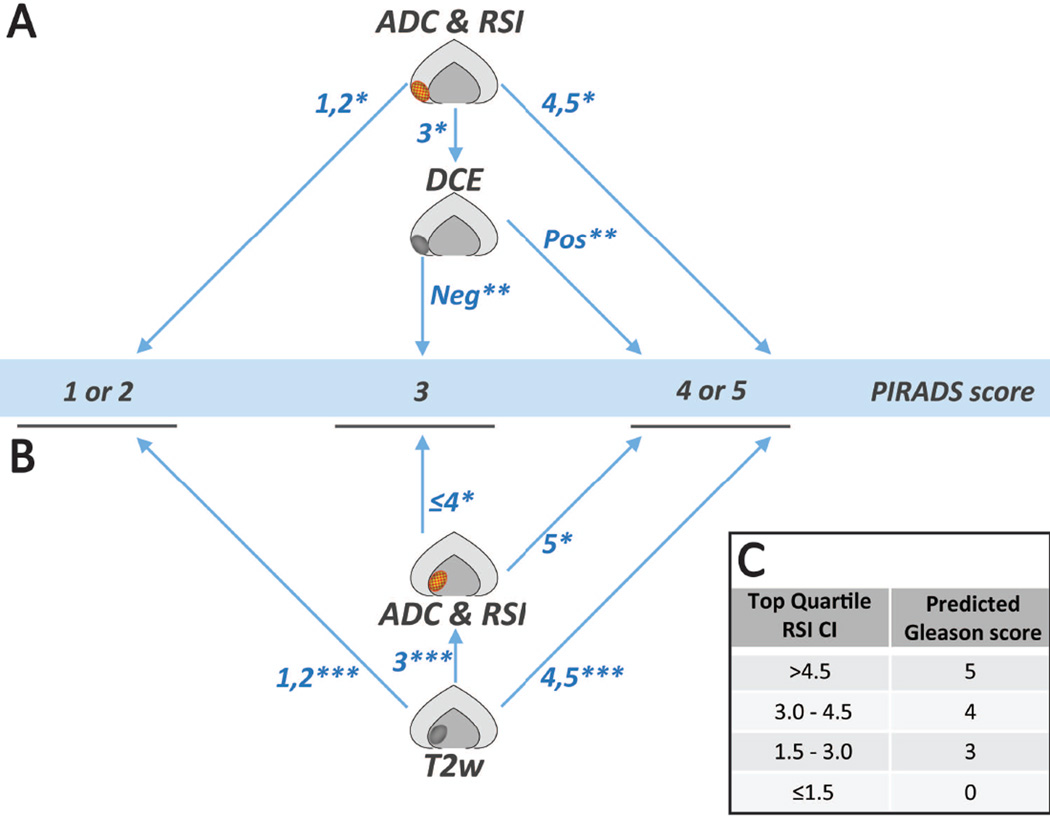
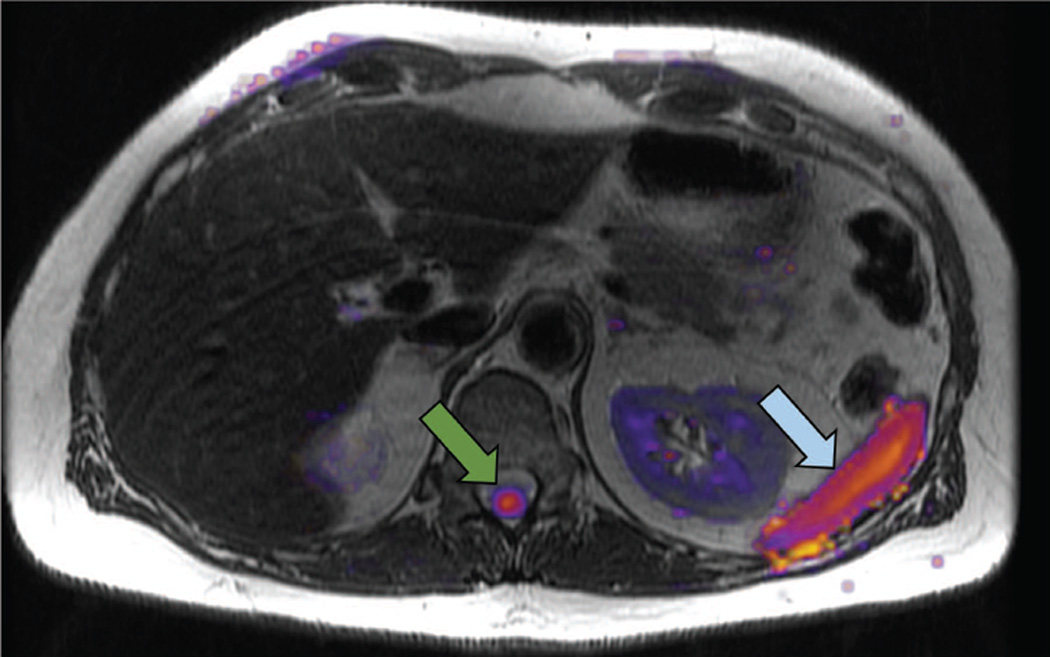
Restriction spectrum imaging (RSI) is a novel diffusion-weighted MRI technique that uses the mathematically distinct behavior of water diffusion in separable microscopic tissue compartments to highlight key aspects of the tissue microarchitecture with high conspicuity. RSI can be acquired in less than 5 min on modern scanners using a surface coil. Multiple field gradients and high b-values in combination with postprocessing techniques allow the simultaneous resolution of length-scale and geometric information, as well as compartmental and nuclear volume fraction filtering. RSI also uses a distortion correction technique and can thus be fused to high resolution T2-weighted images for detailed localization, which improves delineation of disease extension into critical anatomic structures. In this review, we discuss the acquisition, postprocessing, and interpretation of RSI for prostate MRI. We also summarize existing data demonstrating the applicability of RSI for prostate cancer detection, in vivo characterization, localization, and targeting.

Level of evidence: 5 J. Magn. Reson. Imaging 2017;45:323-336.

Keywords: biomarker; diffusion-weighted imaging; prostate cancer; restriction spectrum imaging.


Figures

Figure 1
Figure 1
Foundations of DWI: (A) Water within tissue can be confined to the intracellular or extracellular compartment, the intracellular water having a limited range determined by the configuration of the plasma membrane. The combined signal from both is measured in conventional DWI and referred to as impeded water. (B) Standard spin-echo echo-planar pulse sequence used in conventional diffusion weighted imaging. It is important to note that signal from diffusion imaging represents the sum effect of both the diffusion and T2 properties of the tissue being probed.
Figure 2
Figure 2
Foundations of RSI – Compartmental filtering; (A) with time, the signal from hindered water dissipates more quickly than that from restricted water (darker green indicates greater signal). (B) Signal from RSI increases with greater cell density.
Figure 3
Figure 3
Foundations of RSI – Geometric Filtering; (A) schematic outlining the basic parameters of the RSI multishell acquisition, with opposed phase encoding gradients in the b = 0 acquisition used for distortion correction and 6, 6, and 15 non-parallel gradients for the non-zero b values. (B) Using this data, RSI can simultaneously acquire length-scale distribution data and geometric information, allowing isolation of isotropic and anisotropic orientation data. In prostate cancer, RSI is used to isolate signal from highly restricted and isotropic water.
Figure 4
Figure 4
Foundations of RSI – Nuclear Volume Fraction; (A) The inherent T2 signal of the cytoplasm and nucleus differ substantially (B) Increasing nuclear volume fraction (NVF) results in a corresponding increase in effective T2. As the nucleus and cytoplasm exhibit similar diffusion properties, this change in effective T2 can be measured and used to calculate NVF.
Figure 5
Figure 5
Foundations of RSI – Distortion Correction; (A) Opposed phase encode gradients are used to cancel out distortion caused by magnetic field inhomogeneities, allowing for the (B) fusion of RSI cellularity maps with high resolution anatomic images. These fused images are the foundation of clinical RSI interpretation.
Figure 6
Figure 6
Receiver-operating Characteristic curves for the quantitative discrimination of prostate cancer from normal peripheral zone. Areas under the curve are listed in the legend. Used with permission from McCammack et al. PCAN, 2016.
Figure 7
Figure 7
(A) RSI guided biopsy where ADC is equivocal, but RSI clearly identifies the lesion. (B) RSI guided biopsy finds high grade disease after repeated negative systematic biopsies. Modified with permission from McCammack et al. PCAN 2016.
Figure 8
Figure 8
(A) Correlation between primary Gleason score and RSI cellularity index, using the same data presented in McCammack et al. PCAN, 2016, reanalyzed to show the top quartile for each region of interest (ROI). Benign: 0–1.5; Primary 3: 1.5–3; Primary 4: 3–4.5; Primary 5: >4.5; (B) RSI cellularity map in color; (C) RSI cellularity map in gray-scale, showing the RSI cellularity index for the indicated ROI; (D) corresponding whole-mount histopathology slide with the tumor outline in blue.
Figure 9
Figure 9
Proposed follow-up guidelines based on PIRADSv2 incorporating RSI-MRI. (A) Peripheral Zone; (B) Transitional Zone; (C) predicted Gleason score based on RSI Cellularity index (CI). *using PIRADSv2 guidelines for conventional DWI; **using PIRADSv2 guidelines for dynamic contrast enhancement; ***using PIRADSv2 guidelines for T2 weighted images
Figure 10
Figure 10
Limitations of RSI: normal structures with high signal on the RSI cellularity map include the spinal cord (green arrow) and the spleen (blue arrow).

References

    1. Society AC. Cancer Facts and Figures. Americal Cancer Society. 2016
    1. SEER Stat Fact Sheet. Surveillance, Epidemiology, and End Results Program: National Cancer Institute.
    1. Ueno Y, Tamada T, Bist V, et al. Multiparametric magnetic resonance imaging: Current role in prostate cancer management. Int J Urol. 2016 - PubMed
    1. Oppenheimer DC, Weinberg EP, Hollenberg GM, Meyers SP. Multiparametric Magnetic Resonance Imaging of Recurrent Prostate Cancer. J Clin Imaging Sci. 2016;6:18. - PMC - PubMed
    1. Felker ER, Margolis DJ, Nassiri N, Marks LS. Prostate cancer risk stratification with magnetic resonance imaging. Urol Oncol. 2016 - PMC - PubMed

Publication types

MeSH terms