. 2016 Sep 13;7(37):60475-60490.
doi: 10.18632/oncotarget.11125.

A single nucleotide polymorphism genotyping platform for the authentication of patient derived xenografts

Affiliations

A single nucleotide polymorphism genotyping platform for the authentication of patient derived xenografts

Jad El-Hoss et al. Oncotarget. .

Abstract

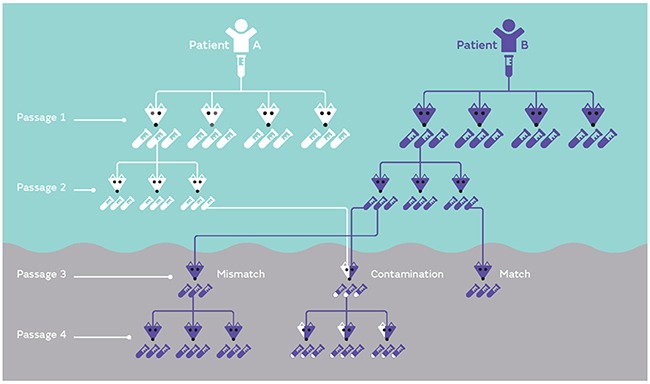
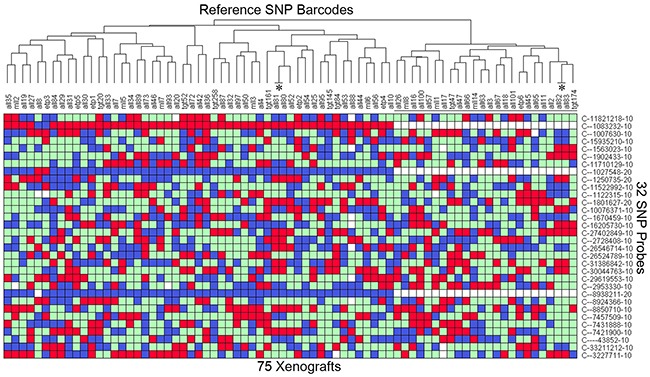
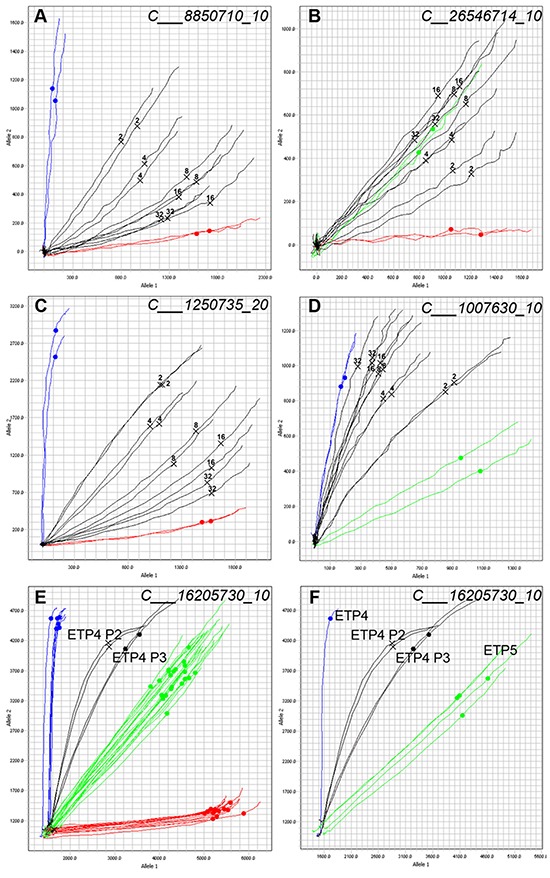
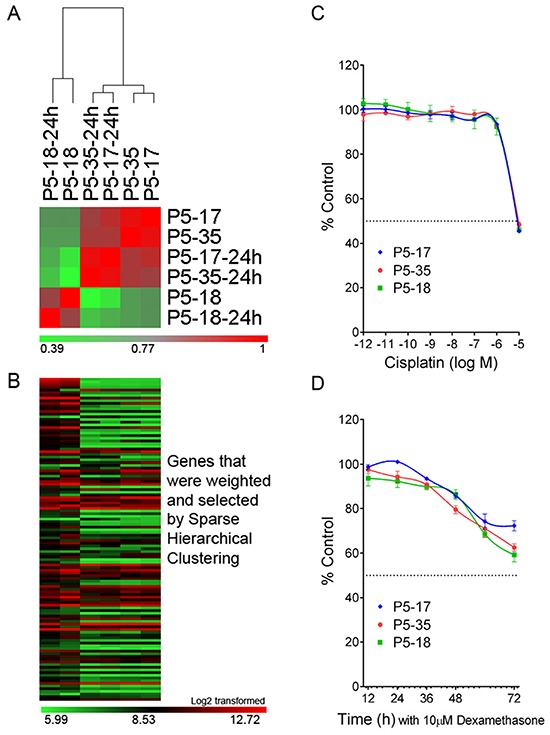
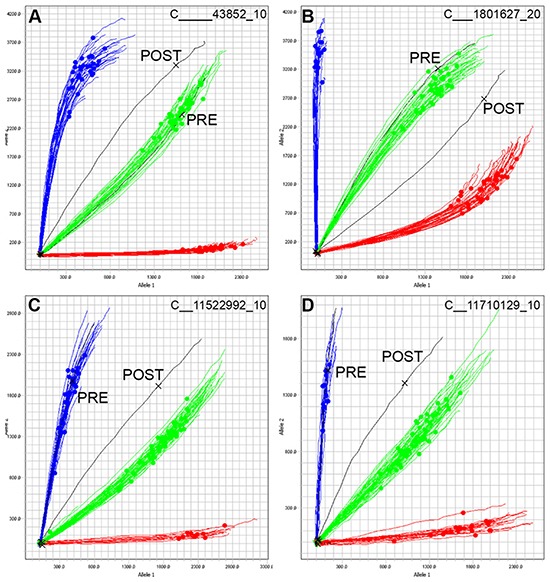
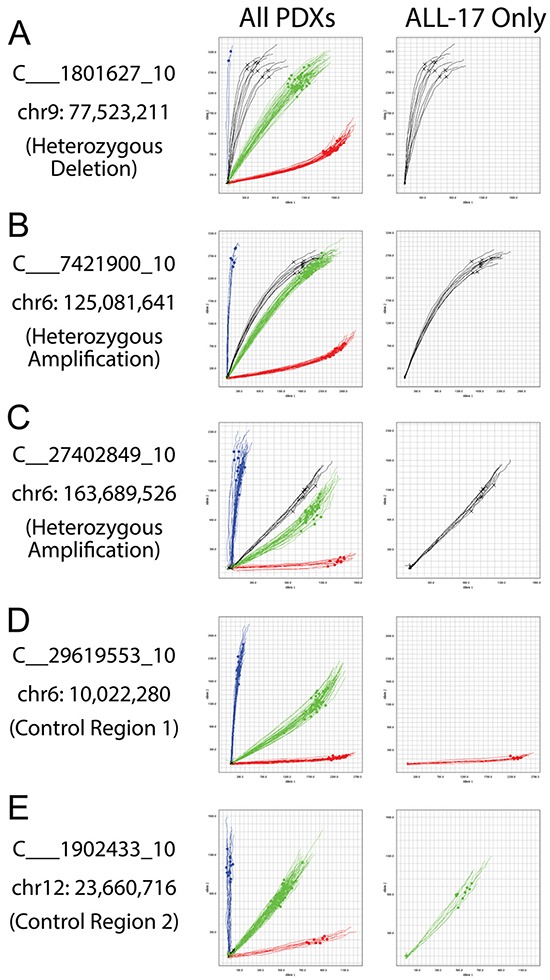
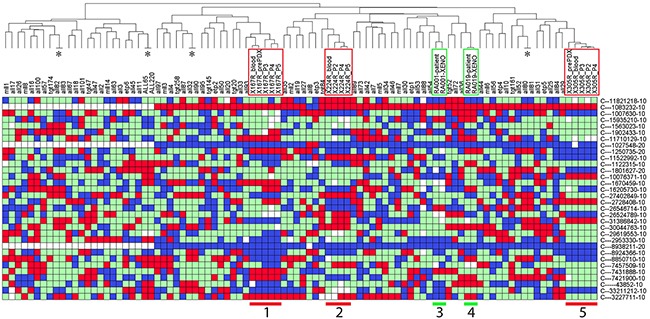
Patient derived xenografts (PDXs) have become a vital, frequently used, component of anti-cancer drug development. PDXs can be serially passaged in vivo for years, and shared across laboratories. As a consequence, the potential for mis-identification and cross-contamination is possible, yet authentication of PDXs appears limited. We present a PDX Authentication System (PAS), by combining a commercially available OpenArray assay of single nucleotide polymorphisms (SNPs) with in-house R studio programs, to validate PDXs established in individual mice from acute lymphoblastic leukemia biopsies. The PAS is sufficiently robust to identify contamination at levels as low as 3%, similar to the gold standard of short tandem repeat (STR) profiling. We have surveyed a panel of PDXs established from 73 individual leukemia patients, and found that the PAS provided sufficient discriminatory power to identify each xenograft. The identified SNP-discrepant PDXs demonstrated distinct gene expression profiles, indicating a risk of contamination for PDXs at high passage number. The PAS also allows for the authentication of tumor cells with complex karyotypes from solid tumors including prostate cancer and Ewing's sarcoma. This study highlights the demands of authenticating PDXs for cancer research, and evaluates a reliable authentication platform that utilizes a commercially available and cost-effective system.

Keywords: OpenArray; R studio; SNP genotyping; authentication; patient derived xenografts.


Conflict of interest statement

CONFLICTS OF INTEREST

The authors declare that there are no conflicts of interest.

Figures

Figure 1
Figure 1. Examples of PDX mis-identification
PDXs established from either patient A or B are inoculated into a suitable number of mice (four mice in this example at Passage 1). Once the mice reach a defined endpoint, each mouse contributes a large number of samples to expand the biobank (each mouse contributes three samples in this example). Each sample can be serially expanded, as shown in Passage 2. Potential common mistakes involve either mis-labeling (or mismatch) of samples or contamination of one sample with another sample (shown at Passage 3). If mis-identification or contamination is not corrected early, samples can be serially expanded (Passage 4). In the case of contamination if this is not identified early on in the process, a mix of equal parts can lead to competition and a dominant sample can take over (Passage 4).
Figure 2
Figure 2. Heatmap of the SNP profile of 75 established PDXs
DNA was extracted from the earliest available sample from 73 patients (typically the patient sample), and SNP genotyped on the Taqman OpenArray 32A Barcode. This provides the reference profile for all the PDXs. All 32 SNPs are bi-allelic resulting in a Homozygous Allele 1 (red), Homozygous Allele 2 (blue), Heterozygous (green), or no amplification (white) reading. Samples are clustered according to the SNP TaqMan assay (Y-axis) to identify any matches. The 24 female samples are labeled with a black line. 2 pairs of PDXs (labeled with *, ALL-80/-81 and ALL-82/-83) match as expected because they are derived from the same patient. Any PDX can be cross-referenced to this table to identify a mismatch. The details of the SNP genotype for all PDXs are provided in Supplementary Table S1.
Figure 3
Figure 3. Allelic discrimination plot analysis allows for the detection of contaminated samples
Samples of ALL-10 and ALL-19 (A and B) or ALL-46 and ALL-35 (C and D) were mixed at ratios of 1:1 (2), 1:3 (4), 1:7 (8), 1:15 (16), and 1:31 (32) and SNP genotyped. Two representative SNPs are shown. Homozygous Allele 1 amplifies on the X axis (red), Homozygous Allele 2 amplifies on the Y axis (blue), and Heterozygous samples amplify such that X = Y (green). Each line represents the real-time amplification analysis for an individual sample. All samples are run in duplicate. A. Mixed ratios of ALL-10 (blue) and ALL-19 (red) with the known mixtures labeled and shown in black. ALL-19 is the major component. B. Mixed ratios of ALL-10 (red) and ALL-19 (green) with the known mixtures labeled in black. C. Mixed ratios of ALL-46 (blue) and ALL-35 (red) with the known mixtures in black. D. Mixed ratios of ALL-46 (green) and ALL-35 (blue) with known mixtures shown in black. (E and F.) Allelic discrimination plots of a contaminated PDX sample. Sample from Passage 2 of PDX ETP-4 (ETP-4 P2, black, two samples run in duplicate) shows signs of mixture, and the same sample serially expanded into another mouse yielded the profile in ETP-4 P3 (black) at Passage 3. E. includes a panel of PDXs from several different patients; F. shows ETP-4 (blue) and ETP-5 (green) only.
Figure 4
Figure 4. Identification of contaminated PDXs from a panel of ALL-19 PDXs derived from 74 individual mice
A. Clustering of the 74 ALL-19 PDXs and 1 patient sample with the Reference SNP profiles. The ALL-19 PDXs are separated into 4 groups, including Groups 1, 2, 3 and a validated group. In the heatmap, red refers to Homozygous Allele 1, blue refers to Homozygous Allele 2, green refers to Heterozygous, and white refers to no amplification or undetermined PCR. B. Hierarchical clustering of only the ALL-19 PDXs based on SNP genotypes. C. Allelic discrimination plots of 3 representative SNP probes in Group 2 (8 PDXs at passage 5) and Group 3 (3 PDXs at passage 5). The details of the SNP profiles of the patient sample and ALL-19 PDXs engrafted in 74 mice are provided in Supplementary Table S2.
Figure 5
Figure 5. Gene expression analysis and cytotoxicity assays on the SNP-discrepant ALL-19 PDXs
A. Correlation analysis on ALL-19 PDXs, including 2 validated (P5-17 and P5-35) and 1 contaminated (P5-18) sample. “-24h” refers to PDXs incubated in QBSF 60/F in vitro for 24 h. The color legend represents the correlation coefficient R value calculated based on the gene expression profiles from microarray study. B. Heatmap of GEPs generated by Sparse Hierarchical clustering. The details of the genes in the heatmap are provided in Supplementary Table S3. C. The 3 PDXs (1 contaminated and 2 validated) were treated with increasing concentrations of Cisplatin, and viability was assessed by Alamar Blue assay after 48 h incubation. D. Time course study of Dexamethasone cytotoxicity on the 3 PDXs (1 contaminated and 2 validated) and viability assessed by 7-AAD exclusion using flow cytometry. Values are expressed as a percentage of the untreated control. Data represent Mean + SEM for N = 3 experiments.
Figure 6
Figure 6. Tracking chimerism in a cancer patient post-transplant
DNA from one patient with ALL was SNP genotyped at remission (PRE, black) and seven months following a double cord blood transplant (cord blood derived from two donors, POST, black). A-D. Four representative SNPs are shown, and 96 samples were run on this chip. Samples cluster according to their respective genotypes, and the pre-transplant sample PRE clusters as expected. However, the post-transplant sample POST is an outlier in all 4 SNPs, and does not cluster with the remaining samples, confirming the presence of DNA not derived from the original patient.
Figure 7
Figure 7. Allelic imbalances detected in patients with complex karyotypes
ALL-17 was previously determined to have a heterozygous deletion on chromosome 9 and multiple amplifications on chromosome 6 [28]. A. Allelic discrimination plots of a SNP (C___1801627_10) at the heterozygous deletion region on chromosome 9. B and C. Allelic discrimination plots of two SNPs (C___7421900_10 and C__27402849_10) at the multiple-amplification region on chromosome 6. D and E. Two SNPs (C__29619553_10 and C___1902433_10) located at the normal genomic regions on chromosome 6 and 12 serve as controls. The left-side plots include a panel of PDXs from several different patients; the right-side plots show ALL-17 only. Black curves, ALL-17 samples; red curves, pure homozygous allele 1 amplifications; blue curves, pure homozygous allele 2 amplifications; green curves, amplifications of heterozygous alleles.
Figure 8
Figure 8. Authentication of solid tumor PDXs using PAS
Prostate cancer PDXs from three patients (X167, X224 and X305; groups 1, 2, and 5 with red frames), and Ewing's sarcoma PDXs from two patients (RA001 and RA019; groups 3 and 4 with green frames), were SNP barcoded and clustered with the Reference SNP profiles. See Table 4 for details of the PDXs. In the heatmap, red refers to Homozygous Allele 1, blue refers to Homozygous Allele 2, green refers to Heterozygous, and white refers to no amplification or undetermined PCR. Four pairs of ALL PDXs (labeled with *, ALL-80/-81, ALL-82/-83, ALL-32/-90, ALL-65/-220) match as expected because they were derived from the same patients in independent experiments.

Similar articles

Cited by

References

    1. Hidalgo M, Amant F, Biankin AV, Budinska E, Byrne AT, Caldas C, Clarke RB, de Jong S, Jonkers J, Maelandsmo GM, Roman-Roman S, Seoane J, Trusolino L, et al. Patient-derived xenograft models: an emerging platform for translational cancer research. Cancer Discov. 2014;4:998–1013. - PMC - PubMed
    1. Samuels AL, Beesley AH, Yadav BD, Papa RA, Sutton R, Anderson D, Marshall GM, Cole CH, Kees UR, Lock RB. A pre-clinical model of resistance to induction therapy in pediatric acute lymphoblastic leukemia. Blood Cancer J. 2014;4:e232. - PMC - PubMed
    1. Saland E, Boutzen H, Castellano R, Pouyet L, Griessinger E, Larrue C, de Toni F, Scotland S, David M, Danet-Desnoyers G, Vergez F, Barreira Y, Collette Y, et al. A robust and rapid xenograft model to assess efficacy of chemotherapeutic agents for human acute myeloid leukemia. Blood Cancer J. 2015;5:e297. - PMC - PubMed
    1. Gould SE, Junttila MR, de Sauvage FJ. Translational value of mouse models in oncology drug development. Nat Med. 2015;21:431–439. - PubMed
    1. Estey E, Levine RL, Lowenberg B. Current challenges in clinical development of “targeted therapies”: the case of acute myeloid leukemia. Blood. 2015;125:2461–2466. - PubMed