. 2016 Aug 30;7(35):57254-57267.
doi: 10.18632/oncotarget.11138.

miR-31 targets ARID1A and enhances the oncogenicity and stemness of head and neck squamous cell carcinoma

Affiliations

miR-31 targets ARID1A and enhances the oncogenicity and stemness of head and neck squamous cell carcinoma

Wen-Cheng Lu et al. Oncotarget. .

Abstract

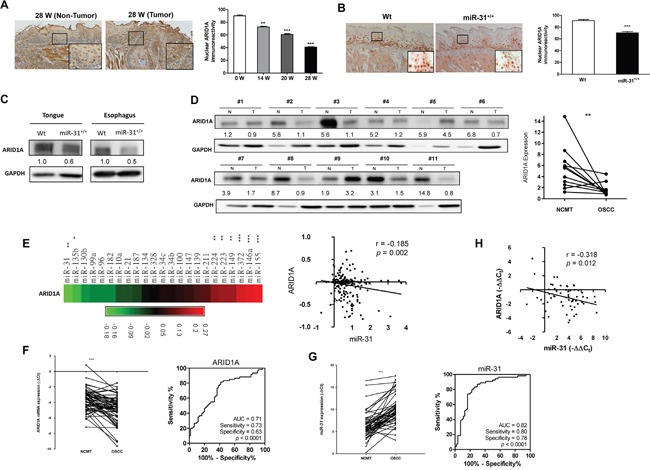
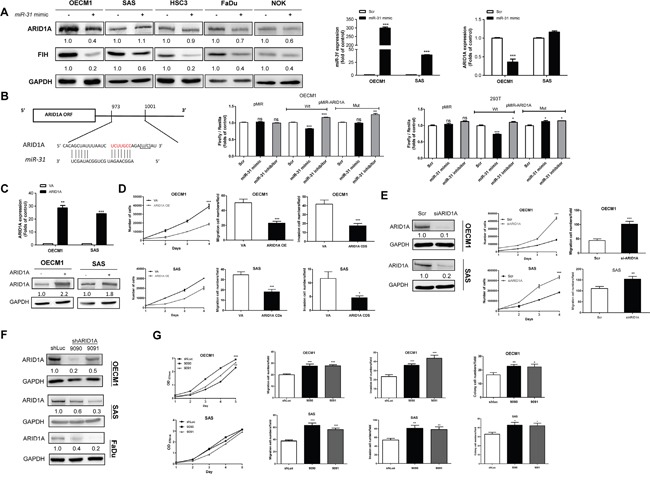
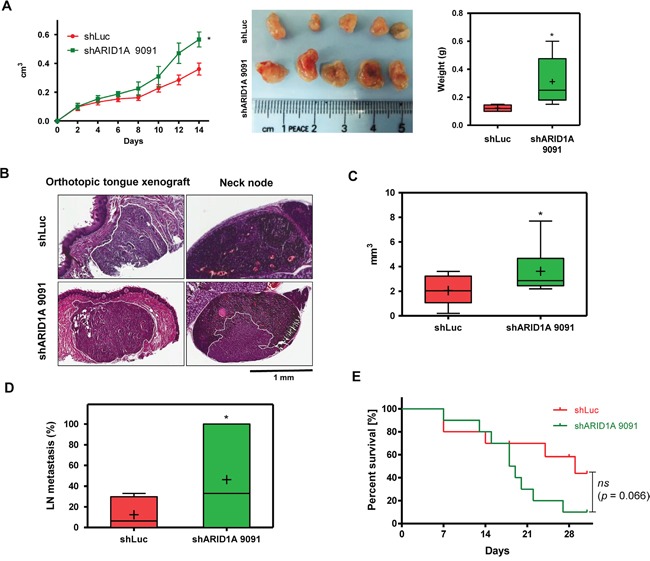
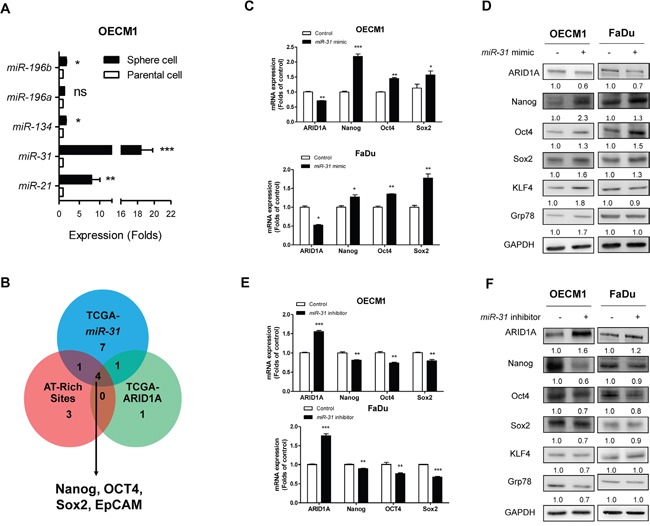
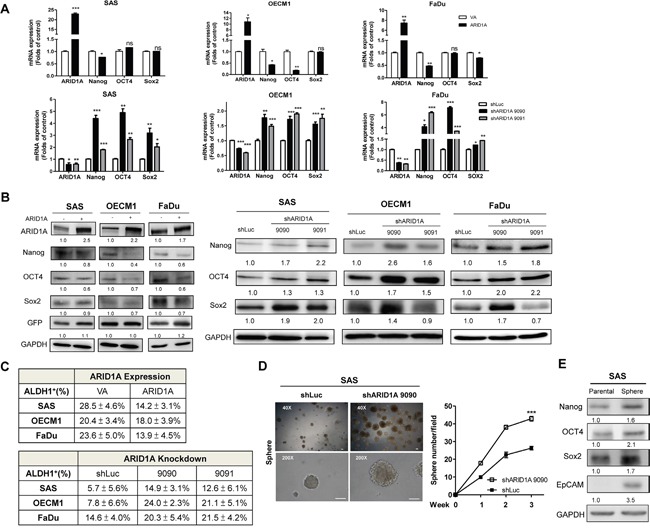
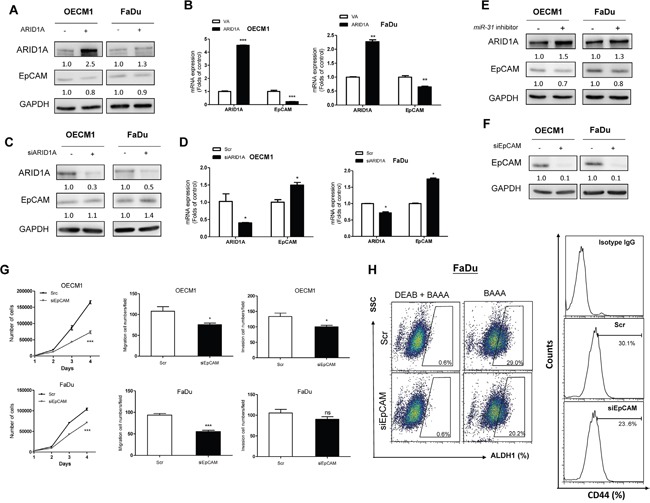
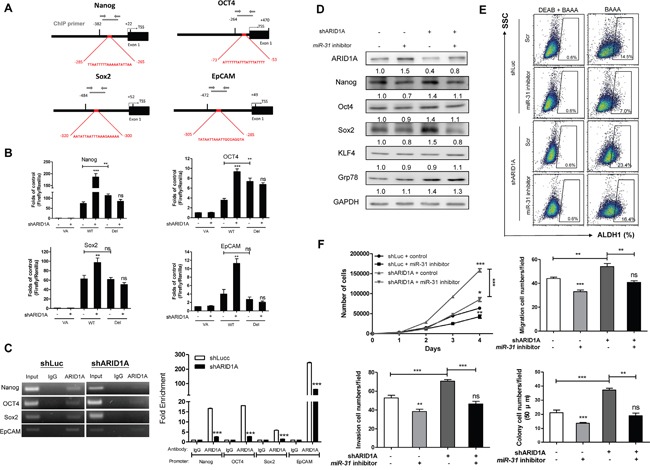
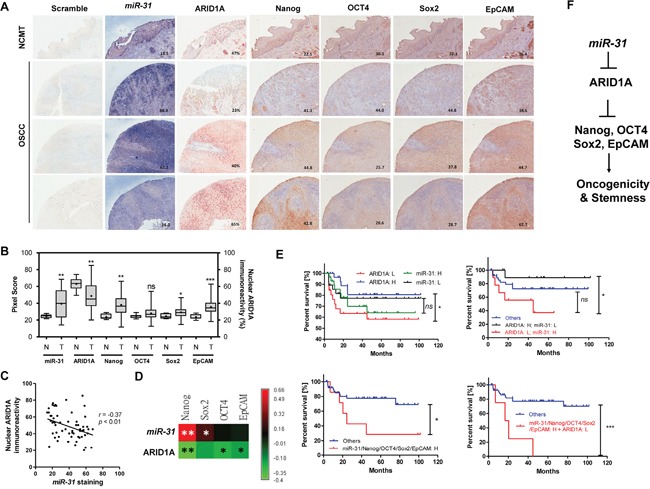
miR-31 is oncogenic for head and neck squamous cell carcinoma (HNSCC). Proteins containing the AT-rich interacting domain (ARID) modulate the accessibility of chromatin to the transcription machinery needed for gene expression. In this study, we showed that miR-31 was able to target ARID1A in HNSCC. HNSCC tumors had an inverse miR-31 and ARID1A expression. miR-31 associated oncogenicities were rescued by ARID1A expression in HNSCC cells. Furthermore, ARID1A repressed the stemness properties and transcriptional activity of Nanog/OCT4/Sox2/EpCAM via the protein's affinity for AT-rich sites within promoters. HNSCC patients with tumors having high level of miR-31 expression and high levels of Nanog/OCT4/Sox2/EpCAM expression, together with low level of ARID1A expression, were found to have the worst survival. This study provides novel mechanistic clues demonstrating that miR-31 inhibits ARID1A and that this enriches the oncogenicity and stemness of HNSCC.

Keywords: ARID1A; cancer; miR-31; stem cell; suppressor.


Conflict of interest statement

The authors declare no conflicts of interest.

Figures

Figure 1
Figure 1. Decreased ARID1A expression in HNSCC
A. Lt, Representative ARID1A immunohistochemical analysis of the non-tumor (Lt) epithelium and tumor samples (Rt) from the tongues in mice following 4NQO induction for 28 weeks. (x100); Indents, higher power views of blocks (x400). Rt, The quantification shows a progressive downregulation of nuclear ARID1A immunoreactivity in the tongue epithelium during 4NQO-induced mouse tongue carcinogenesis. B. Lt, Representative ARID1A immunohistochemistry of the tongue epithelium of Wt (Lt) and miR-31+/+ transgenic mice. (x100); Indents, higher power view of the blocks. (x400). Rt, Quantification of nuclear ARID1A immunoreactivity. Downregulation of nuclear ARID1A expression in the tongue epithelium of miR-31+/+ transgenic mice can be seen. C. Western blot analysis of the tongue and esophageal epithelium stripped from mice. This shows the downregulation of ARID1A in both the tongue and esophageal epithelium of miR-31+/+ transgenic mice relative to Wt mice. D. Lt, Western blot analysis of ARID1A protein expression in 11 human HNSCC tissue pairs. N, NCMT; T, HNSCC. Rt, Quantitation. Numbers below the Western blot pictures are the normalized values. E. Linear regression analysis to correlate ARID1A expression and the expression of oncogenic miRNAs using HNSCC TCGA database. Lt, Algorithm of r values. Rt, An inverse correlation is noted between miR-31 and ARID1A. F. Lt, qRT-PCR analysis of ARID1A mRNA expression in 58 HNSCC/NCMT tissue pairs. Rt, ROC analysis. AUC: area under curve. G. Lt, qRT-PCR analysis of miR-31 expression in tissue pairs. Rt, ROC analysis. H. Linear regression analysis shows an inverse correlation between miR-31 expression and ARID1A mRNA expression in the tissue pairs.
Figure 2
Figure 2. miR-31 inhibits ARID1A in HNSCC
A. Lt, Ectopic miR-31 expression downregulates ARID1A expression in the OECM1, HSC3, FaDu and NOK cell lines, but not in the SAS cell line. Middle and Rt, qRT-PCR analysis targeting miR-31 and ARID1A mRNA expression, respectively, in OECM1 and SAS cell. B. Lt, Similarity between miR-31 and the 3′UTR sequence of the ARID1A. Rt, Reporter assays. Lt, Assays of Wt and Mut reporters after treatment with miR-31 mimic or miR-31 inhibitor in OECM1 and 293T cells. C. Ectopic ARID1A expression in OECM1 and SAS cells. Upper, mRNA expression; Lower, protein expression. D. Phenotypic analysis of the OECM1 (Upper) and SAS (Lower) cells. Lt, proliferation; Middle, migration; Rt, invasion. E. Knockdown of ARID1A protein expression in OECM1 and SAS cells using the siARID1A oligonucleotide. Lt, protein expression; Middle, proliferation; Rt, migration. F. Establishment of OECM1, SAS and FaDu cell subclones with ARID1A knockdown. G. Phenotypic analysis of the OECM1 (Upper) and SAS (Lower) cell subclones. Lt to Rt, proliferation, migration, invasion and AIG. Numbers below the Western blot pictures are the normalized values.
Figure 3
Figure 3. Knockdown of ARID1A expression increases xenografic tumorigenesis and neck metastasis
A. Subcutaneous xenografic tumorigenesis of SAS cell subclones (n = 5). Lt, Growth curve; Middle, tumors harvested; Rt, weight of tumors. B-E. Orthotopic xenografic tumorigenesis of SAS cell subclones (n = 10). (B) H&E-stained tissue sections. Lt, tongue tissues, Rt neck nodes. The primary tumors in tongue and metastatic lesion in neck node are marked with white solid lines. (C) Volume of primary tumors. (D) Percentage of neck metastasis in tumors < 6 mm3 in size. (E) Survival curve of mice. Bar charts, Box and Whiskers plot. Line, medium value; +, mean value.
Figure 4
Figure 4. miR-31 downregulates ARID1A and upregulates pluripotency genes
A. qRT-PCR analysis of miR-21, miR-31, miR-134, miR-196a and miR-196b in OECM1 parental cells and OECM1 sphere cells. A significant increase in miR-31 expression which is much greater than other miRNAs, is found in the sphere cells. B. Bioinformatics analysis indicates that expression levels of Nanog, OCT4, Sox2 and EpCAM genes are positively correlated with the level of miR-31 expression, but are negatively correlated with the level of ARID1A expression; this is identified using the HNSCC-TCGA database. These genes contain predicted AT-rich sites in their promoters. C, D. Treatment of OECM1 and FaDu cells with miR-31 mimic. This downregulates ARID1A protein expression and upregulates Nanog/OCT4/Sox2 protein expression (in C). The treatment also downregulates ARID1A mRNA expression and upregulates Nanog/OCT4/Sox2 mRNA expression (in D) in both OECM1 and FaDu cells. E, F. Treatment with miR-31 inhibitor. This upregulates ARID1A and downregulates Nanog/OCT4/Sox2 in protein expression (in E) and mRNA expression (in F) in both OECM1 and FaDu cells. It should be noted that the protein expression levels of KLF4 and Grp78 are upregulated by miR-31 mimic and downregulated by miR-31 inhibitor in OECM1 cells. Numbers below Western blot pictures are the normalized values.
Figure 5
Figure 5. ARID1A downregulates pluripotency genes and stemness
A. qRT-PCR analysis and B. Western blot analysis of ARID1A, Nanog, OCT4 and Sox2 expression in the SAS, OECM1 and FaDu cell subclones with ARID1A overexpression (A, Upper; B, Lt) and knockdown (A, Lower; B, Rt). C. Summary of ALDH1+ cell population of ARID1A overexpression or knockdown in HNSCC cells. D. Spheroid formation assay by SAS cells. Lt, Images at the 3rd week; Rt, Quantification of spheres greater than 100 μm in size at week 1-3. Bars, 100 μm. The shARID1A 9090 SAS cell subclone shows a higher capability for sphere formation relative to the control. E. Western blot analysis. This shows that there is upregulation of Nanog/OCT4/Sox2/EpCAM in spheres derived from SAS cells compared to parental SAS cell. Numbers below the Western blot pictures are the normalized values.
Figure 6
Figure 6. ARID1A-EpCAM is involved in oncogenicity and stemness of HNSCC cells
A-G. OECM1 and FaDu cells. (A, B) Ectopic ARID1A expression, (C, D) Knockdown of ARID1A expression. (A, C) Western blot analysis. (B, D) qRT-PCR analysis. An inverse relationship between the expression level of ARID1A and EpCAM should be noted. (E) Ectopic miR-31 expression. This results in ARID1A upregulation and EpCAM downregulation. (F) Treatment with siEpCAM oligonucleotide. This downregulates EpCAM protein expression. (G) Upper, OECM1 cell; Lower, FaDu cell. Analysis of proliferation (Lt), migration (Middle) and invasion (Rt). H. FaDu cell. Knockdown of EpCAM decreases the ALDH1+ (Lt) and CD44+ (Rt) cell populations. The numbers below the Western blot pictures are the normalized values.
Figure 7
Figure 7. miR-31 inhibits ARID1A to transactivate pluripotency genes and oncogenicity
A. Schematic diagrams designate AT-rich sites (Red boxes) in the proximal regions of the Nanog, OCT4, Sox2 and EpCAM promoters. TSS, transcription start site; Thin black bars, the termini of AT-rich sites. Thick black bars define the segments for reporter assay in B. Grey lines define the segments for ChIP assay in C. (B) Promoter activity. Knockdown of ARID1A increases the activity of the WT promoter reporters of each gene, while it does not alter the activity of the Del promoter reporters. Deletion of the AT-rich sites increases the promoter reporter activity of Nanog and OCT4, but it does not alter the promoter reporter activity of Sox2 and EpCAM. (C) Lt, ChIP assays of ARID1A in Nanog/OCT4/Sox2/EpCAM promoter regions. Knockdown of ARID1A reduces the PCR products amplified from the DNA fragments that had been immunoprecipitated by anti-ARID1A antibody. Rt, ChIP qPCR analysis. Input, 2% of total lysate. D-F. Rescue of oncogenicity and stemness in the OECM1 shARID1A 9091 cell subclone and control. (D) Upregulation of Nanog, OCT4 and Sox2, induced by ARID1A knockdown, is reversed by miR-31 inhibition. This does not occur with KLF4 or Grp78. (E) An increase in the ALDH1+ cell population induced by ARID1A knockdown is also reversed by miR-31 inhibition. (F) The proliferation (Upper Lt), migration (Upper Rt), invasion (Lower Lt) and AIG (Lower Rt) are induced by ARID1A knockdown and this is rescued by miR-31 inhibition. Numbers below the Western blot pictures are the normalized values.
Figure 8
Figure 8. ISH and IHC analysis using HNSCC TMA tissue samples
A. NCMT (Upper most) and 3 representative HNSCC TMA tissue cores. (x100). B. Quantification of miR-31, nuclear ARID1A, Nanog, OCT4, Sox2 and EpCAM immunoreactivities in NCMT and HNSCC tissue cores. C. An inverse correlation can be seen between miR-31 staining and nuclear ARID1A immunoreactivity. D. The algorithm of r values demonstrates a positive correlation between miR-31 staining and the expression of stemness factors together with an inverse correlation between ARID1A expression and the expression of stemness factors. E. Kaplan-Meier survival analysis used to assess the disease free survival of HNSCC patients. H, high expression; L, low expression. F. Illustration of miR-31-ARID1A-Nanog/OCT4/Sox2/EpCAM axis.

Similar articles

Cited by

References

    1. Bourguignon LY, Earle C, Wong G, Spevak CC, Krueger K. Stem cell marker (Nanog) and Stat-3 signaling promote MicroRNA-21 expression and chemoresistance in hyaluronan/CD44-activated head and neck squamous cell carcinoma cells. Oncogene. 2012;31:149–160. - PMC - PubMed
    1. Hung PS, Tu HF, Kao SY, Yang CC, Liu CJ, Huang TY, Chang KW, Lin SC. miR-31 is upregulated in oral premalignant epithelium and contributes to the immortalization of normal oral keratinocytes. Carcinogenesis. 2014;35:1162–1171. - PubMed
    1. Jones A. The molecular cell biology of head and neck cancer with clinical applications. Section 1: Fundamental biology and the basis of cancer. Clin Otolaryngol Allied Sci. 2004;29:475–491. - PubMed
    1. Liu CJ, Tsai MM, Hung PS, Kao SY, Liu TY, Wu KJ, Chiou SH, Lin SC, Chang KW. miR-31 ablates expression of the HIF regulatory factor FIH to activate the HIF pathway in head and neck carcinoma. Cancer Res. 2010;70:1635–1644. - PubMed
    1. Lu WC, Kao SY, Yang CC, Tu HF, Wu CH, Chang KW, Lin SC. EGF up-regulates miR-31 through the C/EBPbeta signal cascade in oral carcinoma. PLoS One. 2014;9:e108049. - PMC - PubMed

MeSH terms