. 2016 Aug 16:6:31690.
doi: 10.1038/srep31690.

Epigenetic silencing of the NR4A3 tumor suppressor, by aberrant JAK/STAT signaling, predicts prognosis in gastric cancer

Affiliations

Epigenetic silencing of the NR4A3 tumor suppressor, by aberrant JAK/STAT signaling, predicts prognosis in gastric cancer

Chung-Min Yeh et al. Sci Rep. .

Abstract

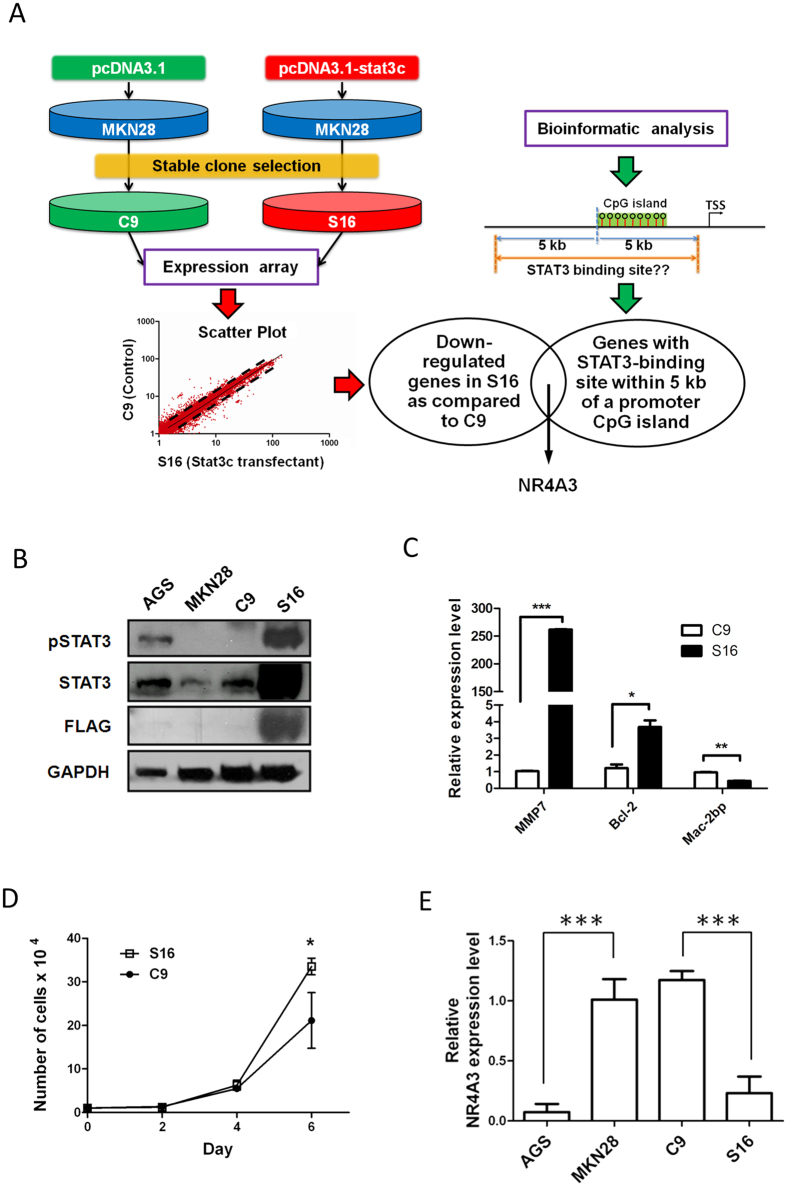
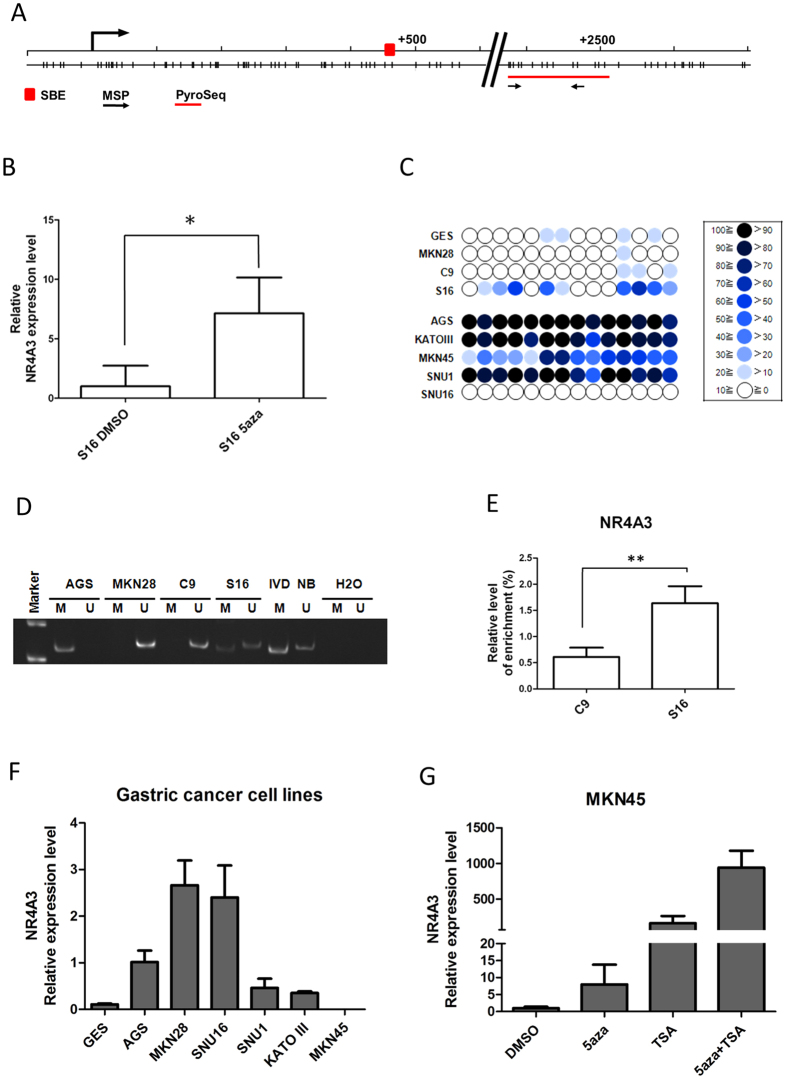
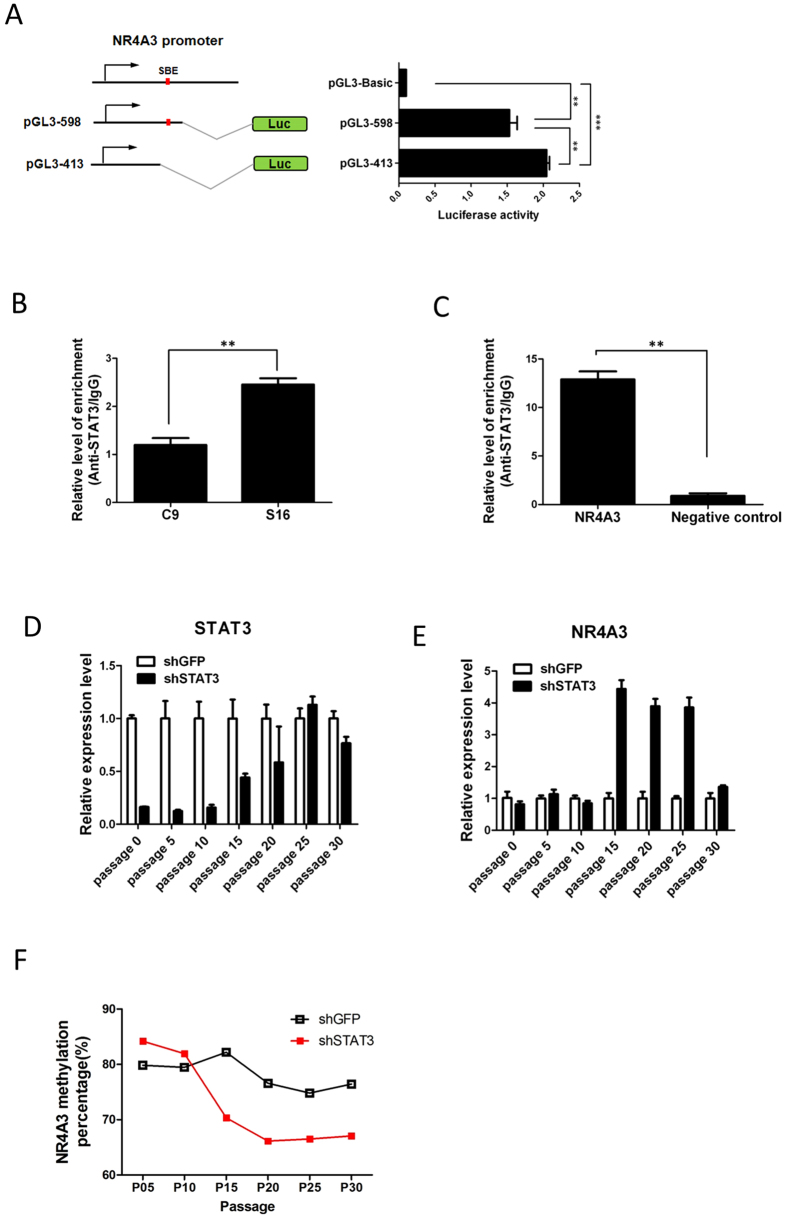
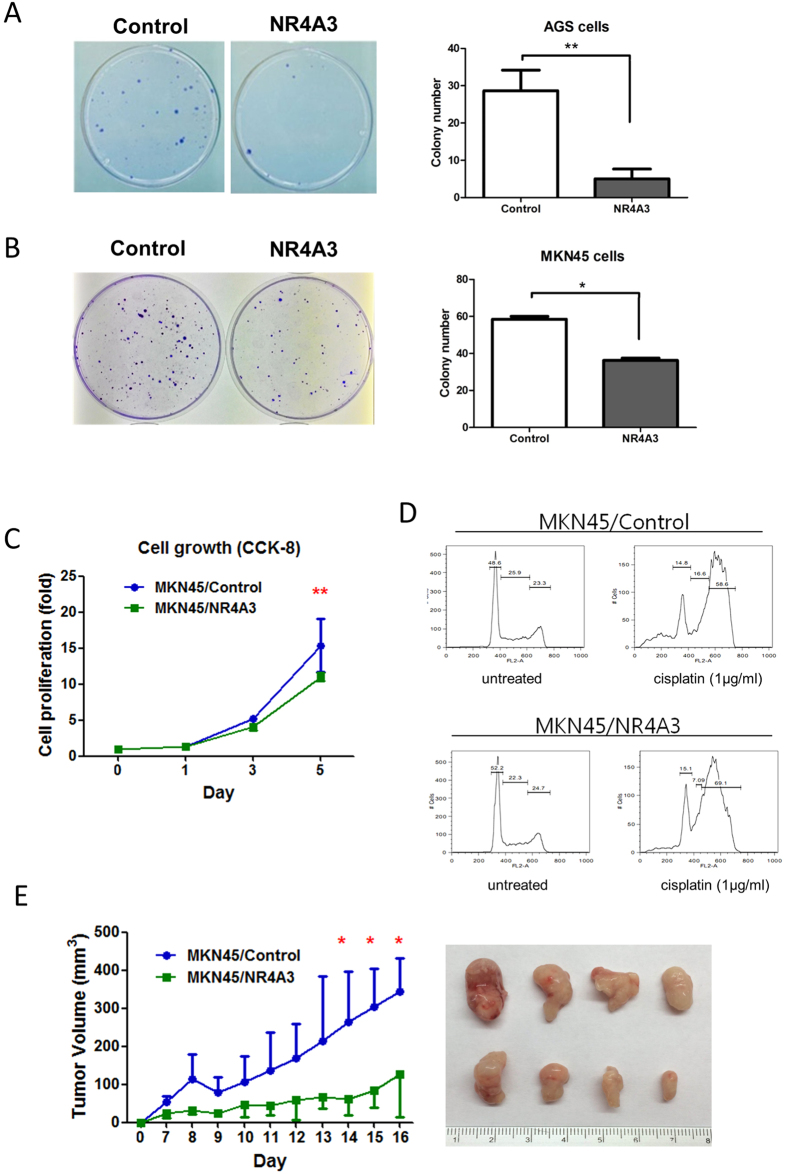
While aberrant JAK/STAT signaling is crucial to the development of gastric cancer (GC), its effects on epigenetic alterations of its transcriptional targets remains unclear. In this study, by expression microarrays coupled with bioinformatic analyses, we identified a putative STAT3 target gene, NR4A3 that was downregulated in MKN28 GC daughter cells overexpressing a constitutively activated STAT3 mutant (S16), as compared to an empty vector control (C9). Bisulphite pyrosequencing and demethylation treatment showed that NR4A3 was epigenetically silenced by promoter DNA methylation in S16 and other GC cell lines including AGS cells, showing constitutive activation of STAT3. Subsequent experiments revealed that NR4A3 promoter binding by STAT3 might repress its transcription. Long-term depletion of STAT3 derepressed NR4A3 expression, by promoter demethylation, in AGS GC cells. NR4A3 re-expression in GC cell lines sensitized the cells to cisplatin, and inhibited tumor growth in vitro and in vivo, in an animal model. Clinically, GC patients with high NR4A3 methylation, or lower NR4A3 protein expression, had significantly shorter overall survival. Intriguingly, STAT3 activation significantly associated only with NR4A3 methylation in low-stage patient samples. Taken together, aberrant JAK/STAT3 signaling epigenetically silences a potential tumor suppressor, NR4A3, in gastric cancer, plausibly representing a reliable biomarker for gastric cancer prognosis.


Figures

Figure 1
Figure 1. Integrated expression microarray and bioinformatic analyses identifies NR4A3 as an epigenetically silenced target of STAT3 in gastric cancer.
(A) Schematic diagram showing the experimental scheme of this study. Empty vector (pcDNA 3.1) or vector expressing a constitutively activated mouse Stat3 mutant (pcDNA3.1-stat3c) were transfected into MKN28 gastric cancer (GC) cells. Stable transfectants were selected from cells expressing the empty vector control (C9) or the Stat3 mutant (S16). Total RNA from C9 and S16 cells was then extracted for expression microarray analysis using an Agilent Human Whole Genome 44 K Expression Microarray, with data presented as a scatter plot. Each dot of the scatter plot represents the fluorescence signal (i.e., the mRNA expression level) of each gene on the array in C9 vs. S16 cells. Genes outside of the black dotted lines denote expression changes of ≥1.5-fold. In addition, bioinformatic analysis was performed to identify potential STAT3 targets by filtering genes with at least one STAT3-binding site within 5 kb of the promoter CpG island, revealing 526 putative STAT3 target genes. One such downregulated STAT3 target in S16 cells, NR4A3, was selected for further analysis. (B) Western blot was performed to investigate the activation status of STAT3 in C9, S16, and the parental MKN28 GC cells. AGS GC cells showing constitutive STAT3 activation were used as a positive control. Stat3c stable transfectants (S16) were confirmed by hybridization of an anti-FLAG antibody. (C) STAT3 activation in S16 cells was confirmed by the expression of STAT3 targets MMP7, Bcl-2 and Mac-2bp, using qRT-PCR (***P < 0.001; **P < 0.01; *P < 0.05). Both S16 and AGS cells showed MMP7 upregulation, compared to C9 control and MKN28 GC cells. (D) STAT3C overexpression slightly increased cell growth in MKN28 cells. S16 and C9 cell numbers were measured by a haemocytometer at each designated day, revealing increased proliferation of S16 cells at day 6 of the experiment, as compared to C9 cells (*P < 0.05). (E) Expression levels of the STAT3 target, NR4A3, were examined in GC cancer cell lines and transfectants and compared to those of MKN28 cells, set to 1.0 as a positive control (***P < 0.0001). Each bar represents mean± SD of duplicate experiments.
Figure 2
Figure 2. NR4A3 is repressed by promoter DNA methylation in S16 and other gastric cancer cells.
(A) Schematic diagram showing the genomic map of the NR4A3 promoter, with corresponding locations of CpG sites and a putative STAT3-binding element (SBE, red box). CpG sites interrogated by bisulphite prosequencing (PyroSeq) and MSP are indicated by the red line and black arrows, respectively. (B) NR4A3 expression in S16 cells, following DNA demethylation treatment with 0.5 μM 5-aza-2′-deoxycytidine (5-aza) or DMSO control, was examined by qRT-PCR. As depicted, 5-aza treatment significantly restored NR4A3 expression (*P < 0.05). (C) Bisulphite pyrosequencing was performed to quantitatively examine the methylation levels of 14 CpG sites within the NR4A3 promoter CpG island in C9, S16, and other gastric cancer (GC) cell lines. The percent methylation of each CpG site (circle) is indicated by the intensity of the blue color. NR4A3 promoter methylation was also examined by (D) methylation-specific PCR (MSP) and (E) methyl-binding protein DNA capture (MBDcap) coupled to PCR. For MSP, bisulphite-modified DNA was PCR-amplified using specific primers. “M” and “U” indicate the presence of methylated and unmethylated alleles, respectively. IVD (in vitro methylated DNA) was a positive control for methylation and NB (normal blood) was a negative control for methylation. Water (H2O) was used as a negative control for PCR. In MBDcap-PCR, methylated DNA fragments were immunoprecipitated by MBD protein followed by qPCR (**P < 0.001). (F) Relative expression of NR4A3 in GC lines and (G) 5-aza-treated MKN45 GC cells, as determined by qRT-PCR. Each bar represents mean± SD of dupliate experiments.
Figure 3
Figure 3. Binding of STAT3 represses NR4A3 expression by promoter methylation in AGS GC cells.
(A) NR4A3 promoter regions with (598-bp fragment) or without (413-bp fragment) a putative STAT3 binding site were cloned into pGL3 luciferase-expressing vectors and transfected into AGS GC cells. 24 hours after transfection, luciferase reporter activities were determined. The promoter fragment lacking a STAT3-binding site (pGL3-413) showed significantly (**P < 0.001; ***P < 0.0001) higher luciferase activity than that with a STAT3-binding site (pGL3-598). (B) ChIP-PCR showing that STAT3 binding was significantly enriched in the NR4A3 promoter of S16 cells, as compared to C9 cells. (C) As compared to an unrelated control (GAPDH promoter), STAT3 binding was significantly enriched in the NR4A3 promoter in AGS cells. Expression of (D) STAT3 and (E) NR4A3, in AGS cells, following long-term depletion of STAT3 by lentiviral shRNA knockdown, at each indicated cell passage number. (F) NR4A3 promoter methylation, at each indicated passage number, following long-term STAT3 depletion, as determined by bisulphite pyrosequencing. shGFP, negative control.
Figure 4
Figure 4. Ectopic expression of NR4A3 inhibits tumor growth in vitro and in vivo in a xenograft mouse model.
Ectopic expression of NR4A3 inhibited tumor growth, as determined by colony formation assay. AGS or MKN45 GC cells transfected with empty or NR4A3 expression vector were selected for further experiments (Supplementary Figure S1). (A) AGS or (B) MKN45 GC cells overexpressing NR4A3 had significantly fewer colonies than the control. Right panel, quantitative analysis of the colony formation assay. (C) Cell growth of MKN45 GC cells, with or without NR4A3 expression, was determined by cell counting. Ectopic expression of NR4A3 significantly inhibited cell growth in MKN45 GC cells. (D) Flow cytometry analysis of MKN45 GC cells with or without cisplatin (1 μg/ml) for 24 hr. DNA fluorescence histogram shows that NR4A3 overexpression enhanced G2/M arrest in cisplatin-treated cells (please also refer to Supplementary Figure S4). (E) Effect of NR4A3 overexpression on in vivo tumor growth in a nude mouse model. MKN45 cells stably transfected with NR4A3 or empty vector (control) were injected subcutaneously into both flanks of athymic nude mice. Tumor volumes were measured daily. Representative examples of tumors formed in nude mice are also shown (right panel). **P < 0.01; *P < 0.05.
Figure 5
Figure 5. NR4A3 promoter hypermethylation and increased STAT3 activity correlate with poor survival in gastric cancer patients.
Quantitative real time MSP (qMSP) was performed to determine NR4A3 methylation levels in gastritis (n = 9) and primary gastric cancer (GC) patient samples (n = 88). NR4A3 methylation was significantly higher in (A) GC tumor samples and matched adjacent normal tissues, as compared to gastritis. NR4A3 methylation in tumor samples also showed a progressive increase with (B) stage and (C) grade. (D) Kaplan-Meier analysis of NR4A3 methylation in tumor tissues for overall survival of gastric cancer patients. GC patients with higher NR4A3 methylation demonstrated shorter overall survival than patients with lower methylation (log-rank test, **P = 0.003). (E) Kaplan-Meier analysis also showed that patients with higher STAT3 nuclear staining (“STAT3 IHC high,” red line, vs. “STAT3 IHC low, black line) had significantly (P = 0.0382) shorter overall survival than patients with lower STAT3 nuclear staining (representative STAT3 IHC images shown in right panel). (F) NR4A3 IHC, as performed on another independent cohort of 128 GC patient tumors, using tissue microarrays. Similar to high STAT3 IHC, Kaplan-Meier analysis also showed that patients with lower NR4A3 staining (“NR4A3 IHC low,” red line, vs. “NR4AC IHC low,” black lines) had shorter (P = 0.0272) overall survival than those with higher NR4A3 staining. Representative NR4A3 IHC images are shown in the right panel.

References

    1. Torre L. A. et al.. Global cancer statistics, 2012. CA Cancer J Clin 65, 87–108 (2015). - PubMed
    1. Lauren P. The Two Histological Main Types of Gastric Carcinoma: Diffuse and So-Called Intestinal-Type Carcinoma. An Attempt at a Histo-Clinical Classification. Acta Pathol Microbiol Scand 64, 31–49 (1965). - PubMed
    1. Camargo M. C. et al.. Improved survival of gastric cancer with tumour Epstein-Barr virus positivity: an international pooled analysis. Gut 63, 236–243 (2014). - PMC - PubMed
    1. Polk D. B. & Peek R. M. Jr. Helicobacter pylori: gastric cancer and beyond. Nat Rev Cancer 10, 403–414 (2010). - PMC - PubMed
    1. Kuipers E. J., Perez-Perez G. I., Meuwissen S. G. & Blaser M. J. Helicobacter pylori and atrophic gastritis: importance of the cagA status. J Natl Cancer Inst 87, 1777–1780 (1995). - PubMed

Publication types