Comparative Study
. 2016 Sep 26;36(20):2626-44.
doi: 10.1128/MCB.00941-15. Print 2016 Oct 15.

Differences and Similarities in TRAIL- and Tumor Necrosis Factor-Mediated Necroptotic Signaling in Cancer Cells

Affiliations
Comparative Study

Differences and Similarities in TRAIL- and Tumor Necrosis Factor-Mediated Necroptotic Signaling in Cancer Cells

Justyna Sosna et al. Mol Cell Biol. .

Abstract

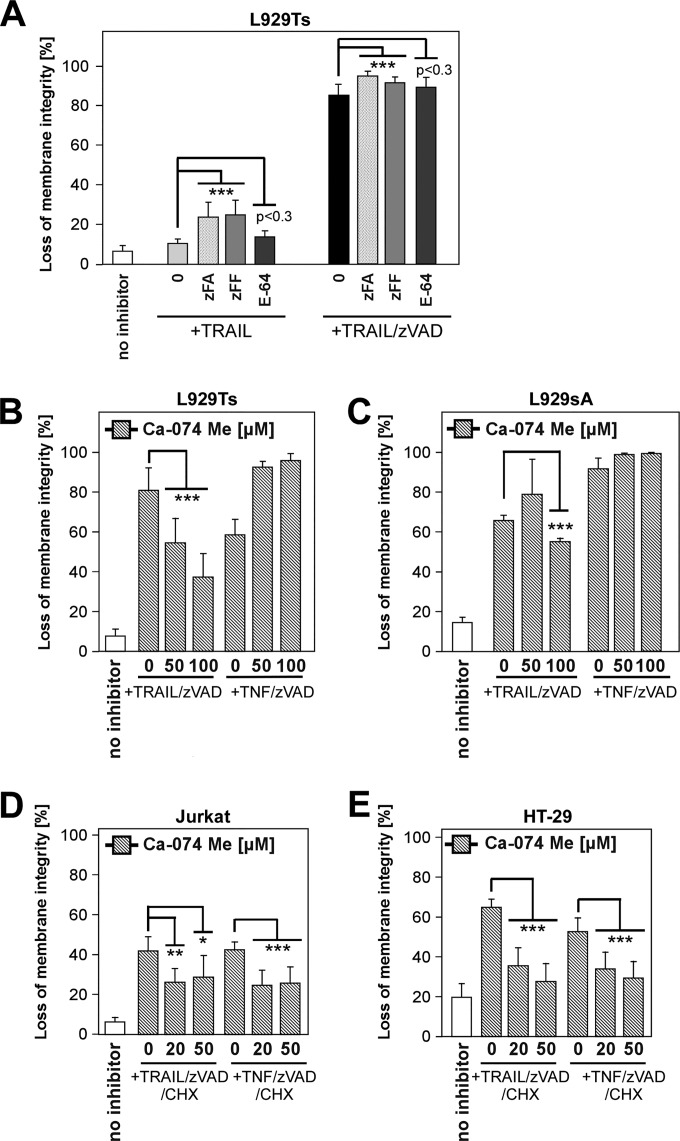
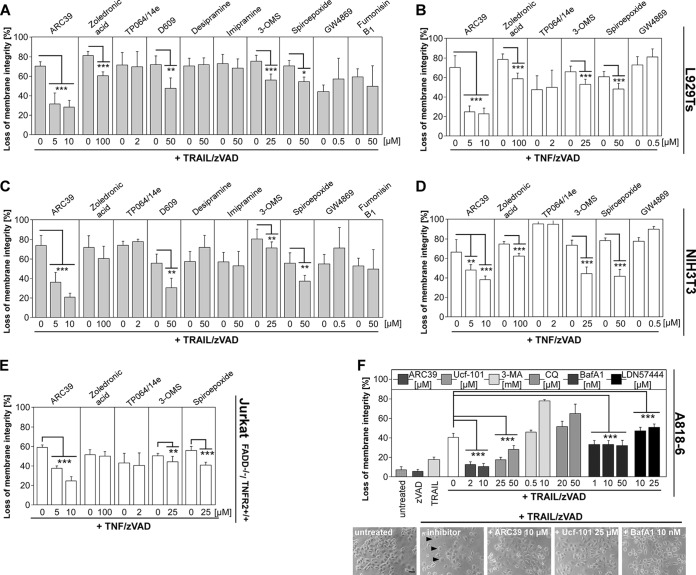
Recently, a type of regulated necrosis (RN) called necroptosis was identified to be involved in many pathophysiological processes and emerged as an alternative method to eliminate cancer cells. However, only a few studies have elucidated components of TRAIL-mediated necroptosis useful for anticancer therapy. Therefore, we have compared this type of cell death to tumor necrosis factor (TNF)-mediated necroptosis and found similar signaling through acid and neutral sphingomyelinases, the mitochondrial serine protease HtrA2/Omi, Atg5, and vacuolar H(+)-ATPase. Notably, executive mechanisms of both TRAIL- and TNF-mediated necroptosis are independent of poly(ADP-ribose) polymerase 1 (PARP-1), and depletion of p38α increases the levels of both types of cell death. Moreover, we found differences in signaling between TNF- and TRAIL-mediated necroptosis, e.g., a lack of involvement of ubiquitin carboxyl hydrolase L1 (UCH-L1) and Atg16L1 in executive mechanisms of TRAIL-mediated necroptosis. Furthermore, we discovered indications of an altered involvement of mitochondrial components, since overexpression of the mitochondrial protein Bcl-2 protected Jurkat cells from TRAIL- and TNF-mediated necroptosis, and overexpression of Bcl-XL diminished only TRAIL-induced necroptosis in Colo357 cells. Furthermore, TRAIL does not require receptor internalization and endosome-lysosome acidification to mediate necroptosis. Taken together, pathways described for TRAIL-mediated necroptosis and differences from those for TNF-mediated necroptosis might be unique targets to increase or modify necroptotic signaling and eliminate tumor cells more specifically in future anticancer approaches.


Figures

FIG 1
FIG 1
(A) TRAIL-induced necroptosis is enhanced by inhibition of caspase-8. To further characterize TRAIL-mediated necroptosis, we evaluated the necessity of caspase inhibition for the induction of this type of cell death. In the time-dependent manner, we compared the effects of the inhibition of effector caspase-3 (by zDEVD) and initiator caspase-8 (by zIETD). Only inhibition of caspase-8 (by zIETD or the pancaspase inhibitor zVAD) enhanced cell death mediated by TRAIL and strongly sensitized cells to TRAIL. Cells were left untreated or stimulated with 30 ng/ml killerTRAIL and 20 μM zDEVD, zIETD, or zVAD for 14 or 24 h. (B to D) TRAIL-induced necroptosis is mediated through RIPK1. (B) Wild-type (WT) (RIPK1+/+) and RIPK1-deficient (RIPK1−/−) Jurkat cells were left untreated or stimulated with 50 ng/ml killerTRAIL, 50 μM zVAD, and 2 μg/ml CHX for 20 h. Insets show control Western blots for endogenous RIPK1 and β-actin as a loading control. (C) Cells were left untreated or preincubated with 1 μg/ml GA or 5 μg/ml RC (L929Ts), 0.5 μg/ml GA or 5 μg/ml RC (NIH 3T3), or 1 μg/ml GA or 0.5 μg/ml RC (Jurkat) for 24 h and stimulated afterwards with 30 ng/ml killerTRAIL and 20 μM zVAD (L929Ts); 100 ng/ml killerTRAIL and 20 μM zVAD (NIH 3T3); or 50 μg/ml killerTRAIL, 50 μM zVAD, and 2 μg/ml CHX (Jurkat) for 24 h. The fraction of surviving cells is displayed relative to cells that were treated as described above, except that no TRAIL-zVAD (TRAIL-zVAD-CHX) was added. (D) Cells were pretreated for 2 h with 50 μM Nec-1s and subsequently treated with either 30 ng/ml (14 h for L929Ts cells and 16 h for HT-29 cells), 50 ng/ml (20 h for Jurkat cells), or 100 ng/ml (NIH 3T3) killerTRAIL in combination with 20 μM (L929Ts, NIH 3T3, and HT-29) or 50 μM (Jurkat) zVAD and additionally with 2 μg/ml (Jurkat) or 5 μg/ml (HT-29) CHX. Shown are means ± standard deviations (n ≥ 9), with differences being considered significant at a P value of <0.001 (***) (as determined by a t test). The morphology of untreated cells undergoing TRAIL-mediated necroptosis and TRAIL-induced necroptosis inhibited by Nec-1s is shown. Bar, 100 μm. (E) Necroptotic cell death induced by TRAIL is not accompanied by early phosphatidylserine exposition. An involvement of apoptosis in TRAIL-induced necroptosis was excluded, as phosphatidylserine, detected by using annexin V, was exposed to the outer membrane only during the late phase of cell death and was accompanied by a simultaneous loss of membrane integrity, which was measured by the uptake of 7-AAD. Cells were treated with 20 μM zVAD and 30 ng/ml (L929Ts) or 100 ng/ml (NIH 3T3) killerTRAIL or with 50 ng/ml killerTRAIL, 50 μM zVAD, and 2 μg/ml CHX (Jurkat). (F) Loss of ΔΨm is a late event during TRAIL-induced necroptosis. Cells were treated as described above for panel E. Mitochondrial membrane potential was measured after the indicated times. Shown are means ± standard deviations (n = 4 [A], n = 3 [B], n = 4 [C], n ≥ 3 [D], n = 3 [E], and n = 3 [F]), with differences being considered significant at P values of <0.05 (*), <0.01 (**), and <0.001 (***) (as determined by a t test). (G) Deficiency in FADD inhibits TRAIL-mediated necroptosis. Jurkat I.42 cells (FADD deficient and TNF-R2 positive) were pretreated or not with 50 μM zVAD and treated with 50 ng/ml killerTRAIL for 14 to 24 h (two independent experiments; n = 5). n.s., nonsignificant.
FIG 2
FIG 2
(A) TRAIL-induced apoptosis and necroptosis are enhanced by zFA and zFF. L929Ts cells were incubated with 30 ng/ml killerTRAIL (for apoptosis) or 20 μM zVAD (prestimulation for 30 min) and subsequently incubated with 30 ng/ml killerTRAIL (for necroptosis) in the absence or presence of 20 μM zFA, zFF, or E-64 for 16 h. (B to E) TRAIL-mediated necroptosis is inhibited by Ca-074 Me. L929Ts (B), L929sA (C), Jurkat (D), and HT-29 (E) cells were pretreated with Ca-074 Me for 2 h and stimulated with either 30 ng/ml (14 h for L929Ts cells and 16 h for HT-29 cells) or 50 ng/ml (20 h for Jurkat cells) killerTRAIL or 100 ng/ml (5 h for L929Ts cells, 16 h for HT-29 cells, and 20 h for Jurkat cells) hrTNF in combination with 20 μM (L929Ts and HT-29) or 50 μM (Jurkat) zVAD and additionally with 2 μg/ml (Jurkat) or 5 μg/ml (HT-29) CHX. Shown are means ± standard deviations (n = 4 [A] and n = 9 [B to E]), with differences being considered significant at P values of <0.05 (*) and <0.001 (***) (as determined by a t test). n.s., nonsignificant.
FIG 3
FIG 3
TRAIL- and TNF-induced necroptosis are mediated by ceramide that is generated by A-SMase and N-SMase. (A to D) Cells were pretreated for 2 h with the indicated concentrations of inhibitors of A-SMase (ARC39, zoledronic acid, TP064/14e, D609, desipramine, and imipramine), N-SMase (3-OMS, spiroepoxide, and GW4869), and ceramide synthase (fumonisin B1), with the subsequent addition of 30 ng/ml killerTRAIL and 20 μM zVAD for 14 h (L929Ts) (A), 100 ng/ml hrTNF in combination with 20 μM zVAD for 5 h (L929Ts) (B), 100 ng/ml killerTRAIL and 20 μM zVAD for 16 h (NIH 3T3) (C), and 100 ng/ml hrTNF and 20 μM zVAD for 16 h (NIH 3T3) (D). (E) Inhibitors of A-SMase and N-SMase protect human Jurkat I.42 cells (FADD deficient and TNF-R2 positive) from TNF-mediated necroptosis. Cells were treated with the indicated concentrations of inhibitors and stimulated afterwards with 100 ng/ml hrTNF in combination with 50 μM zVAD for 6 h. (F) Inhibitors of A-SMase, HtrA2/Omi, UCH-L1, and vacuolar H+-ATPase protect the human pancreas adenocarcinoma cell line A818-6 from TRAIL-mediated necroptosis. Cells were pretreated for 2 h (or 3 h for LDN57444) with the indicated concentrations of inhibitors with the subsequent addition of 100 ng/ml killerTRAIL in combination with 50 μM zVAD for 24 h. Morphological changes of human A818-6 pancreas adenocarcinoma cells after induction of TRAIL-mediated necroptosis in combination with inhibitors of A-SMase, HtrA2/Omi, and vacuolar H+-ATPase were observed. Cells were pretreated for 2 h with 10 μM ARC39, 25 μM Ucf-101, or 10 μM BafA1 with the subsequent addition of 100 ng/ml killerTRAIL in combination with 50 μM zVAD for 24 h. Arrowheads in micrographs show typical necroptotic morphologies. Bar, 100 μm. Shown are means ± standard deviations (n = 3 [A to D] and n = 9 [E and F]), with differences being considered significant at P values of <0.05 (*), <0.01 (**), and <0.001 (***) (as determined by a t test).
FIG 4
FIG 4
(A and B) ROS are not uniformly the executioners of TRAIL-mediated necroptosis. (A) All tested cell lines were pretreated or not with 150 μM BHA or BHT for 1 h, with the subsequent addition of 30 ng/ml (14 h for L929Ts cells), 100 ng/ml (16 h for NIH 3T3 cells), or 50 ng/ml (20 h for Jurkat cells) killerTRAIL; 20 μM zVAD (L929Ts and NIH 3T3); or 50 μM zVAD and 2 μg/ml CHX (Jurkat). Each cell line was treated with 1 mM BuOOH for 24 h as a positive control for ROS production. (B) Cells were treated as described above for panel A, and loss of membrane integrity was measured. (C) Lack of p38α increases execution of TRAIL- and TNF-mediated necroptosis. p38α-deficient immortalized MEFs and their wild-type counterparts were prestimulated for 30 min with or without 20 μM zVAD and with or without 1 μg/ml CHX with the subsequent addition of 100 ng/ml killerTRAIL or 100 ng/ml hrTNF for 24 h. (D and E) Deficiency in p38α increases phosphorylation of IκBα and phosphorylation of p65 during TRAIL- and TNF-induced cell death. Cells were stimulated as described above for panel C for 1 h, followed by total lysis and Western blot analyses. Shown are Western blots for total IκBα, phosphorylated (Ser32) IκBα (p-IκBα), total p65 (*, unspecific band), and phosphorylated (Ser536) p65 (p-p65); p38α served as a control for deficiency, and β-actin served as a loading control. (F and G) Overexpression of Bcl-XL and Bcl-2 protects cells from TRAIL-mediated necroptosis. (F) Wild-type and Bcl-2-overexpressing Jurkat cells were stimulated with 50 ng/ml killerTRAIL or 100 ng/ml hrTNF, 50 μM zVAD, and 5 μg/ml CHX for 20 h. (G) Colo357 cells stably overexpressing Bcl-XL or an empty vector were stimulated with 100 ng/ml killerTRAIL or 100 ng/ml hrTNF alone or in combination with 5 μg/ml CHX, 50 μM zVAD, and 1 μM the Smac mimetic birinapant (B) for 24 h. Shown are means ± standard deviations (panels A and B show data from one representative experiment for one repetition out of four) (n = 9 [C, F, and G]), with differences being considered significant at a P value of <0.001 (***) (as determined by a t test). n.s., nonsignificant. Insets show control Western blots for endogenous p38α, Bcl-2, Bcl-XL, and β-actin, which served as a loading control.
FIG 5
FIG 5
TRAIL-mediated necroptosis is executed through the chymotrypsin-like serine protease HtrA2/Omi. (A) Cells were stimulated with 20 μM zVAD and 30 ng/ml (14 h for L929Ts cells) or 100 ng/ml (16 h for NIH 3T3 cells) killerTRAIL; 50 μM zVAD, 2 μg/ml CHX, and 50 ng/ml killerTRAIL (20 h for Jurkat cells); or 20 μM zVAD, 5 μg/ml CHX, and 30 ng/ml killerTRAIL (16 h for HT-29 cells) in the presence of the indicated concentrations of TPCK. (B) Cells were pretreated for 2 h with Ucf-101, with the subsequent addition of 30 ng/ml killerTRAIL, 20 μM zVAD (14 h for L929Ts cells), and additionally 5 μg/ml CHX (16 h for HT-29 cells). (C) L929Ts cells (top) and HT-29 cells (bottom) were stimulated as described above for panel B, and necroptotic changes in morphology (arrowheads) were investigated by microscopic observation. Bar, 100 μm. (D) Cells were transfected with two different siRNAs specific for murine HtrA2/Omi (siRNAs 1 and 2) or a nontargeting control siRNA (NT). At 72 h posttransfection, cells were stimulated with 30 ng/ml killerTRAIL and 20 μM zVAD for 14 h. Measurement of intracellular ATP levels served as an indicator of cell viability. Control Western blots show downregulation of endogenous murine HtrA2/Omi in transfected but untreated cells and β-actin as a loading control. (E) Wild-type (WT) or HtrA2/Omi-deficient (HtrA2/Omi−/−) MEFs were incubated with 30 ng/ml killerTRAIL, 20 μM zVAD, and 1 μg/ml CHX for 16 h. Insets show control Western blots for endogenous HtrA2/Omi and the RIPK1 and RIPK3 kinases pivotal for signaling of necroptosis; β-actin served as a loading control. (F) Impact of HtrA2/Omi deficiency on morphology of MEFs undergoing TRAIL-mediated necroptosis. Cells were stimulated as described above for panel E. Arrowheads indicate cell morphology typical of necroptosis. Bar, 100 μm. Shown are means ± standard deviations (n = 4 [L929Ts and NIH 3T3], n = 6 [Jurkat and HT-29] [A and B], and n = 9 [E]; panel D shows data from one representative experiment in two repetitions out of two), with differences being considered significant at P values of <0.05 (*), <0.01 (**), and <0.001 (***) (as determined by a t test).
FIG 6
FIG 6
Ubiquitinated, active UCH-L1 is not involved in the execution of TRAIL-mediated necroptosis. (A) Cells were prestimulated for 3 h with the indicated concentrations of the UCH-L1 inhibitor LDN57444 (top) or LDN91946 (bottom), with the subsequent addition of either 30 ng/ml killerTRAIL and 20 μM zVAD for 14 h; 100 ng/ml hrTNF and 20 μM zVAD for 5 h (L929Ts); 50 ng/ml killerTRAIL, 50 μM zVAD, and 2 μg/ml CHX for 20 h (Jurkat); or 30 ng/ml killerTRAIL, 20 μM zVAD, and 5 μg/ml CHX for 16 h (HT-29). (B) L929Ts cells were treated as described above for panel A, and afterwards, necroptotic changes in morphology (arrowheads) were observed by microscopy. Bar, 100 μm. (C) Cells were transfected with siRNAs specific for murine UCH-L1 (siRNA) or a nontargeting control siRNA (NT). At 24 h posttransfection, cells were stimulated with 30 ng/ml killerTRAIL and 20 μM zVAD for 14 h. Measurement of intracellular ATP levels served as an indicator of cell viability. Shown are means ± standard deviations (n = 4 [A] and n = 3 [C], each with five repetitions, relative to untreated cells), with statistical significance at P values of <0.05 (*), <0.01 (**), and <0.001 (***) (as determined by a t test). n.s., nonsignificant. Control Western blots show downregulation of endogenous murine UCH-L1 (PAb) and β-actin as a loading control. (D) MEFs deficient for HtrA2/Omi and their wild-type counterparts were left untreated or treated with 100 ng/ml hrTNF or 30 ng/ml killerTRAIL, 20 μM zVAD, and 1 μg/ml CHX for 16 h. * and *** indicate the disappearance of the main form of UCH-L1 (MAb and PAb, respectively). ** indicates the appearance of an active, ubiquitinated form of UCH-L1 (PAb). (E) Cells were treated as described above for panel D, omitting hrTNF, for the indicated times. Further PAbs for UCH-L1 were used to analyze the appearance of the active form of UCH-L1. WB, Western blot.
FIG 7
FIG 7
(A and B) Autophagy does not play a crucial role in TNF- or TRAIL-mediated necroptosis in L929Ts or Jurkat I.42 cells. (A) L929ATCC cells were prestimulated for 2 h with the indicated concentrations of inhibitors of autophagy (3-MA), lysosome formation (CQ), or vesicle acidification (BafA1) and stimulated afterwards for 24 h with 20 μM zVAD. L929Ts cells were pretreated for 2 h with 3-MA, CQ, or BafA1 and stimulated with 20 μM zVAD, 30 ng/ml killerTRAIL for 14 h, or 100 ng/ml hrTNF for 5 h. Jurkat I.42 (FADD-deficient and TNF-R2-positive) cells were pretreated for 2 h with the indicated concentrations of 3-MA, CQ, or BafA1 before the addition of 50 μM zVAD in combination with 100 ng/ml hrTNF for 6 h. (B) Morphological analyses of the influence of 3-MA, CQ, or BafA1 on zVAD-induced autophagy in L929ATCC cells (top) and TRAIL-mediated (middle) and TNF-mediated (bottom) necroptosis in L929Ts cells. Cells were stimulated as described above for panel A. Bar, 100 μm. (C) Atg5 is required for both TRAIL- and TNF-mediated RIPK1-dependent necroptosis. Atg5-deficient immortalized MEFs, their wild-type counterparts, and Atg5-deficient cells retransfected with wild-type Atg5 (Atg5RE) or mutated Atg5 (Atg5T75A) were prestimulated or not with 50 μM Nec-1s for 2 h, followed by the addition of 30 ng/ml killerTRAIL or 100 ng/ml hrTNF, 20 μM zVAD, and/or 1 μg/ml CHX to induce necroptosis or 100 ng/ml hrTNF or 30 ng/ml killerTRAIL together with 1 μg/ml CHX to induce apoptosis for 18 h. In order to verify their authenticity, all cell lines were left untreated in full medium or treated for 2 h with Earle's balanced salt solution (EB SS) to induce autophagy by starvation accompanied by the appearance of LC3-II as an indicator of autophagy. Insets show Western blots for LC3 under normal and starvation conditions (Earle's balanced salt solution), with β-actin serving as a loading control. (D) Morphological analyses of necroptosis in Atg5-deficient cells retransfected with wild-type Atg5 (Atg5RE), mutated Atg5 (Atg5T75A), and their wild-type counterparts. Cells were stimulated as described above for panel C. The bar in microphotographs is 100 μm. (E) Lack of Atg16L1 protects cells from TNF-mediated but not TRAIL-mediated necroptosis. Atg16L1-deficient immortalized MEFs, their wild-type counterparts, and Atg16L1-deficient cells transiently retransfected for 48 h with wild-type Atg16L1 (Atg16L1RE) were prestimulated or not with 50 μM Nec-1s for 2 h, followed by stimulation with 30 ng/ml killerTRAIL or 100 ng/ml hrTNF together with 20 μM zVAD and/or 1 μg/ml CHX to induce necroptosis or with 30 ng/ml killerTRAIL or 100 ng/ml hrTNF together with 1 μg/ml CHX to induce apoptosis for 24 h. The authenticity of all cell lines and efficiency of transfection with Atg16L1 were verified by Western blotting, with β-actin serving as a loading control. (F) Morphological analyses of necroptosis in Atg16L1-deficient and wild-type MEFs and MEFs retransfected with wild-type Atg16L1 (Atg16L1RE). Cells were stimulated as described above for panel E. Arrowheads indicate typical necroptotic morphology. Bar, 100 μm. (G) Receptor internalization is necessary for TNF-mediated but not for TRAIL-mediated necroptosis. L929Ts cells were prestimulated for 1 h with the indicated concentrations of PitStop2 or dynasore and stimulated with 30 ng/ml killerTRAIL and 20 μM zVAD or with 100 ng/ml hrTNF and 20 μM zVAD. Shown are means ± standard deviations (n = 6 for L929Ts and n = 4 for Jurkat I.42 cells [A], n = 3 [C], and n = 6 [A]), and data were considered significant at a P value of <0.001 (***) (as determined by a t test). (H) TNF but not TRAIL receptor is internalized during necroptosis in L929Ts cells. Cell surface-bound receptors were coupled to Fc-TNF or Fc-TRAIL ligands labeled with protein G-Alexa Fluor 488 alone or in combination with 20 μM zVAD at 4°C, followed by a temperature shift to 37°C for 30 min. A minimum of 10,000 cells were analyzed for each sample. Internalization Wizard was used to measure the ratio of the intensity inside the cell to the intensity of the entire cell (percent). (I) Representative images of cells (bright field) with a stained plasma membrane and TNF or TRAIL ligand-receptor complexes. Colocalization of ligand-receptor complexes with the plasma membrane (yellow) and internalization of TNF ligand-receptor complexes but not TRAIL ligand-receptor complexes were observed after 30 min of stimulation.
FIG 7
FIG 7
(A and B) Autophagy does not play a crucial role in TNF- or TRAIL-mediated necroptosis in L929Ts or Jurkat I.42 cells. (A) L929ATCC cells were prestimulated for 2 h with the indicated concentrations of inhibitors of autophagy (3-MA), lysosome formation (CQ), or vesicle acidification (BafA1) and stimulated afterwards for 24 h with 20 μM zVAD. L929Ts cells were pretreated for 2 h with 3-MA, CQ, or BafA1 and stimulated with 20 μM zVAD, 30 ng/ml killerTRAIL for 14 h, or 100 ng/ml hrTNF for 5 h. Jurkat I.42 (FADD-deficient and TNF-R2-positive) cells were pretreated for 2 h with the indicated concentrations of 3-MA, CQ, or BafA1 before the addition of 50 μM zVAD in combination with 100 ng/ml hrTNF for 6 h. (B) Morphological analyses of the influence of 3-MA, CQ, or BafA1 on zVAD-induced autophagy in L929ATCC cells (top) and TRAIL-mediated (middle) and TNF-mediated (bottom) necroptosis in L929Ts cells. Cells were stimulated as described above for panel A. Bar, 100 μm. (C) Atg5 is required for both TRAIL- and TNF-mediated RIPK1-dependent necroptosis. Atg5-deficient immortalized MEFs, their wild-type counterparts, and Atg5-deficient cells retransfected with wild-type Atg5 (Atg5RE) or mutated Atg5 (Atg5T75A) were prestimulated or not with 50 μM Nec-1s for 2 h, followed by the addition of 30 ng/ml killerTRAIL or 100 ng/ml hrTNF, 20 μM zVAD, and/or 1 μg/ml CHX to induce necroptosis or 100 ng/ml hrTNF or 30 ng/ml killerTRAIL together with 1 μg/ml CHX to induce apoptosis for 18 h. In order to verify their authenticity, all cell lines were left untreated in full medium or treated for 2 h with Earle's balanced salt solution (EB SS) to induce autophagy by starvation accompanied by the appearance of LC3-II as an indicator of autophagy. Insets show Western blots for LC3 under normal and starvation conditions (Earle's balanced salt solution), with β-actin serving as a loading control. (D) Morphological analyses of necroptosis in Atg5-deficient cells retransfected with wild-type Atg5 (Atg5RE), mutated Atg5 (Atg5T75A), and their wild-type counterparts. Cells were stimulated as described above for panel C. The bar in microphotographs is 100 μm. (E) Lack of Atg16L1 protects cells from TNF-mediated but not TRAIL-mediated necroptosis. Atg16L1-deficient immortalized MEFs, their wild-type counterparts, and Atg16L1-deficient cells transiently retransfected for 48 h with wild-type Atg16L1 (Atg16L1RE) were prestimulated or not with 50 μM Nec-1s for 2 h, followed by stimulation with 30 ng/ml killerTRAIL or 100 ng/ml hrTNF together with 20 μM zVAD and/or 1 μg/ml CHX to induce necroptosis or with 30 ng/ml killerTRAIL or 100 ng/ml hrTNF together with 1 μg/ml CHX to induce apoptosis for 24 h. The authenticity of all cell lines and efficiency of transfection with Atg16L1 were verified by Western blotting, with β-actin serving as a loading control. (F) Morphological analyses of necroptosis in Atg16L1-deficient and wild-type MEFs and MEFs retransfected with wild-type Atg16L1 (Atg16L1RE). Cells were stimulated as described above for panel E. Arrowheads indicate typical necroptotic morphology. Bar, 100 μm. (G) Receptor internalization is necessary for TNF-mediated but not for TRAIL-mediated necroptosis. L929Ts cells were prestimulated for 1 h with the indicated concentrations of PitStop2 or dynasore and stimulated with 30 ng/ml killerTRAIL and 20 μM zVAD or with 100 ng/ml hrTNF and 20 μM zVAD. Shown are means ± standard deviations (n = 6 for L929Ts and n = 4 for Jurkat I.42 cells [A], n = 3 [C], and n = 6 [A]), and data were considered significant at a P value of <0.001 (***) (as determined by a t test). (H) TNF but not TRAIL receptor is internalized during necroptosis in L929Ts cells. Cell surface-bound receptors were coupled to Fc-TNF or Fc-TRAIL ligands labeled with protein G-Alexa Fluor 488 alone or in combination with 20 μM zVAD at 4°C, followed by a temperature shift to 37°C for 30 min. A minimum of 10,000 cells were analyzed for each sample. Internalization Wizard was used to measure the ratio of the intensity inside the cell to the intensity of the entire cell (percent). (I) Representative images of cells (bright field) with a stained plasma membrane and TNF or TRAIL ligand-receptor complexes. Colocalization of ligand-receptor complexes with the plasma membrane (yellow) and internalization of TNF ligand-receptor complexes but not TRAIL ligand-receptor complexes were observed after 30 min of stimulation.
FIG 8
FIG 8
(A to F) TRAIL-mediated necroptosis is not mediated by PARP-1. (A) L929Ts cells were pretreated for 2 h with the indicated concentrations of PARP-1 inhibitors and treated with 30 ng/ml killerTRAIL and 20 μM zVAD for 14 h. Furthermore, total lysates were prepared, and the quantitative presence of PAR chains was analyzed by Western blotting, with β-actin serving as a loading control. (B) Cells were pretreated as described above for panel A and stimulated with 30 ng/ml (14 h for L929Ts cells and 16 h for HT-29), 50 ng/ml (20 h for Jurkat cells), or 100 ng/ml (16 h for NIH 3T3 cells) killerTRAIL in combination with 20 μM (L929Ts, NIH 3T3, and HT-29) or 50 ng/ml (Jurkat) zVAD and additionally with 2 μg/ml (Jurkat) or 5 μg/ml (HT-29) of CHX. (C) L929Ts or Jurkat cells were transfected using nucleofection (nucleofected) with siRNA that does not target any RNA sequence (NT) or with siRNA specific for murine or human PARP-1 (siRNA). Seventy-two hours after transfection, the cells were stimulated with 30 ng/ml killerTRAIL and 20 μM zVAD (5 h for L929Ts cells) or 50 ng/ml killerTRAIL, 50 μM zVAD, and 2 μg/ml CHX (24 h for Jurkat cells). (D) Wild-type (WT) and PARP-1-deficient MEFs were stimulated with 50 ng/ml killerTRAIL, 20 μM zVAD, and 1 μg/ml CHX for 24 h. Insets show Western blots for PARP-1, with β-actin serving as a loading control. (E and F) L929Ts, NIH 3T3, Jurkat, and HT-29 cells were stimulated with 0.5 mM MNNG for 15 min and left in fresh medium without MNNG as a control for the indicated periods of time or were stimulated with 30 ng/ml (L929Ts and HT-29), 50 ng/ml (Jurkat), or 100 ng/ml (NIH 3T3) killerTRAIL in combination with 20 μM (L929Ts, NIH 3T3, and HT-29) or 50 μM (Jurkat) zVAD and additionally with 2 μg/ml (Jurkat) or 5 μg/ml (HT-29) of CHX for the indicated periods of time before their intracellular ATP content (E) and intracellular NAD+ content and loss of membrane integrity as determined by PI staining (F) were measured. (G) TRAIL-mediated necroptosis is increased by WIKI4 and XAV939. HT-29 cells were prestimulated for 2 h with the indicated concentrations of inhibitors and stimulated with 100 ng/ml killerTRAIL, 50 μM zVAD, and 5 μg/ml CHX for 24 h. Shown are means ± standard deviations (n = 3 [B], n = 6 [C], n = 9 [D], and n = 2 [E and F]), with differences being considered significant at P values of <0.05 (*), <0.01 (**), and <0.001 (***) (as determined by a t test). n.s., nonsignificant.
FIG 9
FIG 9
Overview of similarities and differences in signaling pathways of TRAIL- and TNF-mediated necroptosis in cancer cells. Death receptors such as TRAIL-R1/2 or TNF-R1 under caspase-compromised conditions (and, for some cancer cell lines, after sensitization with protein synthesis inhibitors) are able to mediate necroptosis. During necroptosis death receptors may be (for TNF-R1) internalized in a clathrin-dependent or clathrin-independent manner followed by receptosome formation or (for TRAIL-R1/R2) signaled without receptor internalization directly through formation of a necrosomal initiation complex. In the course of the first steps of necroptosis, membranes and membrane-bound molecules (e.g., Atg5 for TNF-R1 and TRAIL-R1/R2 and Atg16L1 for TNF-R1) are recruited to the necrosomal initiation complex consisting of, e.g., FADD (indispensable for TRAIL-R1/2 but not for TNF-R1) and, crucial for the execution of both TNF- and TRAIL-mediated necroptosis, proteins RIPK1 and RIPK3 (not shown), which are assembled in a filamentous fibril-like manner. Deficiency in some membrane-bound proteins such as Atg5 may inhibit the execution of TRAIL- and TNF-induced necroptosis. However, deficiency in other proteins such as Atg16L1 or inhibition of clathrin-dependent and -independent events reduces the level of TNF-induced necroptosis but enhances or has no influence, respectively, on TRAIL-induced necroptosis. Further phosphorylation events for RIPK1, RIPK3, and its downstream effector MLKL are necessary to execute necroptosis (not shown). The lack of the adaptor protein FADD within the necrosomal initiation complex abrogates the execution of TRAIL-induced necroptosis (Fig. 1G), but it potentiates the execution of TNF-induced necroptosis (88). As a consequence of necroptosis initiation, secondary messengers (i.e., ceramide) are produced by A-SMase and N-SMase as intracellular signals to promote necroptosis. As a result, a myriad of executive mechanisms in various cellular compartments is promoted to accomplish the execution of necroptosis. Inhibition of prosurvival pathways such as PARP-1, tankyrases (analyzed here only for TRAIL), and p38α leads to enhancement of TRAIL- and TNF-induced necroptosis. The executive, necroptotic pathway is built up by some common mechanisms, shared by both TRAIL- and TNF-induced necroptosis, that result in the same outcome, while they have been modulated (e.g., through inhibition, deficiency, or overexpression). However, among those executive mechanisms, some differences existed in TRAIL- or TNF-induced necroptosis. While for TNF-induced necroptosis inhibition of certain executive components led to a decrease in the level of cell death, e.g., through inhibition of lysosomal acidification and inhibition of UCH-L1, for TRAIL-induced necroptosis, on the contrary, modulation of those components led to an increase in or had no influence on the level of necroptosis. Along the way, some unique executive mechanisms were identified to play a role exclusively in TNF-induced necroptosis, such as monoubiquitination of UCH-L1. Moreover, overexpression of Bcl-XL did not influence TNF-induced necroptosis, but it reduced TRAIL-mediated necroptosis. The involvement of particular signaling molecules in the promotion or inhibition of TRAIL- and TNF-mediated necroptosis is described in detail in Discussion.

Similar articles

Cited by

References

    1. Jin Z, El-Deiry WS. 2005. Overview of cell death signaling pathways. Cancer Biol Ther 4:139–163. - PubMed
    1. Kroemer G, Galluzzi L, Vandenabeele P, Abrams J, Alnemri ES, Baehrecke EH, Blagosklonny MV, El-Deiry WS, Golstein P, Green DR, Hengartner M, Knight RA, Kumar S, Lipton SA, Malorni W, Nunez G, Peter ME, Tschopp J, Yuan J, Piacentini M, Zhivotovsky B, Melino G, Nomenclature Committee on Cell Death 2009. 2009. Classification of cell death: recommendations of the Nomenclature Committee on Cell Death 2009. Cell Death Differ 16:3–11. doi:10.1038/cdd.2008.150. - DOI - PMC - PubMed
    1. Galluzzi L, Vitale I, Abrams JM, Alnemri ES, Baehrecke EH, Blagosklonny MV, Dawson TM, Dawson VL, El-Deiry WS, Fulda S, Gottlieb E, Green DR, Hengartner MO, Kepp O, Knight RA, Kumar S, Lipton SA, Lu X, Madeo F, Malorni W, Mehlen P, Nunez G, Peter ME, Piacentini M, Rubinsztein DC, Shi Y, Simon HU, Vandenabeele P, White E, Yuan J, Zhivotovsky B, Melino G, Kroemer G. 2012. Molecular definitions of cell death subroutines: recommendations of the Nomenclature Committee on Cell Death 2012. Cell Death Differ 19:107–120. doi:10.1038/cdd.2011.96. - DOI - PMC - PubMed
    1. Kaczmarek A, Vandenabeele P, Krysko DV. 2013. Necroptosis: the release of damage-associated molecular patterns and its physiological relevance. Immunity 38:209–223. doi:10.1016/j.immuni.2013.02.003. - DOI - PubMed
    1. Voigt S, Philipp S, Davarnia P, Winoto-Morbach S, Roder C, Arenz C, Trauzold A, Kabelitz D, Schutze S, Kalthoff H, Adam D. 2014. TRAIL-induced programmed necrosis as a novel approach to eliminate tumor cells. BMC Cancer 14:74. doi:10.1186/1471-2407-14-74. - DOI - PMC - PubMed

Publication types

Substances