. 2016 Aug 30;113(35):9704-9.
doi: 10.1073/pnas.1604787113. Epub 2016 Aug 15.

Earliest land plants created modern levels of atmospheric oxygen

Affiliations

Earliest land plants created modern levels of atmospheric oxygen

Timothy M Lenton et al. Proc Natl Acad Sci U S A. .

Abstract

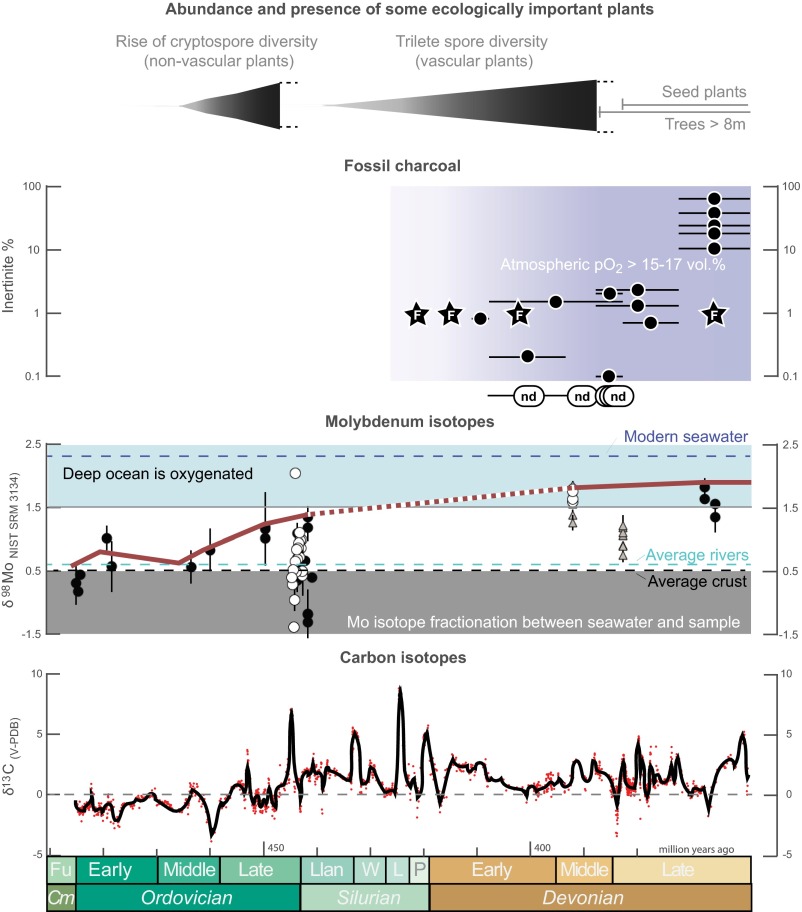
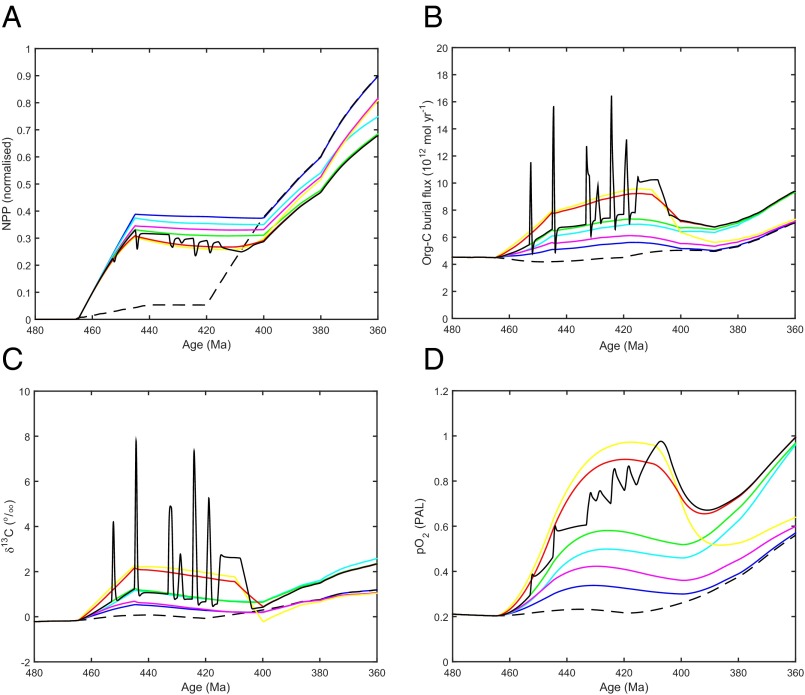
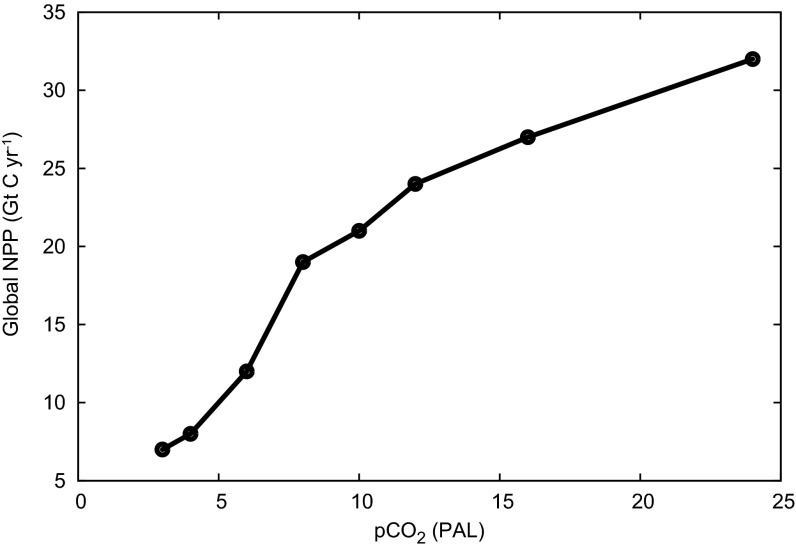
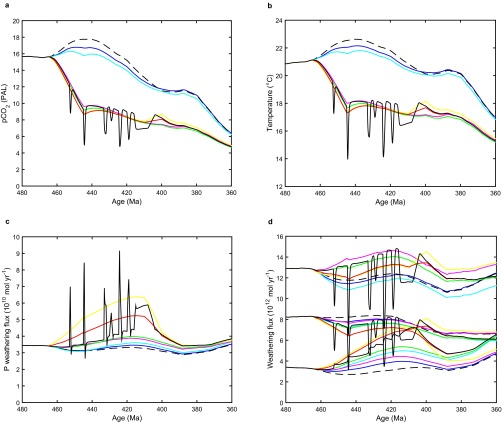
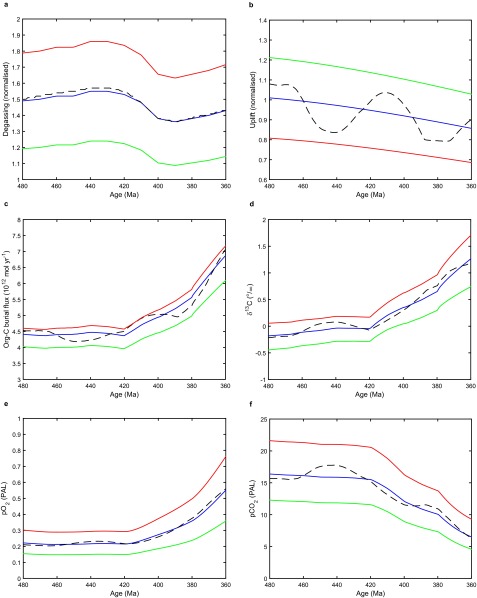
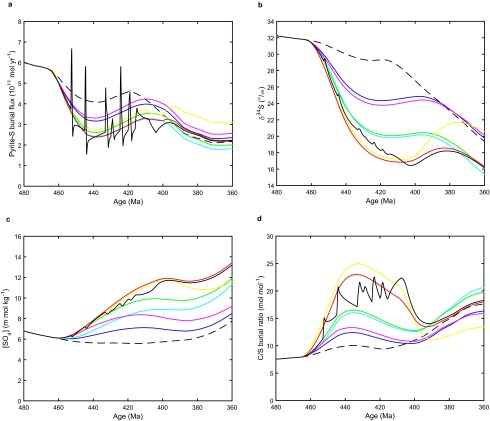
The progressive oxygenation of the Earth's atmosphere was pivotal to the evolution of life, but the puzzle of when and how atmospheric oxygen (O2) first approached modern levels (∼21%) remains unresolved. Redox proxy data indicate the deep oceans were oxygenated during 435-392 Ma, and the appearance of fossil charcoal indicates O2 >15-17% by 420-400 Ma. However, existing models have failed to predict oxygenation at this time. Here we show that the earliest plants, which colonized the land surface from ∼470 Ma onward, were responsible for this mid-Paleozoic oxygenation event, through greatly increasing global organic carbon burial-the net long-term source of O2 We use a trait-based ecophysiological model to predict that cryptogamic vegetation cover could have achieved ∼30% of today's global terrestrial net primary productivity by ∼445 Ma. Data from modern bryophytes suggests this plentiful early plant material had a much higher molar C:P ratio (∼2,000) than marine biomass (∼100), such that a given weathering flux of phosphorus could support more organic carbon burial. Furthermore, recent experiments suggest that early plants selectively increased the flux of phosphorus (relative to alkalinity) weathered from rocks. Combining these effects in a model of long-term biogeochemical cycling, we reproduce a sustained +2‰ increase in the carbonate carbon isotope (δ(13)C) record by ∼445 Ma, and predict a corresponding rise in O2 to present levels by 420-400 Ma, consistent with geochemical data. This oxygen rise represents a permanent shift in regulatory regime to one where fire-mediated negative feedbacks stabilize high O2 levels.

Keywords: Paleozoic; oxygen; phosphorus; plants; weathering.


Conflict of interest statement

The authors declare no conflict of interest.

Figures

Fig. 1.
Fig. 1.
Global changes during the Ordovician, Silurian, and Devonian periods. The rise of nonvascular plants [indicated by cryptospore diversity (32)] and then vascular plants [indicated by trilete spore diversity (18)] overlaps with the first appearances of fossil charcoal (Table S1). F, fossils; black dots, inertinite in coal; nd, none detected. Molybdenum isotope data (9) indicate oxygenation of the deep ocean, following an uncertain trajectory ∼440–390 Ma. Black circles indicate euxinic shales as defined by Fe speciation; white circles, euxinic shales as defined by Mo enrichment; gray triangles, ferruginous shales as defined by Fe speciation; blue area, isotope offset from oceanic input that requires a substantial Mn oxide sink in the deep oceans. The carbonate carbon isotope record (17) (red dots, black line is a smoothed spline fit) indicates elevated organic carbon burial (δ13C ∼2‰) from ∼445 Ma. Cm, Cambrian; Fu, Furongian; Llan, Llandovery; L, Ludlow; P, Pridoli; W, Wenlock.
Fig. 2.
Fig. 2.
Predicted Late Ordovician (445 Ma) NPP. Result from ecophysiological model of cryptogamic vegetation cover driven by simulated Late Ordovician (445 Ma) climate, atmospheric CO2 = 8 PAL, and atmospheric O2 = 0.6 PAL (14 vol%), with no ice sheet mask. Simulated global NPP = 18.7 GtC⋅y−1.
Fig. 3.
Fig. 3.
Predictions of mid-Paleozoic global carbon cycle change due to early plants from the updated COPSE model. (A) NPP. (B) Organic carbon burial (both terrestrial and marine-derived material). (C) Carbonate carbon isotope record (δ13C). (D) Atmospheric O2. Note that fossil charcoal 420–400 Ma indicates O2 > 0.66–0.77 PAL. (Further results of the same model runs are in Figs. S3 and S5.) Black dashed line indicates original baseline model run; blue, early plant colonization (C/P = 1,000); cyan, early plant colonization + C/P = 2,000; magenta, early plant colonization + biotic effects on silicate weathering (C/P = 1,000); green, early plant colonization + C/P = 2,000 + biotic effects on silicate weathering; yellow, early plant colonization + biotic effects on silicate weathering + 50% increase in P weathering; red, early plant colonization + C/P = 2,000 + biotic effects on silicate weathering + 25% increase in P weathering; black, early plant colonization + C/P = 2,000 + biotic effects on silicate weathering + spikes of P weathering.
Fig. S1.
Fig. S1.
Dependence of predicted Late Ordovician global NPP on atmospheric CO2 and resultant climate state (assuming atmospheric O2 = 0.6 PAL or 14 vol%, and no substantive ice sheet cover).
Fig. S2.
Fig. S2.
Predicted Late Ordovician (445 Ma) NPP constrained by ice sheet cover. Result from ecophysiological model of cryptogamic vegetation cover driven by simulated Late Ordovician (445 Ma) climate, atmospheric CO2 = 8 PAL, and atmospheric O2 = 0.6 PAL (14 vol%), with extensive ice sheet mask (dark green). Global NPP = 10.5 GtC⋅y−1.
Fig. S3.
Fig. S3.
Additional results for the central set of COPSE model runs (as in Fig. 3). (A) Atmospheric CO2. (B) Global temperature. (C) Phosphorus weathering flux. (D) Other weathering fluxes: carbonate (Top), silicate (Middle), and oxidative (Bottom). Key as in Fig. 3.
Fig. S4.
Fig. S4.
Uncertainty ranges on the geologic forcing factors degassing and uplift and their effects on model predictions. (A) Degassing. (B) Uplift. (C) Total organic carbon burial. (D) Carbonate carbon isotope record (δ13C). (E) Atmospheric O2. (F) Atmospheric CO2. Original model forcing scenario (black dashed line) compared with Royer central estimates (blue), and extreme combinations of weak degassing and strong uplift (green) and strong degassing and weak uplift (red).
Fig. S5.
Fig. S5.
Sulfur cycle results for the central set of COPSE model runs (as in Fig. 3). (A) Pyrite sulfur burial flux. (B) Marine sulfate sulfur isotope record (δ34S). (C) Ocean sulfate concentration ([SO4]). (D) Ratio of marine organic carbon burial to marine pyrite sulfur burial. Key as in Fig. 3.

References

    1. Canfield DE. Proterozoic Atmospheric Oxygen. In: Holland HD, Turekian KK, editors. Treatise on Geochemistry. 2nd Ed. Vol 6. Elsevier Science; Oxford: 2014. pp. 197–216.
    1. Lyons TW, Reinhard CT, Planavsky NJ. The rise of oxygen in Earth’s early ocean and atmosphere. Nature. 2014;506(7488):307–315. - PubMed
    1. Lenton TM, Boyle RA, Poulton SW, Shields GA, Butterfield NJ. Co-evolution of eukaryotes and ocean oxygenation in the Neoproterozoic era. Nat Geosci. 2014;7(4):257–265.
    1. Shields-Zhou GA, Och LM. The case for a Neoproterozoic oxygenation event: Geochemical evidence and biological consequences. GSA Today. 2011;21(3):4–11.
    1. Och LM, Shields-Zhou GA. The Neoproterozoic Oxygenation Event: Environmental perturbations and biogeochemical cycling. Earth Sci Rev. 2012;110(1-4):26–57.

Publication types