. 2016 Aug 30;113(35):E5242-9.
doi: 10.1073/pnas.1519555113. Epub 2016 Aug 15.

Rapid hyperosmotic-induced Ca2+ responses in Arabidopsis thaliana exhibit sensory potentiation and involvement of plastidial KEA transporters

Affiliations

Rapid hyperosmotic-induced Ca2+ responses in Arabidopsis thaliana exhibit sensory potentiation and involvement of plastidial KEA transporters

Aaron B Stephan et al. Proc Natl Acad Sci U S A. .

Abstract

Plants experience hyperosmotic stress when faced with saline soils and possibly with drought stress, but it is currently unclear how plant roots perceive this stress in an environment of dynamic water availabilities. Hyperosmotic stress induces a rapid rise in intracellular Ca(2+) concentrations ([Ca(2+)]i) in plants, and this Ca(2+) response may reflect the activities of osmo-sensory components. Here, we find in the reference plant Arabidopsis thaliana that the rapid hyperosmotic-induced Ca(2+) response exhibited enhanced response magnitudes after preexposure to an intermediate hyperosmotic stress. We term this phenomenon "osmo-sensory potentiation." The initial sensing and potentiation occurred in intact plants as well as in roots. Having established a quantitative understanding of wild-type responses, we investigated effects of pharmacological inhibitors and candidate channel/transporter mutants. Quintuple mechano-sensitive channels of small conductance-like (MSL) plasma membrane-targeted channel mutants as well as double mid1-complementing activity (MCA) channel mutants did not affect the response. Interestingly, however, double mutations in the plastid K(+) exchange antiporter (KEA) transporters kea1kea2 and a single mutation that does not visibly affect chloroplast structure, kea3, impaired the rapid hyperosmotic-induced Ca(2+) responses. These mutations did not significantly affect sensory potentiation of the response. These findings suggest that plastids may play an important role in early steps mediating the response to hyperosmotic stimuli. Together, these findings demonstrate that the plant osmo-sensory components necessary to generate rapid osmotic-induced Ca(2+) responses remain responsive under varying osmolarities, endowing plants with the ability to perceive the dynamic intensities of water limitation imposed by osmotic stress.

Keywords: abscisic acid; calcium; osmotic sensing; plastid; salt stress.


Conflict of interest statement

The authors declare no conflict of interest.

Figures
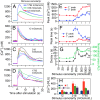
Fig. 1.
Fig. 1.
Osmotic dose dependency of rapid Ca2+ response parameters. (A) Average [Ca2+]i responses (solid lines) ± SEM (transparent shading) of 39–40 seedlings stimulated with an application of NaCl solutions resulting in an osmolarity of 12 (red), 316 (green), or 1,792 (blue) mOsmol/L at time = 0. (BD) Six representative individual seedling Ca2+ responses to selected solution osmolarities. Note the differing y axis scales in BD. (EG) Influence of stimulus osmolarity on measured parameters of the Ca2+ response, including primary (1°) and secondary (2°) peak amplitudes (E), time from stimulation to the peaks (F), and response termination kinetics as quantified by the decay constant τ (black trace) and the area under the normalized response curve (green trace) (G). n = 31–40 seedlings per data point in EG. Statistical comparisons were made between the lowest and highest stimulus concentrations using one-way ANOVA with the Tukey honestly significant difference (HSD) post hoc test. ***P < 0.001. (H) Baseline Ca2+ concentrations immediately preceding (pre) and 2, 4, and 6 min following stimulation with NaCl solutions to result in the indicated osmolarity. Error bars represent ± SEM.
Fig. S1.
Fig. S1.
Calibrated Ca2+ measurements are independent of total aequorin expression levels. Three wild-type Col-0 lines independently transformed with T-DNAs encoding the aequorin Ca2+ reporter under the control of the 35S promoter. (A) Average total counts of aequorin remaining after hyperosmotic stimulation, determined by application of 2-M CaCl2 + 20% ethanol. (B) Average calibrated primary peak Ca2+ measurements ± SEM in response to 316 mOsmol/L stimulation. See Materials and Methods for computation of free Ca2+. Statistical comparisons between lines were made by one-way ANOVA with the Tukey HSD post hoc test. **P < 0.01; ***P < 0.001; N.S., P > 0.05. n = 15–27 seedlings per line.
Fig. 2.
Fig. 2.
Potentiation of rapid hyperosmotic-induced Ca2+ responses by prior exposure of seedlings to hyperosmotic stress. (A) Average Ca2+ responses (solid lines) ± SEM (transparent shading) of seedlings preexposed for 1–2 h to low-osmolarity (21 mOsmol/L, black trace) and high-osmolarity (149 mOsmol/L, red trace) medium, stimulated with an injection of 0.7 volumes of 700-mM sorbitol solution at time = 0. n = 40 seedlings per trace. (BD) Influence of starting osmolarity before stimulation on measured parameters of the Ca2+ response, including primary and secondary peak amplitudes (B), time from stimulation to the peaks (C), and response termination kinetics as quantified by the decay constant τ (black trace) and the area under the normalized response curve (green trace) (D). n = 40 seedlings per data point in BD. Statistical comparisons were made between an indicated data point and the lowest starting osmolarity data point using one-way ANOVA with the Tukey HSD post hoc test. (E) Time course of sensory potentiation, comparing primary peak amplitudes of seedlings stimulated with an application of hyperosmotic medium and preexposed to low-osmolarity (21 mOsmol/L; green trace) or high-osmolarity (149 mOsmol/L; blue trace) medium as a function of time from preexposure to time of stimulation. n = 62–69 seedlings per data point. Statistical comparisons were made between preexposure to 21 mOsmol/L and preexposure to 149 mOsmol/L at each time point using one-way ANOVA with the Tukey HSD post hoc test. (F) Reversibility of sensory potentiation assessed by serial exposure to either low-osmolarity (21 mOsmol/L) or high-osmolarity (149 mOsmol/L) medium. n = 91–93 seedlings per data point. (G) Ca2+ responses were recorded in the presence of starting osmolarities of 0 or 200 mOsmol/L and ending osmolarities of 200 or 400 mOsmol/L imposed by sorbitol stress. n = 46–58 seedlings per condition. Error bars represent ± SEM. Statistical comparisons were made between conditions using one-way ANOVA with the Tukey HSD post hoc test. *P < 0.05; **P < 0.01; ***P < 0.001; N.S., P > 0.05.
Fig. S2.
Fig. S2.
Cross-potentiation between sorbitol and NaCl stress and examples of individual responses. (A) Average primary peak Ca2+ measurements ± SEM of seedlings stimulated with an application of hyperosmotic sorbitol solution. The seedlings were preexposed to solutions of water (no additional osmolytes) or to moderate hyperosmotic stress (149 mOsmol/L) by application of sorbitol or NaCl solutions. n = 30–32 seedlings per treatment group. (B) Average primary peak Ca2+ measurements ± SEM of seedlings stimulated with an application of hyperosmotic NaCl solution. The seedlings were preexposed to solutions of water (no additional osmolytes) or to mild hyperosmotic stress (149 mOsmol/L) by application of sorbitol solution. Data in B are from a larger experiment that includes data from Fig. 1 AG. Statistical comparisons between lines were made by one-way ANOVA with the Tukey HSD post hoc test. **P < 0.01; ***P < 0.001; N.S., P > 0.05. n = 29 seedlings per preexposure group. (C and D) Six examples of individual seedling Ca2+ responses to 0.7 volumes of 700 mOsmol/L sorbitol starting at the indicated solution osmolarity, resulting in final osmolarities of 316 mOsmol/L (C) and 388 mOsmol/L (D). Note the differing y axis scales in C and D.
Fig. 3.
Fig. 3.
Rapid hyperosmotic-induced Ca2+ responses and potentiation occur primarily in roots. (A) Average Ca2+ responses (solid lines) ± SEM (transparent shading) of 1-wk-old whole seedlings (red trace), isolated roots (green trace), and isolated shoots (blue trace) preexposed for 1–2 h to low-osmolarity (21 mOsmol/L) medium and stimulated with an application of hyperosmotic sorbitol solution at time = 0. n = 37–40 seedlings per trace. (B) Primary peak amplitudes whole seedlings, isolated roots, and isolated shoots stimulated with an application of hyperosmotic medium and preexposed to low-osmolarity (21 mOsmol/L) or moderate-osmolarity (149 mOsmol/L) medium. Error bars represent ± SEM. Statistical comparisons were made between starting osmolarity conditions using one-way ANOVA with the Tukey HSD post hoc test. P values are indicated. (C and D) Pseudocolored photographs depicting light emission of intact whole seedlings in response to hyperosmotic shock (1 M sorbitol, signal integrated for 30 s) (C) and subsequently to 2 M CaCl2 + 20% ethanol, which discharges all remaining aequorin (signal integrated for 1 min) (D).
Fig. 4.
Fig. 4.
Influence of ABA on Ca2+ response amplitudes and potentiation. (A) Average Ca2+ responses (solid lines) ± SEM (transparent shading) of 1-wk-old whole seedlings preexposed for 1–2 h to low-osmolarity (21 mOsmol/L) medium with or without ABA at the indicated concentrations and stimulated with an application of hyperosmotic sorbitol solution at time = 0. n = 20–23 seedlings per trace. (B) Quantification of primary peak amplitudes in A. Statistical comparisons were made between conditions using one-way ANOVA with the Tukey HSD post hoc test. **P < 0.01; N.S., P > 0.05. (C) Additive effects of preexposure to ABA and elevated osmolarity on Ca2+ responses in seedlings stimulated with an application of hyperosmotic medium. n = 47–48 seedlings per data point. Two-way ANOVA analysis revealed that ABA preexposure and starting osmolarity preexposure significantly increased the primary peak amplitudes (P = 2.3 × 10⁻⁴ and P = 6.79 × 10⁻⁸, respectively), but there was no detectable interaction between the treatments (P = 0.89). P values were calculated by the Tukey HSD post hoc test. *P < 0.05; ***P < 0.001. (D) Effects of the ABA antagonist HS-ABA (100 μM) on hyperosmotic-induced Ca2+ response amplitudes in seedlings preexposed to low- or high-osmolarity medium. n = 30–32 seedlings per data point. Error bars represent ± SEM. Two-way ANOVA revealed that starting osmolarity and HS-ABA treatment had large effects on primary peak amplitudes (P = 1.8 × 10⁻⁴ and P < 2 × 10⁻¹⁶, respectively). No significant interaction was seen between HS-ABA treatment and starting osmolarity. Depicted P values were calculated by the Tukey HSD post hoc test. *P < 0.05; **P < 0.01; ***P < 0.001; N.S., not significant. The influence of ABA on the Ca2+ response amplitudes was observed in 6 of 12 experiments. A and B show one experiment, and C shows another experiment.
Fig. S3.
Fig. S3.
Pharmacological inhibition of rapid osmotic-induced Ca2+ responses. (A and B) Effects of 10 mM LaCl3 treatment. (C and D) Effects of 1 mM GdCl3 treatment. (E and F) Effects of 1.3 mM amiloride treatment. (G and H) Effects of 100 μM diltiazem treatment. (A, C, E, and G) Average Ca2+ response traces of 1-wk-old whole seedlings stimulated with an application of hyperosmotic NaCl solution at time = 0. (B, D, F, and H) Primary peak amplitudes. Each dot represents one seedling. Horizontal bars represent mean ± SEM. Student's t test was used to calculate the P values shown.
Fig. S4.
Fig. S4.
Analysis of osmotic-induced Ca2+ responses in mechanosensitive channel mutants. (A) Average Ca2+ responses of 1-wk-old whole seedlings stimulated with an application of hyperosmotic NaCl solution at time = 0. (B) Primary peak amplitudes. Error bars represent ± SEM. One-way ANOVA showed no significant differences between genotypes.
Fig. 5.
Fig. 5.
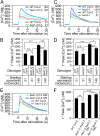
Plastidial kea mutations reduce rapid hyperosmotic-induced Ca2+ response amplitudes but do not eliminate sensory potentiation. (A) Average Ca2+ responses (solid lines) ± SEM (transparent shading) of 1-wk-old wild-type (Col-0) or kea1-2; kea2-2 double mutant seedlings preexposed for 1–2 h to low-osmolarity (21 mOsmol/L) or high-osmolarity (149 mOsmol/L) medium and stimulated with an application of hyperosmotic sorbitol solution at time = 0. n = 44–64 seedlings per trace. (B) Quantification of primary peak amplitudes in A. Two-way ANOVA demonstrated that the effects of both genotype and starting osmolarity on primary peak amplitudes were highly significant (P = 2.77 × 10⁻⁷ and 2.0 × 10⁻¹⁷, respectively) and that the interaction between genotype and starting osmolarity was also significant (P = 0.01). Statistical comparisons were made with the Tukey HSD post hoc test. (C) Average Ca2+ responses (solid lines) ± SEM (transparent shading) of 1-wk-old wild-type (Col-0) or kea3-1 mutant seedlings preexposed for 1–2 h to low-osmolarity (21 mOsmol/L) or high-osmolarity (149 mOsmol/L) medium and stimulated with an application of hyperosmotic sorbitol solution at time = 0. n = 28–66 seedlings per trace. (D) Quantification of primary peak amplitudes in C. Two-way ANOVA demonstrated that the effects of both genotype and starting osmolarity on primary peak amplitudes were significant (P = 4.5 × 10⁻⁴ and 6.69 × 10⁻¹⁰, respectively), but the interaction between genotype and starting osmolarity was not significant (P = 0.59). Statistical comparisons were made with the Tukey HSD post hoc test. (E and F) Genetic complementation with a wild-type copy of Kea2 can rescue the reduced amplitude phenotype of the kea1-2;kea2-2 double mutant. C#1 and C#2 represent independent complementation lines. Error bars represent ± SEM. Statistical comparisons were made using one-way ANOVA with the Tukey HSD post hoc test. *P < 0.05; **P < 0.01; ***P < 0.001; N.S., P > 0.05.

References

    1. Hu H, Xiong L. Genetic engineering and breeding of drought-resistant crops. Annu Rev Plant Biol. 2014;65(1):715–741. - PubMed
    1. Deinlein U, et al. Plant salt-tolerance mechanisms. Trends Plant Sci. 2014;19(6):371–379. - PMC - PubMed
    1. Farooq M, Wahid A, Kobayashi N, Fujita D, Basra SMA. Plant drought stress: Effects, mechanisms and management. In: Lichtfouse E, Navarrete M, Debaeke P, Véronique S, Alberola C, editors. Sustainable Agriculture. Springer Netherlands; Dordrecht, The Netherlands: 2009. pp. 153–188.
    1. Haswell ES, Verslues PE. The ongoing search for the molecular basis of plant osmosensing. J Gen Physiol. 2015;145(5):389–394. - PMC - PubMed
    1. Knight H, Trewavas AJ, Knight MR. Calcium signalling in Arabidopsis thaliana responding to drought and salinity. Plant J. 1997;12(5):1067–1078. - PubMed

Publication types

MeSH terms