. 2016 Aug 30;113(35):9940-5.
doi: 10.1073/pnas.1610432113. Epub 2016 Aug 15.

Mapping signaling pathway cross-talk in Drosophila cells

Affiliations

Mapping signaling pathway cross-talk in Drosophila cells

Noemie Ammeux et al. Proc Natl Acad Sci U S A. .

Abstract

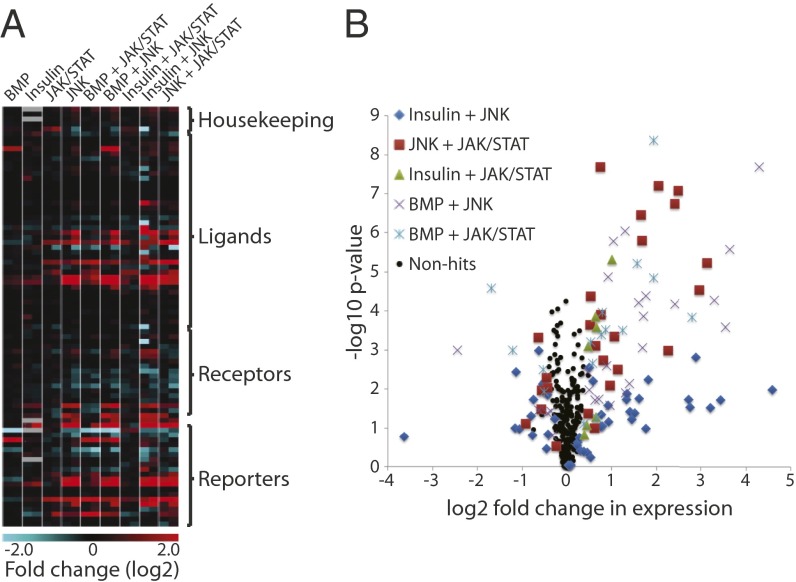
During development and homeostasis, cells integrate multiple signals originating either from neighboring cells or systemically. In turn, responding cells can produce signals that act in an autocrine, paracrine, or endocrine manner. Although the nature of the signals and pathways used in cell-cell communication are well characterized, we lack, in most cases, an integrative view of signaling describing the spatial and temporal interactions between pathways (e.g., whether the signals are processed sequentially or concomitantly when two pathways are required for a specific outcome). To address the extent of cross-talk between the major metazoan signaling pathways, we characterized immediate transcriptional responses to either single- or multiple pathway stimulations in homogeneous Drosophila cell lines. Our study, focusing on seven core pathways, epidermal growth factor receptor (EGFR), bone morphogenetic protein (BMP), Jun kinase (JNK), JAK/STAT, Notch, Insulin, and Wnt, revealed that many ligands and receptors are primary targets of signaling pathways, highlighting that transcriptional regulation of genes encoding pathway components is a major level of signaling cross-talk. In addition, we found that ligands and receptors can integrate multiple pathway activities and adjust their transcriptional responses accordingly.

Keywords: Drosophila; signaling cross-talk; signaling networks; signaling pathways; transcriptional regulation.


Conflict of interest statement

The authors declare no conflict of interest.

Figures

Fig. 1.
Fig. 1.
Genes regulated by single-pathway inductions. (A) Reagents used to stimulate each signaling pathway. (B) Expression changes of primary target genes at 30 min (light gray) and 1 h (dark gray). Bars represent the log2 fold changes of induced versus control samples from two biological replicates. Error bars indicate the minimum and maximum values. (C) Heat map showing expression changes of all genes included in the Nanostring code set at five time points following pathway stimulations (15 min, 30 min, 1 h, 2 h, and 6 h). Transcript levels are displayed as log2 fold change of normalized counts compared with nontreated cells. (D) Volcano plot representing statistical significance as a function of average fold change in gene expression for the pathway stimulations indicated. Averages of 30-min and 1-h time points are displayed in the graph to simplify visualization. Enlarged versions of single assay plots are shown in Fig. S3.
Fig. 2.
Fig. 2.
Genes regulated by combinatorial pathway inductions. (A) Expression heat map for all genes at two time points (30 min and 1 h) following either single- or combinatorial pathway stimulations. Transcript levels are displayed as the average log2 fold change of normalized counts in induced versus control samples from three biological replicates. (B) Volcano plot of combinatorial stimulation assays as described in Fig. 1D. Enlarged versions are shown in Fig. S3.
Fig. 3.
Fig. 3.
Validation of target genes by qPCR and RNA-seq. (A) Graph comparing fold changes determined by qPCR and Nanostring for JNK stimulations at 30 min and 1 h. Black dots represent average fold change determined from two replicates of qPCR and three replicates of Nanostring assays. Correlation coefficient = 0.90. (B) Graph comparing expression levels under control or Upd-stimulated conditions measured by Nanostring or RNA-seq. Black dots represent log2 average normalized counts from three biological replicates for Nanostring and two biological replicates for RNA-seq. Correlation coefficient = 0.86. (C) Table showing fold change of JAK/STAT target genes measured using Nanostring or RNA-seq under the conditions indicated. P values are shown in parentheses. Max expression indicates the maximum number of reads under any condition measured by RNA-seq. NA, not applicable. (D) Relationships (lines) between signaling pathways, ligands (pink circles), and receptors (green polygons) identified in the single-pathway stimulation assays. Pathway activation can induce (arrows) or repress (bars) the expression of pathway components (yellow rectangles).

References

    1. Perrimon N, Pitsouli C, Shilo B-Z. Signaling mechanisms controlling cell fate and embryonic patterning. Cold Spring Harb Perspect Biol. 2012;4(8):a005975. - PMC - PubMed
    1. Friedman A, Perrimon N. Genetic screening for signal transduction in the era of network biology. Cell. 2007;128(2):225–231. - PubMed
    1. Doroquez DB, Rebay I. Signal integration during development: Mechanisms of EGFR and Notch pathway function and cross-talk. Crit Rev Biochem Mol Biol. 2006;41(6):339–385. - PubMed
    1. Housden BE, Perrimon N. Spatial and temporal organization of signaling pathways. Trends Biochem Sci. 2014;39(10):457–464. - PMC - PubMed
    1. Vivekanand P, Rebay I. Intersection of signal transduction pathways and development. Annu Rev Genet. 2006;40:139–157. - PubMed

Publication types

MeSH terms